You are not logged in.
This means you
CAN ONLY VIEW reports that were published prior to Thursday, April 17, 2025.
You
MUST UPGRADE YOUR MEMBERSHIP if you want to see any current reports.
AFTER MARKET UPDATE - THURSDAY, MAY 3RD, 2018
Previous After Market Report Next After Market Report >>>
|
|
|
|
DOW |
+5.17 |
23,930.15 |
+0.02% |
|
Volume |
856,767,730 |
-6% |
|
Volume |
2,345,597,400 |
+10% |
|
NASDAQ |
-12.75 |
7,088.15 |
-0.18% |
|
Advancers |
1,226 |
42% |
|
Advancers |
1,013 |
36% |
|
S&P 500 |
-5.94 |
2,629.73 |
-0.23% |
|
Decliners |
1,718 |
58% |
|
Decliners |
1,816 |
64% |
|
Russell 2000 |
-8.36 |
1,546.56 |
-0.54% |
|
52 Wk Highs |
56 |
|
|
52 Wk Highs |
63 |
|
|
S&P 600 |
-6.33 |
947.08 |
-0.66% |
|
52 Wk Lows |
121 |
|
|
52 Wk Lows |
84 |
|
|
 |
Leadership Waned as Major Indices Ended Mixed
Kenneth J. Gruneisen - Passed the CAN SLIM® Master's Exam
Stocks finished mixed Thursday. The Dow added 5 points to 23930, while the S&P 500 lost 5 points to 2629. The Nasdaq Composite was down 12 points to 7088. The volume totals reported were mixed, lighter than the prior session total on the NYSE and higher on the Nasdaq exchange. Decliners led advancers by a 3-2 margin on the NYSE and by a 9-5 margin on the Nasdaq exchange. Leadership waned as there were 22 high-ranked companies from the Leaders List that made new 52-week highs and were listed on the BreakOuts Page, versus the total of 38 on the prior session. New 52-week lows outnumbered new 52-week highs on the NYSE and on the Nasdaq exchange. The major indices (M criteria) have slumped as the latest confirmed rally has come under pressure. New buying efforts are justified only when all key criteria of the fact-based investment system are satisfied. The Featured Stocks Page provides the most timely analysis on high-ranked leaders. Charts used courtesy of www.stockcharts.com
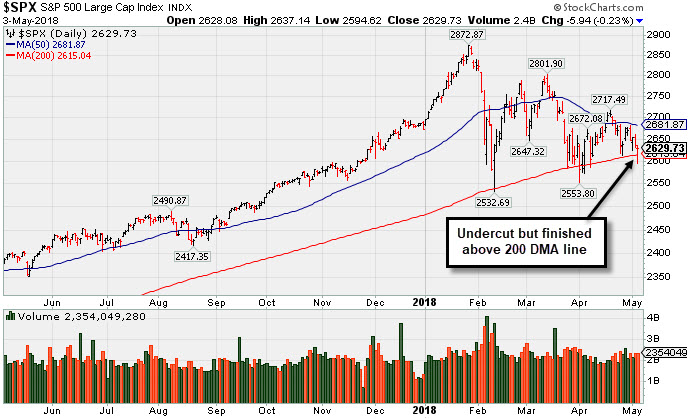 PICTURED: The S&P 500 Index undercut its 200-day moving average (DMA) line but finished the session above that important long-term average. Below the 200 DMA line the prior lows define important near-term support.
U.S. equities pared earlier declines that caused the Dow and S&P 500 to briefly slip below their 200-day moving averages during the session. Investors digested corporate earnings and kept an eye on geopolitical news. Several top administration officials, led by Treasury Secretary Steven Mnuchin, are meeting with Chinese leaders to negotiate trade. On the data front, initial jobless claims increased to 211,000 in the prior week, but remain near the lowest level since 1973. A separate release showed March factory orders increased more than expected. Elsewhere, a report revealed the U.S. trade deficit narrowed in March.
Eight of 11 S&P 500 sectors closed in negative territory. Financials lagged with American International Group (AIG -5.29%) fell after missing earnings and revenue expectations. Health Care underperformed with Cardinal Health (CAH -21.42%) fell after missing analyst profit forecasts. In other earnings, electric car maker Tesla (TSLA -5.55%) despite topping consensus estimates. Kellogg (K +2.65%) while Kraft Heinz (KHC +1.38%) rose after both companies topped earnings projections.
Treasuries strengthened with the yield on the 10-year note down two basis points to 2.95%. In commodities, WTI crude climbed 0.8% to $68.49/barrel. COMEX gold gained 0.5% to $1312.40/ounce amid a weaker dollar. |
 Kenneth J. Gruneisen started out as a licensed stockbroker in August 1987, a couple of months prior to the historic stock market crash that took the Dow Jones Industrial Average down -22.6% in a single day. He has published daily fact-based fundamental and technical analysis on high-ranked stocks online for two decades. Through FACTBASEDINVESTING.COM, Kenneth provides educational articles, news, market commentary, and other information regarding proven investment systems that work in good times and bad.
Comments contained in the body of this report are technical opinions only and are not necessarily those of Gruneisen Growth Corp. The material herein has been obtained from sources believed to be reliable and accurate, however, its accuracy and completeness cannot be guaranteed. Our firm, employees, and customers may effect transactions, including transactions contrary to any recommendation herein, or have positions in the securities mentioned herein or options with respect thereto. Any recommendation contained in this report may not be suitable for all investors and it is not to be deemed an offer or solicitation on our part with respect to the purchase or sale of any securities. |
|
 |
Financial, Retail, and Biotech Indexes Fell
Kenneth J. Gruneisen - Passed the CAN SLIM® Master's Exam
On Thursday the Broker/Dealer Index ($XBD -1.01%) and the Bank Index ($BKX -0.73%) outpaced the Retail Index ($RLX -0.31%) to the downside. The tech sector was mixed as the Biotech Index ($BTK -0.94%) declined while the Networking Index ($NWX -0.09%) finished flat and the Semiconductor Index ($SOX +0.64%) rose. The Integrated Oil Index ($XOI +0.45%) and the Gold & Silver Index ($XAU +0.56%) each posted a modest gain while the fell. Charts courtesy of www.stockcharts.com
 PICTURED: The Oil Services Index ($OSX -0.82%) has been consolidating after rebounding toward its January high.
| Oil Services |
$OSX |
153.75 |
-1.28 |
-0.83% |
+2.81% |
| Integrated Oil |
$XOI |
1,475.76 |
+6.62 |
+0.45% |
+10.50% |
| Semiconductor |
$SOX |
1,267.44 |
+8.02 |
+0.64% |
+1.15% |
| Networking |
$NWX |
527.92 |
-0.47 |
-0.09% |
+7.62% |
| Broker/Dealer |
$XBD |
283.31 |
-2.89 |
-1.01% |
+6.81% |
| Retail |
$RLX |
2,018.87 |
-6.29 |
-0.31% |
+16.44% |
| Gold & Silver |
$XAU |
82.38 |
+0.46 |
+0.56% |
-3.39% |
| Bank |
$BKX |
105.46 |
-0.77 |
-0.72% |
-1.17% |
| Biotech |
$BTK |
4,423.33 |
-42.18 |
-0.94% |
+4.76% |
|
|
|
 |
Violation of 50-Day Average Triggered Technical Sell Signal
Kenneth J. Gruneisen - Passed the CAN SLIM® Master's Exam
Paycom Software Inc (PAYC +$0.74 or +0.71% to $105.12) managed a positive reversal today after an early loss. It gapped down on the prior session and violated its 50-day moving average (DMA) line ($108.53) triggering a technical sell signal. Recent lows in the $101 area define important support to watch where further deterioration would raise more serious concerns. A rebound above the 50 DMA line is needed for its outlook to improve.
Fundamentals remain strong. It recently reported earnings +56% on +29% sales revenues for the Mar '18 quarter, continuing its strong earnings track record. It has earned a 98 Earnings Per Share Rating. . Disciplined investors avoid chasing stocks more than +5% above prior highs and always limit losses by selling any stock that falls more than -7% from their purchase price. PAYC was last shown in this FSU section on 4/04/18 with an annotated graph under the headline, "Pulling Back After Negative Reversal at All-Time High Last Week".
The high-ranked Computer Software - Enterprise firm's current Up/Down Volume ratio of 1.1 is an unbiased indication its shares have been under slight accumulation over the past 50 days. The number of top-rated funds owning its shares rose from 384 in Jun '17 to 423 in Mar '18, a reassuring sign concerning the I criteria. It has a Timeliness rating of A and Sponsorship rating of B. It completed Secondary Offerings on on 11/13/15, 9/16/15, 5/15/15 and 1/14/15 since its $15 IPO on 4/15/14. |
|
|
Color Codes Explained :
Y - Better candidates highlighted by our
staff of experts.
G - Previously featured
in past reports as yellow but may no longer be buyable under the
guidelines.
***Last / Change / Volume data in this table is the closing quote data***
Symbol/Exchange
Company Name
Industry Group |
PRICE |
CHANGE
(%Change) |
Day High |
Volume
(% DAV)
(% 50 day avg vol) |
52 Wk Hi
% From Hi |
Featured
Date |
Price
Featured |
Pivot Featured |
|
Max Buy |
PFBC
-
NASDAQ
Preferred Bank Los Angls
BANKING - Regional - Pacific Banks
|
$62.78
|
-0.26
-0.41% |
$63.04
|
72,295
85.46% of 50 DAV
50 DAV is 84,600
|
$67.65
-7.20%
|
4/10/2018
|
$64.56
|
PP = $67.75
|
|
MB = $71.14
|
Most Recent Note - 5/1/2018 1:05:56 PM
G - Color code is changed to green while slumping below its 50 DMA line ($64.84) this week and also undercutting the prior low, raising concerns and triggering technical sell signals. A prompt rebound above the 50 DMA line is needed for its outlook to improve.
>>> FEATURED STOCK ARTICLE : Bank Stock Hovering Within Striking Distance of Prior High - 4/10/2018 |
View all notes |
Set NEW NOTE alert |
Company Profile |
SEC
News |
Chart |
Request a new note
C
A
S
I |
SIVB
-
NASDAQ
S V B Financial Group
BANKING - Regional - Pacific Banks
|
$303.48
|
-2.53
-0.83% |
$306.09
|
637,222
80.25% of 50 DAV
50 DAV is 794,000
|
$309.40
-1.91%
|
3/12/2018
|
$267.79
|
PP = $263.19
|
|
MB = $276.35
|
Most Recent Note - 5/2/2018 5:14:09 PM
G - Color code is changed to green. Holding its ground stubbornly following a big "breakaway gap" for a new high on 4/27/18. Bullish action came after it reported financial results for the quarter ended March 31, 2018 and earnings rose +90% on +34% sales revenues versus the year ago period.
>>> FEATURED STOCK ARTICLE : Rebounded Above its 50-Day Moving Average - 4/12/2018 |
View all notes |
Set NEW NOTE alert |
Company Profile |
SEC
News |
Chart |
Request a new note
C
A
S
I |
MA
-
NYSE
Mastercard Inc Cl A
DIVERSIFIED SERVICES - Business/Management Services
|
$186.48
|
+0.66
0.36% |
$187.89
|
5,783,908
140.56% of 50 DAV
50 DAV is 4,115,000
|
$188.25
-0.94%
|
5/2/2018
|
$184.96
|
PP = $183.83
|
|
MB = $193.02
|
Most Recent Note - 5/2/2018 12:31:00 PM
Y - Color code is changed to yellow with pivot point cited based on its 3/13/18 high plus 10 cents. Gapped up today hitting a new all-time high, rising from a riskier "late stage" base. Reported earnings +49% on +31% sales revenues for the Mar '18 quarter. Helping it better match the winning models of the fact-based investment system, sequential quarterly comparisons have shown encouraging sales revenues acceleration and earnings increases above the +25% minimum earnings guideline (C criteria). Annual earnings growth has been good.
>>> FEATURED STOCK ARTICLE : Gap Up and Volume Driven Gain for New High After Earnings - 5/2/2018 |
View all notes |
Set NEW NOTE alert |
Company Profile |
SEC
News |
Chart |
Request a new note
C
A
S
I |
V
-
NYSE
Visa Inc Cl A
DIVERSIFIED SERVICES - Business/Management Services
|
$127.18
|
+0.80
0.63% |
$127.46
|
6,773,093
84.06% of 50 DAV
50 DAV is 8,057,000
|
$128.10
-0.72%
|
4/26/2018
|
$126.68
|
PP = $126.98
|
|
MB = $133.33
|
Most Recent Note - 5/2/2018 5:16:00 PM
Y - Touched a new high today but reversed into the red. Finished strong after highlighted in yellow with pivot point cited based on its 1/29/18 high plus 10 cents in the 4/26/18 mid-day report. Reported earnings +29% on +13% sales revenues for the Mar '18 quarter, and 3 of the past 4 quarterly comparisons were above the +25% minimum earnings guideline (C criteria).
>>> FEATURED STOCK ARTICLE : Volume-Driven Gain For New High Triggered Technical Buy Signal - 4/26/2018 |
View all notes |
Set NEW NOTE alert |
Company Profile |
SEC
News |
Chart |
Request a new note
C
A
S
I |
TPL
-
NYSE
Texas Pacific Land Trust
FINANCIAL SERVICES - Diversified Investments
|
$627.66
|
+7.42
1.20% |
$639.88
|
26,883
192.02% of 50 DAV
50 DAV is 14,000
|
$623.00
0.75%
|
4/13/2018
|
$547.85
|
PP = $552.10
|
|
MB = $579.71
|
 Most Recent Note - 5/3/2018 1:29:02 PM
G - Hitting another new high today, getting very extended from the prior base. Reported strong results for the Mar '18 quarter and gapped up on 5/01/18 for a considerable volume-driven gain, rallying above the pivot point cited based on its 2/28/18 high plus 10 cents. No resistance remains due to overhead supply. On pullbacks the prior highs in the $569-552 area define initial support to watch above its 50 DMA line ($530).
>>> FEATURED STOCK ARTICLE : Perched Near Prior High After Showing Resilience - 4/20/2018 |
View all notes |
Set NEW NOTE alert |
Company Profile |
SEC
News |
Chart |
Request a new note
C
A
S
I |
Symbol/Exchange
Company Name
Industry Group |
PRICE |
CHANGE
(%Change) |
Day High |
Volume
(% DAV)
(% 50 day avg vol) |
52 Wk Hi
% From Hi |
Featured
Date |
Price
Featured |
Pivot Featured |
|
Max Buy |
DPZ
-
NYSE
Dominos Pizza Inc
WHOLESALE - Food Wholesale
|
$245.83
|
+1.55
0.63% |
$246.37
|
551,981
70.05% of 50 DAV
50 DAV is 788,000
|
$255.00
-3.60%
|
2/20/2018
|
$224.86
|
PP = $222.01
|
|
MB = $233.11
|
Most Recent Note - 4/30/2018 6:18:16 PM
G - Pulled back today for a 2nd consecutive loss following a big 4/26/18 gap up for a new all-time high. Reported earnings +59% on +26% sales revenues for the Mar '18 quarter, continuing its strong earnings track record. Its 50 DMA line and recent lows define near-term support to watch on pullbacks.
>>> FEATURED STOCK ARTICLE : Earnings News Due From Pizza Firm - 4/23/2018 |
View all notes |
Set NEW NOTE alert |
Company Profile |
SEC
News |
Chart |
Request a new note
C
A
S
I |
FIVE
-
NASDAQ
Five Below Inc
Retail-DiscountandVariety
|
$71.99
|
+1.09
1.54% |
$72.39
|
1,199,340
81.37% of 50 DAV
50 DAV is 1,474,000
|
$78.28
-8.04%
|
3/9/2018
|
$68.58
|
PP = $73.65
|
|
MB = $77.33
|
Most Recent Note - 4/30/2018 6:16:35 PM
Y - Fell below prior highs and into the prior base today raising concerns with a big loss on higher volume testing its 50 DMA line ($70.69). More damaging losses may trigger a more worrisome technical sell signal.
>>> FEATURED STOCK ARTICLE : Quietly Hovering Near All-Time High - 4/5/2018 |
View all notes |
Set NEW NOTE alert |
Company Profile |
SEC
News |
Chart |
Request a new note
C
A
S
I |
NVEE
-
NASDAQ
N V 5 Global Inc
Comml Svcs-Consulting
|
$61.25
|
+0.35
0.57% |
$61.50
|
67,814
82.70% of 50 DAV
50 DAV is 82,000
|
$64.50
-5.04%
|
4/9/2018
|
$58.35
|
PP = $59.05
|
|
MB = $62.00
|
Most Recent Note - 5/2/2018 5:11:04 PM
Y - Consolidating above its pivot point after a pullback tested prior highs in the $58 area defining initial support. Due to report earnings after the close on Thursday, May 3rd. Volume and volatility often increase near earnings news.
>>> FEATURED STOCK ARTICLE : Perched Near High After 3 Strong Quarterly Comparisons - 4/9/2018 |
View all notes |
Set NEW NOTE alert |
Company Profile |
SEC
News |
Chart |
Request a new note
C
A
S
I |
QLYS
-
NASDAQ
Qualys Inc
Computer Sftwr-Security
|
$73.95
|
-1.08
-1.43% |
$75.95
|
353,724
105.91% of 50 DAV
50 DAV is 334,000
|
$85.00
-13.00%
|
4/17/2018
|
$82.85
|
PP = $79.50
|
|
MB = $83.48
|
Most Recent Note - 5/2/2018 12:40:59 PM
G - Reported earnings +80% on +22% sales revenues for the Mar '18 quarter. Gapped down today violating its 50 DMA line ($76.45) and also undercutting the prior low ($70.85 on 3/28/18) triggering technical sell signals. Its color code was changed to green. A rebound above the 50 DMA line is needed for its outlook to improve.
>>> FEATURED STOCK ARTICLE : Quickly Rallied More Than 5% Above Prior High - 4/18/2018 |
View all notes |
Set NEW NOTE alert |
Company Profile |
SEC
News |
Chart |
Request a new note
C
A
S
I |
SPLK
-
NASDAQ
Splunk Inc
Computer Sftwr-Database
|
$105.83
|
+2.83
2.75% |
$106.68
|
1,119,389
56.97% of 50 DAV
50 DAV is 1,965,000
|
$112.66
-6.06%
|
2/15/2018
|
$96.06
|
PP = $93.68
|
|
MB = $98.36
|
Most Recent Note - 5/2/2018 10:34:07 AM
G - Found prompt support near its 50 DMA line ($102) last week, but it has not formed a sound base. Subsequent losses and a breach of the prior low ($94.39 on 4/04/18) would raise more serious concerns.
>>> FEATURED STOCK ARTICLE : Found Support Near 50-Day Average on Pullbacks - 4/19/2018 |
View all notes |
Set NEW NOTE alert |
Company Profile |
SEC
News |
Chart |
Request a new note
C
A
S
I |
Symbol/Exchange
Company Name
Industry Group |
PRICE |
CHANGE
(%Change) |
Day High |
Volume
(% DAV)
(% 50 day avg vol) |
52 Wk Hi
% From Hi |
Featured
Date |
Price
Featured |
Pivot Featured |
|
Max Buy |
SUPN
-
NASDAQ
Supernus Pharmaceuticals
Medical-Biomed/Biotech
|
$46.15
|
-0.70
-1.49% |
$47.00
|
419,044
64.87% of 50 DAV
50 DAV is 646,000
|
$50.05
-7.78%
|
4/24/2018
|
$47.73
|
PP = $50.15
|
|
MB = $52.66
|
Most Recent Note - 5/1/2018 2:26:34 PM
Y - Still quietly hovering within close striking distance of its all-time high. Subsequent gains above the pivot point backed by at least +40% above average volume are needed to trigger a technical buy signal.
>>> FEATURED STOCK ARTICLE : Pharmaceutical Firm Perched Near Record High - 4/24/2018 |
View all notes |
Set NEW NOTE alert |
Company Profile |
SEC
News |
Chart |
Request a new note
C
A
S
I |
PAYC
-
NYSE
Paycom Software Inc
COMPUTER SOFTWARE and SERVICES - Application Software
|
$105.12
|
+0.74
0.71% |
$105.70
|
1,012,052
144.17% of 50 DAV
50 DAV is 702,000
|
$118.45
-11.25%
|
2/15/2018
|
$95.01
|
PP = $93.61
|
|
MB = $98.29
|
Most Recent Note - 5/3/2018 5:19:37 PM
G - Managed a "positive reversal" after an early loss today. Gapped down on the prior session and violated its 50 DMA line ($108.53) triggering a technical sell signal. Reported earnings +56% on +29% sales revenues for the Mar '18 quarter. Recent lows in the $101 area define important support to watch where further deterioration would raise concerns. A rebound above the 50 DMA line is needed for its outlook to improve. See the latest FSU analysis for more details and a new annotated graph.
>>> FEATURED STOCK ARTICLE : Violation of 50-Day Average Triggered Technical Sell Signal - 5/3/2018 |
View all notes |
Set NEW NOTE alert |
Company Profile |
SEC
News |
Chart |
Request a new note
C
A
S
I |
GRUB
-
NYSE
Grubhub Inc
COMPUTER SOFTWARE and SERVICES - Technical and System Software
|
$96.79
|
+1.23
1.29% |
$96.81
|
995,022
60.41% of 50 DAV
50 DAV is 1,647,000
|
$112.41
-13.90%
|
6/21/2017
|
$47.33
|
PP = $46.94
|
|
MB = $49.29
|
Most Recent Note - 5/1/2018 2:22:59 PM
G - Gapped down today after meeting resistance near its 50 DMA line ($101.81). Volume and volatility often increase near earnings news. Reported earnings +79% on +49% sales revenues for the Mar '18 quarter. See the latest FSU analysis for more details and an annotated graph.
>>> FEATURED STOCK ARTICLE : Consolidating Near 50 Day Average With Earnings News Due - 4/30/2018 |
View all notes |
Set NEW NOTE alert |
Company Profile |
SEC
News |
Chart |
Request a new note
C
A
S
I |
HQY
-
NASDAQ
Healthequity Inc
COMPUTER SOFTWARE and SERVICES - Healthcare Information Service
|
$67.92
|
+0.64
0.95% |
$68.09
|
493,949
71.48% of 50 DAV
50 DAV is 691,000
|
$68.75
-1.21%
|
5/2/2018
|
$66.31
|
PP = $68.85
|
|
MB = $72.29
|
Most Recent Note - 5/2/2018 10:28:05 AM
Y - Volume totals have been below average while hovering in a tight range in recent weeks near its all-time high. Color code is changed to yellow with new pivot point cited based on its 3/22/18 high plus 10 cents. Subsequent volume-driven gains for new highs may trigger a new (or add-on) technical buy signal. Its 50 DMA line ($61.57) defines near term support above the recent low ($59.50 on 4/03/18).
>>> FEATURED STOCK ARTICLE : Perched Near All-Time High Building a Short New Base - 4/25/2018 |
View all notes |
Set NEW NOTE alert |
Company Profile |
SEC
News |
Chart |
Request a new note
C
A
S
I |
LOB
-
NASDAQ
Live Oak Bancshares Inc
Banks-Southeast
|
$28.30
|
-0.25
-0.88% |
$28.65
|
121,105
90.38% of 50 DAV
50 DAV is 134,000
|
$30.05
-5.82%
|
3/16/2018
|
$28.63
|
PP = $28.30
|
|
MB = $29.72
|
Most Recent Note - 4/30/2018 6:10:15 PM
Y - Recently reported earnings +63% on +42% for the Mar '18 quarter. Consolidating above its 50 DMA line ($27.97) and prior lows where more damaging losses would raise greater concerns.
>>> FEATURED STOCK ARTICLE : Tested Support at 50-Day Moving Average After Breakout - 4/16/2018 |
View all notes |
Set NEW NOTE alert |
Company Profile |
SEC
News |
Chart |
Request a new note
C
A
S
I |
Symbol/Exchange
Company Name
Industry Group |
PRICE |
CHANGE
(%Change) |
Day High |
Volume
(% DAV)
(% 50 day avg vol) |
52 Wk Hi
% From Hi |
Featured
Date |
Price
Featured |
Pivot Featured |
|
Max Buy |
PYPL
-
NASDAQ
"PayPal Holdings, Inc"
Finance-CrdtCard/PmtPr
|
$73.45
|
+1.72
2.40% |
$73.77
|
17,168,828
204.87% of 50 DAV
50 DAV is 8,380,500
|
$86.32
-14.91%
|
2/1/2018
|
$80.35
|
PP = $79.49
|
|
MB = $83.46
|
Most Recent Note - 5/2/2018 5:21:08 PM
G - Suffered a big loss today on more than 2 times average volume, testing its 200 DMA line ($71.84) and prior lows in the $71-72 area defining important support. More damaging losses would raise serious concerns. A rebound above the 50 DMA line ($77.88) is needed for its outlook to improve. Recently reported earnings +30% on +24% sales revenues for the Mar '18 quarter.
>>> FEATURED STOCK ARTICLE : Slumping Near Important Near-Term Support - 4/27/2018 |
View all notes |
Set NEW NOTE alert |
Company Profile |
SEC
News |
Chart |
Request a new note
C
A
S
I |
OLLI
-
NASDAQ
Ollie's Bargain Outlet
Retail-DiscountandVariety
|
$63.00
|
-0.05
-0.08% |
$63.35
|
370,784
55.42% of 50 DAV
50 DAV is 669,000
|
$64.45
-2.25%
|
4/10/2018
|
$62.05
|
PP = $62.15
|
|
MB = $65.26
|
Most Recent Note - 4/30/2018 6:11:56 PM
Y - Still quietly hovering near its all-time high with volume totals cooling. Confirming gains above the pivot point backed by at least +40% above average volume are needed to trigger a proper technical buy signal.
>>> FEATURED STOCK ARTICLE : Encountered Distribution, Finished Below Pivot Point After Early Gain - 4/11/2018 |
View all notes |
Set NEW NOTE alert |
Company Profile |
SEC
News |
Chart |
Request a new note
C
A
S
I |
NOVT
-
NASDAQ
Novanta Inc
Elec-Scientific/Msrng
|
$58.10
|
+0.15
0.26% |
$58.45
|
267,700
122.80% of 50 DAV
50 DAV is 218,000
|
$63.60
-8.65%
|
4/17/2018
|
$60.55
|
PP = $60.40
|
|
MB = $63.42
|
Most Recent Note - 5/2/2018 10:31:28 AM
Y - Undercut the prior high ($60.30 on 1/29/18) raising some concerns with recent losses. Stalled after recently rallying to new highs with an impressive streak of volume-driven gains. Prior highs in the $58 area define initial support to watch above its 50 DMA line ($55.97).
>>> FEATURED STOCK ARTICLE : Volume-Driven Gain Hit New All-Time High - 4/17/2018 |
View all notes |
Set NEW NOTE alert |
Company Profile |
SEC
News |
Chart |
Request a new note
C
A
S
I |
SEND
-
NYSE
Sendgrid Inc
INTERNET - Content
|
$25.73
|
-0.15
-0.58% |
$25.91
|
526,869
132.71% of 50 DAV
50 DAV is 397,000
|
$32.03
-19.66%
|
3/6/2018
|
$28.00
|
PP = $28.37
|
|
MB = $29.79
|
Most Recent Note - 5/2/2018 5:24:04 PM
G - Violated its 50 DMA line ($27.96) today with a damaging volume-driven loss triggering a technical sell signal. Weak action came after it reported earnings +100% on +31% sales revenues for the Mar '18 quarter continuing its strong earnings track record. Completed a new Public Offering and Secondary Offering on 4/05/18.
>>> FEATURED STOCK ARTICLE : Earnings News Continues to be Strong - 5/1/2018 |
View all notes |
Set NEW NOTE alert |
Company Profile |
SEC
News |
Chart |
Request a new note
C
A
S
I |
|
|
|
THESE ARE NOT BUY RECOMMENDATIONS!
Comments contained in the body of this report are technical
opinions only. The material herein has been obtained
from sources believed to be reliable and accurate, however,
its accuracy and completeness cannot be guaranteed.
This site is not an investment advisor, hence it does
not endorse or recommend any securities or other investments.
Any recommendation contained in this report may not
be suitable for all investors and it is not to be deemed
an offer or solicitation on our part with respect to
the purchase or sale of any securities. All trademarks,
service marks and trade names appearing in this report
are the property of their respective owners, and are
likewise used for identification purposes only.
This report is a service available
only to active Paid Premium Members.
You may opt-out of receiving report notifications
at any time. Questions or comments may be submitted
by writing to Premium Membership Services 665 S.E. 10 Street, Suite 201 Deerfield Beach, FL 33441-5634 or by calling 1-800-965-8307
or 954-785-1121.
|
|
|


