You are not logged in.
This means you
CAN ONLY VIEW reports that were published prior to Thursday, April 10, 2025.
You
MUST UPGRADE YOUR MEMBERSHIP if you want to see any current reports.
AFTER MARKET UPDATE - MONDAY, FEBRUARY 8TH, 2021
Previous After Market Report Next After Market Report >>>
|
|
|
|
DOW |
+237.52 |
31,385.76 |
+0.76% |
|
Volume |
970,516,925 |
+4% |
|
Volume |
8,324,032,400 |
+26% |
|
NASDAQ |
+127.31 |
13,983.61 |
+0.92% |
|
Advancers |
2,311 |
73% |
|
Advancers |
3,053 |
77% |
|
S&P 500 |
+28.76 |
3,915.59 |
+0.74% |
|
Decliners |
875 |
27% |
|
Decliners |
893 |
23% |
|
Russell 2000 |
+56.43 |
2,289.76 |
+2.53% |
|
52 Wk Highs |
315 |
|
|
52 Wk Highs |
706 |
|
|
S&P 600 |
+34.52 |
1,287.27 |
+2.76% |
|
52 Wk Lows |
2 |
|
|
52 Wk Lows |
9 |
|
|
 |
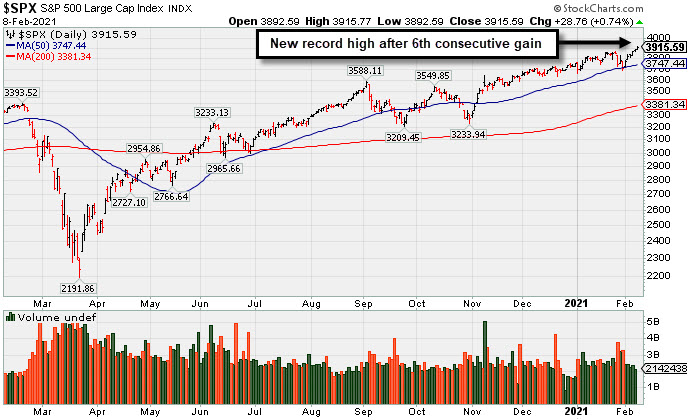
Major Indices Rallied With Greater Leadership and More Volume
Kenneth J. Gruneisen - Passed the CAN SLIM® Master's Exam
The Dow jumped 237 points, while the S&P 500 rose 0.7%. Both indexes advanced for a sixth-straight session, posting their longest stretch of gains since August. The Nasdaq Composite climbed 1%. The volume totals were higher than the prior session on the NYSE and on the Nasdaq exchange. Advancers led decliners by almost a 3-1 margin on the NYSE and by more than a 3-1 margin on the Nasdaq exchange. There were 126 high-ranked companies from the Leaders List that hit new 52-week highs and were listed on the BreakOuts Page, versus the total of 100 on the prior session. New 52-week highs totals expanded and easily outnumbered new 52-week lows totals which were in the single digits on both exchanges for a 5th consecutive session. The major indices are in a confirmed uptrend (M criteria) with healthy leadership provided by many stocks hitting new highs. Investors are reminded to always make buying and selling decisions based based on the strict criteria and rules of the fact-based investment system. PICTURED: The S&P 500 Index hit a new record high with Monday's 6th consecutive gain.
All three U.S. major averages rallied to fresh record highs on Monday amid optimistic earnings, stimulus, and economic updates. The gains extended last week's rally, in which the S&P 500 rebounded from its worst weekly performance since October to notch its best weekly jump (4.7%) since November.
Investors weighed comments from Treasury Secretary Janet Yellen. Over the weekend, the former Fed chair speculated that the U.S. could return to full employment next year if lawmakers can pass the stimulus package proposed by President Biden, pushing back on concerns that the measures would overheat the economy. Treasuries fluctuated during the session, with the yield on the benchmark 10-year note holding steady at 1.17%. The longer-dated 30-year bond slipped three basis points to 1.95%, after briefly rising above 2% earlier in the session for the first time in nearly a year.
Ten of 11 S&P 500 sectors ended in positive territory, with Utilities the lone decliner. The Energy group paced the gains as WTI crude rallied 2% to $58.00/barrel. In earnings, Hasbro (HAS -4.25%) fell despite the toymaker topping consensus profit and sales estimates. Elsewhere, Energizer Holdings (ENR +2.85%) rose after besting analyst earnings and revenue expectations and providing upbeat forward guidance. |
 Kenneth J. Gruneisen started out as a licensed stockbroker in August 1987, a couple of months prior to the historic stock market crash that took the Dow Jones Industrial Average down -22.6% in a single day. He has published daily fact-based fundamental and technical analysis on high-ranked stocks online for two decades. Through FACTBASEDINVESTING.COM, Kenneth provides educational articles, news, market commentary, and other information regarding proven investment systems that work in good times and bad.
Comments contained in the body of this report are technical opinions only and are not necessarily those of Gruneisen Growth Corp. The material herein has been obtained from sources believed to be reliable and accurate, however, its accuracy and completeness cannot be guaranteed. Our firm, employees, and customers may effect transactions, including transactions contrary to any recommendation herein, or have positions in the securities mentioned herein or options with respect thereto. Any recommendation contained in this report may not be suitable for all investors and it is not to be deemed an offer or solicitation on our part with respect to the purchase or sale of any securities. |
|
 |
Commodity-Linked Groups Led Financials and the Tech Sector Higher
Kenneth J. Gruneisen - Passed the CAN SLIM® Master's Exam
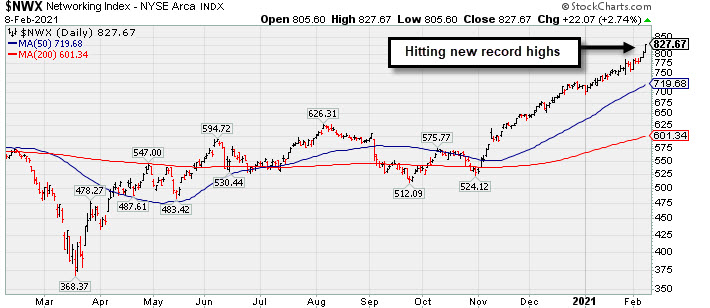
The Broker/Dealer Index ($XBD +1.91%) and Bank Index ($BKX +1.69%) both posted solid gains while the Retail Index ($RLX +0.15%) was a laggard that ended the session with only a tiny gain. The Semiconductor Index ($SOX +3.13%) and Networking Index ($NWX +2.74%) led the tech sector higher while the Biotech Index ($BTK +1.31%) posted a smaller gain. Commodity-linked groups were standout gainers as the Oil Services Index ($OSX +3.06%) and Integrated Oil Index ($XOI +4.38%) both outpaced the Gold & Silver Index ($XAU +2.15%).
PICTURED: The Networking Index ($NWX +2.74%) hit a new record high.
| Oil Services |
$OSX |
52.58 |
+1.56 |
+3.06% |
+18.60% |
| Integrated Oil |
$XOI |
909.00 |
+38.17 |
+4.38% |
+14.70% |
| Semiconductor |
$SOX |
3,078.48 |
+93.47 |
+3.13% |
+10.12% |
| Networking |
$NWX |
827.67 |
+22.07 |
+2.74% |
+15.42% |
| Broker/Dealer |
$XBD |
418.64 |
+7.86 |
+1.91% |
+10.87% |
| Retail |
$RLX |
3,701.77 |
+5.47 |
+0.15% |
+3.89% |
| Gold & Silver |
$XAU |
144.57 |
+3.05 |
+2.15% |
+0.26% |
| Bank |
$BKX |
108.08 |
+1.80 |
+1.69% |
+10.39% |
| Biotech |
$BTK |
6,319.77 |
+81.84 |
+1.31% |
+10.12% |
|
|
|
 |
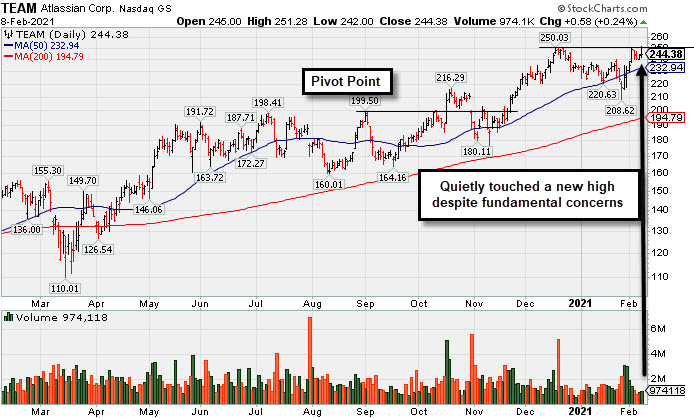
Quietly Touched a New High Despite Fundamental Concerns Noted
Kenneth J. Gruneisen - Passed the CAN SLIM® Master's Exam
Atlassian Corp (TEAM +$0.58 or +0.24% to $244.38) recently rebounded from below its 50-day moving average (DMA) line ($232.94) and today it quietly touched a new 52-week high. The recent low ($208.62 on 1/27/21) defines important near-term support to watch. Its current Relative Strength Rating is 72 remains below the +80 minimum guideline for buy candidates.
TEAM has an 85 Earnings Per Share rating. Earnings rose +0% on +23% sales revenues for the Dec '20 quarter versus the year ago period, its 2nd comparison below the +25% minimum earnings guideline (C criteria), raising fundamental concerns. TEAM was highlighted in yellow with new pivot point cited based on its 9/01/20 high plus 10 cents in the 10/12/20 mid-day report (read here). An annotated graph was last shown in the 1/21/21 report under the headline, "Relative Strength Rating Remains Below 80+ Minimum Guideline".
This Australia - based software developer's annual earnings (A criteria) history has been strong since its $21 IPO on 12/10/15. The number of top-rated funds owning its shares rose from 266 in Sep '17 to 866 in Dec '20, a reassuring sign concerning the I criteria. It has a Timeliness Rating of B and Sponsorship Rating of A. Its current Up/Down Volume Ratio of 1.4 is an unbiased indication its shares have been under accumulation over the past 50 days. |
|
|
Color Codes Explained :
Y - Better candidates highlighted by our
staff of experts.
G - Previously featured
in past reports as yellow but may no longer be buyable under the
guidelines.
***Last / Change / Volume data in this table is the closing quote data***
Symbol/Exchange
Company Name
Industry Group |
PRICE |
CHANGE
(%Change) |
Day High |
Volume
(% DAV)
(% 50 day avg vol) |
52 Wk Hi
% From Hi |
Featured
Date |
Price
Featured |
Pivot Featured |
|
Max Buy |
 CRL
-
NYSE
CRL
-
NYSE
Charles River Labs Intl
DRUGS - Biotechnology
|
$276.65
|
+0.89
0.32% |
$278.78
|
214,491
75.45% of 50 DAV
50 DAV is 284,300
|
$284.60
-2.79%
|
12/17/2020
|
$247.06
|
PP = $257.98
|
|
MB = $270.88
|
 Most Recent Note - 2/8/2021 2:43:52 PM
G - Rebounded above its "max buy" level near its prior high and its color code is changed to green. Recently tested and found prompt support at the prior high ($257) and its 50 DMA line ($255). Reported Sep '20 quarterly earnings +38% on +11% sales revenues versus the year ago period, above the +25% minimum earnings guideline (C criteria).
>>> FEATURED STOCK ARTICLE : Testing Important Support on Pullback - 1/29/2021 |
View all notes |
Set NEW NOTE alert |
Company Profile |
SEC
News |
Chart |
Request a new note
C
A
S
I |
AMD
-
NYSE
Advanced Micro Devices
ELECTRONICS - Semiconductor - Broad Line
|
$91.47
|
+3.57
4.06% |
$91.99
|
47,172,521
107.10% of 50 DAV
50 DAV is 44,043,300
|
$99.23
-7.82%
|
11/18/2020
|
$82.54
|
PP = $88.72
|
|
MB = $93.16
|
Most Recent Note - 2/8/2021 2:59:10 PM
G - Rebounding near its 50 DMA line ($91.81) which may act as resistance. A rebound above the 50 DMA line is needed for its outlook to improve. Its current Relative Strength rating of 61 is still below the 80+ minimum guideline for buy candidates. Fundamentals remain strong after it reported Dec '20 quarterly earnings +63% on +53% sales revenues versus the year ago period.
>>> FEATURED STOCK ARTICLE : Distributional Pressure Brings Pullback Below "Max Buy" Level - 1/13/2021 |
View all notes |
Set NEW NOTE alert |
Company Profile |
SEC
News |
Chart |
Request a new note
C
A
S
I |
AMRC
-
NYSE
Ameresco Inc Cl A
ENERGY - Alternative
|
$67.97
|
+2.70
4.14% |
$69.62
|
391,404
85.83% of 50 DAV
50 DAV is 456,000
|
$65.46
3.83%
|
12/15/2020
|
$46.72
|
PP = $47.10
|
|
MB = $49.46
|
Most Recent Note - 2/5/2021 5:21:47 PM
G - Hit a new all-time high with today's big gain. It did not form a sound base of sufficient length. Its 50-day moving average (DMA) line ($52.48) defines near-term support to watch above prior highs in the $46-47 area.
>>> FEATURED STOCK ARTICLE : Rebounding After Retreat From Record High - 2/1/2021 |
View all notes |
Set NEW NOTE alert |
Company Profile |
SEC
News |
Chart |
Request a new note
C
A
S
I |
TREX
-
NYSE
Trex Company Inc
MATERIALS and CONSTRUCTION - General Building Materials
|
$103.44
|
+3.45
3.45% |
$104.46
|
807,639
117.05% of 50 DAV
50 DAV is 690,000
|
$104.35
-0.87%
|
6/26/2020
|
$54.53
|
PP = $66.47
|
|
MB = $69.79
|
Most Recent Note - 2/8/2021 2:45:50 PM
G - Touched a new all-time high with today's 3rd consecutive gain backed by below average volume. Its 50 DMA line ($86.55) and prior highs in the $80-81 area define important support to watch on pullbacks. Sep '20 quarterly earnings were +14% on +19% sales revenues versus the year ago period, below the +25% minimum guideline (C criteria) raising fundamental concerns.
>>> FEATURED STOCK ARTICLE : Hit New All-Time High With Gain Backed by Average Volume - 1/19/2021 |
View all notes |
Set NEW NOTE alert |
Company Profile |
SEC
News |
Chart |
Request a new note
C
A
S
I |
CLFD
-
NASDAQ
Clearfield Inc
TELECOMMUNICATIONS - Cables / Satalite Equipment
|
$34.57
|
+1.49
4.50% |
$36.23
|
355,612
273.55% of 50 DAV
50 DAV is 130,000
|
$37.54
-7.91%
|
1/20/2021
|
$31.38
|
PP = $28.42
|
|
MB = $29.84
|
Most Recent Note - 2/8/2021 12:13:41 PM
G - Challenging its prior high with today's 4th consecutive gain, extended from any sound base. Prior highs in the $28 area define initial support to watch above its 50 DMA line ($27.50). Reported Dec '20 quarterly earnings +475% on +40% sales revenues versus the year ago period, continuing its strong earning track record.
>>> FEATURED STOCK ARTICLE : Perched Near Record High With Earnings Report Due Soon - 1/27/2021 |
View all notes |
Set NEW NOTE alert |
Company Profile |
SEC
News |
Chart |
Request a new note
C
A
S
I |
Symbol/Exchange
Company Name
Industry Group |
PRICE |
CHANGE
(%Change) |
Day High |
Volume
(% DAV)
(% 50 day avg vol) |
52 Wk Hi
% From Hi |
Featured
Date |
Price
Featured |
Pivot Featured |
|
Max Buy |
NOW
-
NYSE
Servicenow Inc
Computer Sftwr-Enterprse
|
$587.91
|
-1.82
-0.31% |
$598.37
|
1,019,599
74.38% of 50 DAV
50 DAV is 1,370,800
|
$592.54
-0.78%
|
8/20/2020
|
$453.34
|
PP = $454.79
|
|
MB = $477.53
|
Most Recent Note - 2/5/2021 5:03:09 PM
G - Hit new all-time highs with recent gains backed by light volume. A new pivot point was not cited due to fundamental concerns noted as its impressive rally has continued. Gapped up on 1/28/21 promptly rebounding above its 50 DMA line ($538.84). Fundamental concerns remain after it reported Dec '20 quarterly earnings +22% on +31% sales revenues versus the year ago period, its 2nd consecutive comparison below the +25% minimum guideline (C criteria) of the fact-based investment system. See the latest FSU analysis for more details and a new annotated graph.
>>> FEATURED STOCK ARTICLE : Hit New Highs With Latest Gains Backed by Light Volume - 2/5/2021 |
View all notes |
Set NEW NOTE alert |
Company Profile |
SEC
News |
Chart |
Request a new note
C
A
S
I |
SMPL
-
NASDAQ
Simply Good Foods Co
Food-Confectionery
|
$29.46
|
+0.84
2.94% |
$29.49
|
352,584
28.56% of 50 DAV
50 DAV is 1,234,400
|
$32.03
-8.02%
|
12/28/2020
|
$30.40
|
PP = $31.44
|
|
MB = $33.01
|
Most Recent Note - 2/8/2021 3:07:20 PM
G - Posting a gain today with lighter than average volume. Its Relative Strength Rating is 64, still below the 80+ minimum guideline. Its 50 DMA line ($27.23) and prior low ($26.78) define near term support to watch.
>>> FEATURED STOCK ARTICLE : Relative Strength Rating Suffered During Stalling Action - 1/21/2021 |
View all notes |
Set NEW NOTE alert |
Company Profile |
SEC
News |
Chart |
Request a new note
C
A
S
I |
ALRM
-
NASDAQ
Alarm.com Holdings Inc
Security/Sfty
|
$101.35
|
-0.77
-0.75% |
$104.25
|
362,263
78.58% of 50 DAV
50 DAV is 461,000
|
$108.67
-6.74%
|
11/6/2020
|
$71.88
|
PP = $74.76
|
|
MB = $78.50
|
Most Recent Note - 2/5/2021 12:04:48 PM
G - Rebounding toward its prior high with today's big gain backed by above average volume. It has not formed a sound base of sufficient length yet found support well above its 50 DMA line ($92.25).
>>> FEATURED STOCK ARTICLE : Encountered Distributional Pressure After Big Rally - 1/20/2021 |
View all notes |
Set NEW NOTE alert |
Company Profile |
SEC
News |
Chart |
Request a new note
C
A
S
I |
TEAM
-
NASDAQ
Atlassian Corp Plc
Comp Sftwr-Spec Enterprs
|
$244.38
|
+0.58
0.24% |
$251.28
|
974,117
67.02% of 50 DAV
50 DAV is 1,453,500
|
$250.03
-2.26%
|
10/12/2020
|
$193.77
|
PP = $199.60
|
|
MB = $209.58
|
Most Recent Note - 2/8/2021 5:17:07 PM
G - Quietly touched a new high today. Rebounded impressively from a brief dip below its 50 DMA line ($232.94). Recent low ($208.62 on 1/27/21) defines important near-term support to watch. Its current Relative Strength Rating is 72, below the +80 minimum guideline for buy candidates. Fundamental concerns remain after earnings rose +0% on +23% sales revenues for the Dec '20 quarter versus the year ago period, its 2nd comparison below the +25% minimum earnings guideline (C criteria). See the latest FSU analysis for more details and a new annotated graph.
>>> FEATURED STOCK ARTICLE : Quietly Touched a New High Despite Fundamental Concerns Noted - 2/8/2021 |
View all notes |
Set NEW NOTE alert |
Company Profile |
SEC
News |
Chart |
Request a new note
C
A
S
I |
SHOP
-
NYSE
Shopify Inc Cl A
Computer Sftwr-Enterprse
|
$1,345.09
|
+57.34
4.45% |
$1,348.26
|
1,232,956
96.63% of 50 DAV
50 DAV is 1,276,000
|
$1,296.78
3.73%
|
2/2/2021
|
$1,218.72
|
PP = $1,285.28
|
|
MB = $1,349.54
|
Most Recent Note - 2/8/2021 3:06:08 PM
Y - Hitting a new all-time high with lighter volume behind today's 3rd consecutive gain. A solid gain and close above the pivot point backed by at least +40% above average volume may help clinch a convincing new (or add-on) technical buy signal. Found prompt support near its 50 DMA line ($1,148). Prior low ($1,076 on 1/06/21) defines the next important support to watch.
>>> FEATURED STOCK ARTICLE : Perched Within Striking Distance of New Pivot Point - 2/3/2021 |
View all notes |
Set NEW NOTE alert |
Company Profile |
SEC
News |
Chart |
Request a new note
C
A
S
I |
Symbol/Exchange
Company Name
Industry Group |
PRICE |
CHANGE
(%Change) |
Day High |
Volume
(% DAV)
(% 50 day avg vol) |
52 Wk Hi
% From Hi |
Featured
Date |
Price
Featured |
Pivot Featured |
|
Max Buy |
YETI
-
NYSE
Yeti Holdings Inc
Leisure-Products
|
$75.62
|
+2.70
3.70% |
$76.48
|
799,687
60.95% of 50 DAV
50 DAV is 1,312,000
|
$80.89
-6.52%
|
11/5/2020
|
$57.25
|
PP = $55.14
|
|
MB = $57.90
|
Most Recent Note - 2/8/2021 3:09:19 PM
G - Rebounding further above the 50 DMA line ($69.93) with today's 4th consecutive gain backed by below average volume. It has not formed a sound base of sufficient length. Prior low ($64.80) on 2/01/21) defines important near term support below its 50 DMA line.
>>> FEATURED STOCK ARTICLE : 50-Day Moving Average and Prior Lows Define Near-Term Support - 1/22/2021 |
View all notes |
Set NEW NOTE alert |
Company Profile |
SEC
News |
Chart |
Request a new note
C
A
S
I |
BJ
-
NYSE
BJs Wholesale Club Hldgs
Retail-DiscountandVariety
|
$43.39
|
+1.50
3.58% |
$43.52
|
1,605,486
65.73% of 50 DAV
50 DAV is 2,442,400
|
$50.18
-13.53%
|
1/28/2021
|
$44.74
|
PP = $47.56
|
|
MB = $49.94
|
Most Recent Note - 2/5/2021 5:14:44 PM
Y - Suffered a 3rd consecutive loss today with below average volume. Abruptly retreated after a volume-driven breakout on 1/27/21 capped a 7 session winning streak.
>>> FEATURED STOCK ARTICLE : Pulled Back After Breakout Capped 7-Day Winning Streak - 1/28/2021 |
View all notes |
Set NEW NOTE alert |
Company Profile |
SEC
News |
Chart |
Request a new note
C
A
S
I |
DOCU
-
NASDAQ
Docusign Inc
Computer Sftwr-Enterprse
|
$248.90
|
-1.47
-0.59% |
$256.20
|
2,033,729
56.92% of 50 DAV
50 DAV is 3,573,000
|
$290.23
-14.24%
|
1/12/2021
|
$253.50
|
PP = $256.10
|
|
MB = $268.91
|
Most Recent Note - 2/4/2021 5:36:20 PM
Y - Rebounded above the 50 DMA line ($236) this week helping its outlook improve. Faces some resistance due to overhead supply. The prior low ($216.50 on 1/04/21) defines the next important support to watch. Fundamentals remain strong.
>>> FEATURED STOCK ARTICLE : Twice Average Volume Behind Breakout Gain - 1/12/2021 |
View all notes |
Set NEW NOTE alert |
Company Profile |
SEC
News |
Chart |
Request a new note
C
A
S
I |
DT
-
NYSE
Dynatrace Inc
Computer Sftwr-Enterprse
|
$56.11
|
+0.65
1.17% |
$56.62
|
2,608,824
106.05% of 50 DAV
50 DAV is 2,460,000
|
$55.70
0.74%
|
2/4/2021
|
$51.39
|
PP = $48.95
|
|
MB = $51.40
|
Most Recent Note - 2/5/2021 5:20:37 PM
G - Color code is changed to green after today's 5ht consecutive volume-driven gain for a new all-time high. Fundamentals remain strong after it reported Dec '20 earnings +70% on +28% sales revenues versus the year ago period. Found support near its 200 DMA line during the consolidation after dropped from the Featured Stocks list on 9/08/20. See the latest FSU analysis for more details and an annotated graph.
>>> FEATURED STOCK ARTICLE : Breakout Action Returns Dynatrace to Featured Stocks List - 2/4/2021 |
View all notes |
Set NEW NOTE alert |
Company Profile |
SEC
News |
Chart |
Request a new note
C
A
S
I |
QTWO
-
NYSE
Q2 Holdings Inc
Computer Sftwr-Financial
|
$143.55
|
+0.98
0.69% |
$143.75
|
437,132
89.94% of 50 DAV
50 DAV is 486,000
|
$142.76
0.55%
|
11/12/2020
|
$105.14
|
PP = $106.54
|
|
MB = $111.87
|
Most Recent Note - 2/8/2021 3:03:02 PM
G - Inching to another new high with today's gain, getting more extended from any sound base. Its 50 DMA line ($126.22) defines important near term support to watch on pullbacks.
>>> FEATURED STOCK ARTICLE : Perched Near All-Time High Stubbornly Holding Ground - 1/26/2021 |
View all notes |
Set NEW NOTE alert |
Company Profile |
SEC
News |
Chart |
Request a new note
C
A
S
I |
Symbol/Exchange
Company Name
Industry Group |
PRICE |
CHANGE
(%Change) |
Day High |
Volume
(% DAV)
(% 50 day avg vol) |
52 Wk Hi
% From Hi |
Featured
Date |
Price
Featured |
Pivot Featured |
|
Max Buy |
AXON
-
NASDAQ
Axon Enterprise Inc
Security/Sfty
|
$182.39
|
+5.21
2.94% |
$182.48
|
386,472
64.09% of 50 DAV
50 DAV is 603,000
|
$180.69
0.94%
|
12/22/2020
|
$127.84
|
PP = $130.51
|
|
MB = $137.04
|
Most Recent Note - 2/4/2021 5:32:22 PM
G - Posted a 5th consecutive gain today with light volume. Very extended from any sound base. Its 50 DMA line ($137.68) and prior high ($134) define important support to watch on pullbacks. Fundamentals remain strong. See the latest FSU analysis for more details and an annotated graph. Formerly traded under the ticker symbol AAXN where prior notes and detailed analysis may be reviewed.
>>> FEATURED STOCK ARTICLE : Extended From Prior Base Following Streak fo Volume-Driven Gains - 2/2/2021 |
View all notes |
Set NEW NOTE alert |
Company Profile |
SEC
News |
Chart |
Request a new note
C
A
S
I |
|
|
|
THESE ARE NOT BUY RECOMMENDATIONS!
Comments contained in the body of this report are technical
opinions only. The material herein has been obtained
from sources believed to be reliable and accurate, however,
its accuracy and completeness cannot be guaranteed.
This site is not an investment advisor, hence it does
not endorse or recommend any securities or other investments.
Any recommendation contained in this report may not
be suitable for all investors and it is not to be deemed
an offer or solicitation on our part with respect to
the purchase or sale of any securities. All trademarks,
service marks and trade names appearing in this report
are the property of their respective owners, and are
likewise used for identification purposes only.
This report is a service available
only to active Paid Premium Members.
You may opt-out of receiving report notifications
at any time. Questions or comments may be submitted
by writing to Premium Membership Services 665 S.E. 10 Street, Suite 201 Deerfield Beach, FL 33441-5634 or by calling 1-800-965-8307
or 954-785-1121.
|
|
|