You are not logged in.
This means you
CAN ONLY VIEW reports that were published prior to Thursday, March 20, 2025.
You
MUST UPGRADE YOUR MEMBERSHIP if you want to see any current reports.
AFTER MARKET UPDATE - WEDNESDAY, FEBRUARY 3RD, 2021
Previous After Market Report Next After Market Report >>>
|
|
|
|
DOW |
+36.12 |
30,723.60 |
+0.12% |
|
Volume |
1,012,237,742 |
-10% |
|
Volume |
7,419,241,700 |
+3% |
|
NASDAQ |
-2.35 |
13,610.42 |
-0.02% |
|
Advancers |
1,841 |
58% |
|
Advancers |
2,381 |
62% |
|
S&P 500 |
+3.86 |
3,830.17 |
+0.10% |
|
Decliners |
1,336 |
42% |
|
Decliners |
1,434 |
38% |
|
Russell 2000 |
+8.26 |
2,159.70 |
+0.38% |
|
52 Wk Highs |
138 |
|
|
52 Wk Highs |
262 |
|
|
S&P 600 |
+5.51 |
1,217.59 |
+0.45% |
|
52 Wk Lows |
0 |
|
|
52 Wk Lows |
4 |
|
|
 |
Major Indices Were Little Changed While Energy Shares Bounced
Kenneth J. Gruneisen - Passed the CAN SLIM® Master's Exam
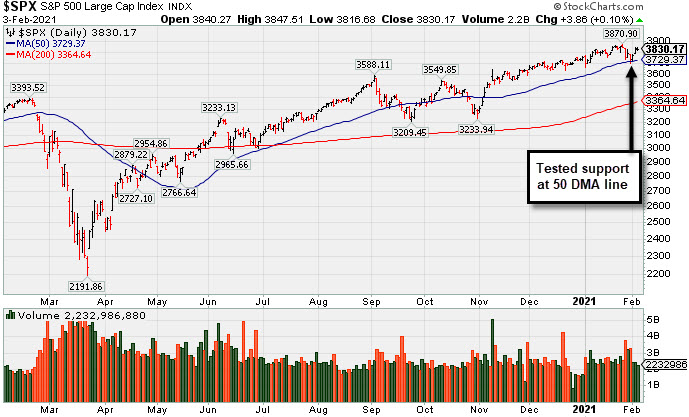
The Dow reversed small early session losses to rise 36 points, while the S&P 500 gained 0.1%. The Nasdaq Composite closed just below the flat line. Still, all three major averages are on track for their best weekly performance since November. The volume totals were mixed, lighter than the prior session on the NYSE and higher on the Nasdaq exchange. Advancers led decliners by almost a 3-2 margin on the NYSE and 12-7 on the Nasdaq exchange. There were 42 high-ranked companies from the Leaders List that hit new 52-week highs and were listed on the BreakOuts Page, versus the total of 49 on the prior session. New 52-week highs totals expanded and easily outnumbered the new 52-week lows totals which were in the single digits on both exchanges. The major indices clearly saw their uptrend come under pressure (M criteria) last week while leadership thinned. Investors are reminded to always make buying and selling decisions based based on the strict criteria and rules of the fact-based investment system. PICTURED: The S&P 500 Index recently tested support at its 50-day moving average (DMA) line. More damaging volume-driven losses would raise concerns.
Stocks ended mostly higher, as investors assessed earnings results and monitored fiscal stimulus updates. Last night, the Senate voted 50-49 to proceed with a budget resolution, which paves the way to use reconciliation to pass President Biden's $1.9 trillion coronavirus relief package.
On the data front, a report from the ADP revealed private payrolls rose by 174,000 in January, well above expectations for a 50,000 gain and an upwardly revised 78,000 decline in December. The Institute for Supply Management's services PMI climbed to 58.7 last month from December's 57.7 figure, while a similar gauge from research firm Markit unexpectedly improved to 58.3 from the initial 57.5 reading for January. Treasuries declined, with the yield on the 10-year note up three basis points to 1.13%.
Six of 11 S&P 500 sectors ended in positive territory. Energy paced the gains as WTI crude jumped 2.7% after government data showed U.S. stockpiles fell to their lowest levels since March. The Communication Services group also outperformed, with Alphabet (GOOGL +7.28%) rallying as the Google parent reported record revenue for a second consecutive quarter. Meanwhile, Amazon (AMZN -2.00%) fell despite easily topping analysts' earnings and revenue expectations during the holiday quarter. The e-commerce giant also announced that Amazon founder Jeff Bezos will hand over the reins of CEO to current Amazon Web Services leader Andy Jassy. |
 Kenneth J. Gruneisen started out as a licensed stockbroker in August 1987, a couple of months prior to the historic stock market crash that took the Dow Jones Industrial Average down -22.6% in a single day. He has published daily fact-based fundamental and technical analysis on high-ranked stocks online for two decades. Through FACTBASEDINVESTING.COM, Kenneth provides educational articles, news, market commentary, and other information regarding proven investment systems that work in good times and bad.
Comments contained in the body of this report are technical opinions only and are not necessarily those of Gruneisen Growth Corp. The material herein has been obtained from sources believed to be reliable and accurate, however, its accuracy and completeness cannot be guaranteed. Our firm, employees, and customers may effect transactions, including transactions contrary to any recommendation herein, or have positions in the securities mentioned herein or options with respect thereto. Any recommendation contained in this report may not be suitable for all investors and it is not to be deemed an offer or solicitation on our part with respect to the purchase or sale of any securities. |
|
 |
Energy and Financial Groups Rose
Kenneth J. Gruneisen - Passed the CAN SLIM® Master's Exam
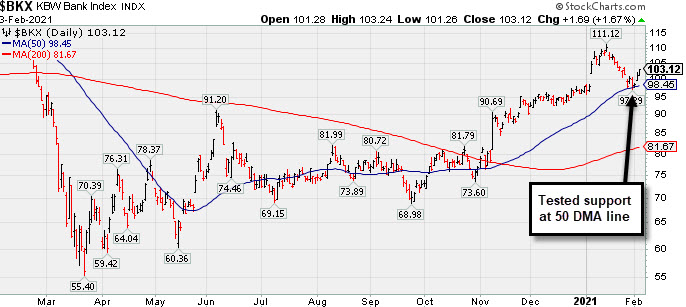
The Bank Index ($BKX +1.67%) outpaced the Broker/Dealer Index ($XBD +0.38%) as financials had a positive bias, but the Retail Index ($RLX -0.90%) created a drag on the major indices. The Semiconductor Index ($SOX -2.11%) and Biotech Index ($BTK -0.82%) dragged the tech sector lower while the Networking Index ($NWX -0.02%) finished flat. The Oil Services Index ($OSX +4.85%) and Integrated Oil Index ($XOI +4.31%) posted standout gains while the Gold & Silver Index ($XAU +0.42%) edged higher.
PICTURED: The Bank Index ($BKX +1.67%) found support well above its 50-day moving average (DMA) line after last week's pullback.
| Oil Services |
$OSX |
49.85 |
+2.31 |
+4.85% |
+12.46% |
| Integrated Oil |
$XOI |
861.38 |
+35.59 |
+4.31% |
+8.69% |
| Semiconductor |
$SOX |
2,982.96 |
-64.37 |
-2.11% |
+6.71% |
| Networking |
$NWX |
781.65 |
-0.14 |
-0.02% |
+9.00% |
| Broker/Dealer |
$XBD |
399.94 |
+1.51 |
+0.38% |
+5.92% |
| Retail |
$RLX |
3,630.98 |
-32.84 |
-0.90% |
+1.90% |
| Gold & Silver |
$XAU |
139.64 |
+0.59 |
+0.42% |
-3.16% |
| Bank |
$BKX |
103.12 |
+1.69 |
+1.67% |
+5.32% |
| Biotech |
$BTK |
6,090.83 |
-50.47 |
-0.82% |
+6.13% |
|
|
|
 |
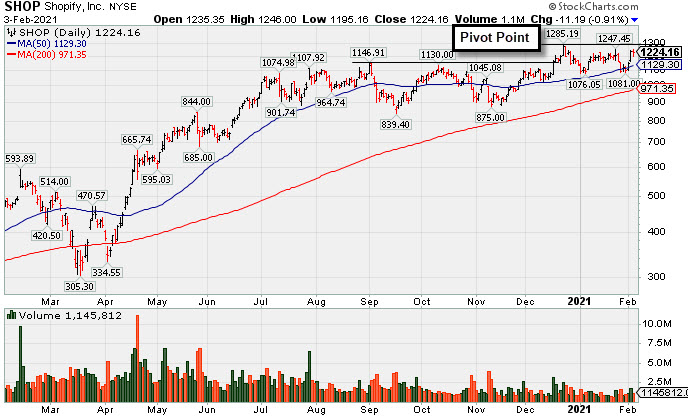
Perched Within Striking Distance of New Pivot Point
Kenneth J. Gruneisen - Passed the CAN SLIM® Master's Exam
Shopify Inc Cl A (SHOP -$11.19 or -0.91% to $1,224.16) quietly held its ground today following a volume-driven gain on the prior session. A new pivot point was cited based on its 12/22/20 high plus 10 cents. It faces little resistance due to overhead supply up to the $1,285 level. Subsequent gains and a close above the pivot point backed by at least +40% above average volume may trigger a new (or add-on) technical buy signal. It found prompt support near its 50-day moving average (DMA) line ($1,129) during the recent consolidation. The prior low ($1,076 on 1/06/21) defines the next important support to watch.
SHOP was highlighted in yellow with pivot point cited based on its 9/01/20 high plus 10 cents in the 12/15/20 mid-day report (read here). It was last shown in the FSU section on 1/07/21 with an annotated graph under the headline, "Rebounded After Undercutting Prior Highs".
It reported Sep '20 quarterly earnings of $1.13 per share versus a loss of 29 cents per share on +96% sales revenues versus the year ago period. The Ontario, Canada-based Computer Software - Enterprise firm's prior quarters showed big earnings increases well above the +25% minimum guideline (C criteria) with very strong underlying sales revenues growth. After years of losses it had strong earnings growth in FY '17-19 (A criteria).
The number of top-rated funds owning its shares rose from 1,151 in Sep '19 to 1,651 in Dec '20, a reassuring sign concerning the I criteria. It has a C Timeliness rating and an A Sponsorship Rating. There are 121.9 million shares outstanding (S criteria) which can contribute to greater price volatility in the event of institutional buying or selling. |
|
|
Color Codes Explained :
Y - Better candidates highlighted by our
staff of experts.
G - Previously featured
in past reports as yellow but may no longer be buyable under the
guidelines.
***Last / Change / Volume data in this table is the closing quote data***
Symbol/Exchange
Company Name
Industry Group |
PRICE |
CHANGE
(%Change) |
Day High |
Volume
(% DAV)
(% 50 day avg vol) |
52 Wk Hi
% From Hi |
Featured
Date |
Price
Featured |
Pivot Featured |
|
Max Buy |
 CRL
-
NYSE
CRL
-
NYSE
Charles River Labs Intl
DRUGS - Biotechnology
|
$267.85
|
-4.55
-1.67% |
$272.41
|
195,619
69.12% of 50 DAV
50 DAV is 283,000
|
$284.60
-5.89%
|
12/17/2020
|
$247.06
|
PP = $257.98
|
|
MB = $270.88
|
Most Recent Note - 2/1/2021 12:39:35 PM
Y - Losses last week tested important support at the prior high ($257) and its 50 DMA line ($251). Reported Sep '20 quarterly earnings +38% on +11% sales revenues versus the year ago period, above the +25% minimum earnings guideline (C criteria).
>>> FEATURED STOCK ARTICLE : Testing Important Support on Pullback - 1/29/2021 |
View all notes |
Set NEW NOTE alert |
Company Profile |
SEC
News |
Chart |
Request a new note
C
A
S
I |
AMD
-
NYSE
Advanced Micro Devices
ELECTRONICS - Semiconductor - Broad Line
|
$87.89
|
-0.97
-1.09% |
$89.48
|
32,034,805
71.49% of 50 DAV
50 DAV is 44,808,500
|
$99.23
-11.43%
|
11/18/2020
|
$82.54
|
PP = $88.72
|
|
MB = $93.16
|
Most Recent Note - 2/2/2021 5:34:58 PM
G - Posted a small gain today on very light volume. Fundamentals remain strong after it reported Dec '20 quarterly earnings +63% on +53% sales revenues versus the year ago period. Damaging volume-driven losses recently violated the 50 DMA line ($91.52) hurting its outlook. A rebound above the 50 DMA line is needed for its outlook to improve. Its current Relative Strength rating of 70 is still below the 80+ minimum guideline for buy candidates.
>>> FEATURED STOCK ARTICLE : Distributional Pressure Brings Pullback Below "Max Buy" Level - 1/13/2021 |
View all notes |
Set NEW NOTE alert |
Company Profile |
SEC
News |
Chart |
Request a new note
C
A
S
I |
AMRC
-
NYSE
Ameresco Inc Cl A
ENERGY - Alternative
|
$63.10
|
-0.15
-0.24% |
$64.60
|
374,285
82.99% of 50 DAV
50 DAV is 451,000
|
$64.60
-2.32%
|
12/15/2020
|
$46.72
|
PP = $47.10
|
|
MB = $49.46
|
Most Recent Note - 2/2/2021 12:38:43 PM
G - Hitting a new all-time high with today's big gain. It did not form a sound base of sufficient length. Its 50-day moving average (DMA) line ($51.29) defines near-term support to watch above prior highs in the $46-47 area. See the latest FSU analysis for more details and an annotated graph.
>>> FEATURED STOCK ARTICLE : Rebounding After Retreat From Record High - 2/1/2021 |
View all notes |
Set NEW NOTE alert |
Company Profile |
SEC
News |
Chart |
Request a new note
C
A
S
I |
TREX
-
NYSE
Trex Company Inc
MATERIALS and CONSTRUCTION - General Building Materials
|
$95.72
|
-1.24
-1.28% |
$97.75
|
592,195
85.83% of 50 DAV
50 DAV is 690,000
|
$104.35
-8.27%
|
6/26/2020
|
$54.53
|
PP = $66.47
|
|
MB = $69.79
|
Most Recent Note - 2/1/2021 4:48:34 PM
G - Rebounded toward its all-time high with today's big gain on average volume after a streak of 4 straight volume-driven losses. Its 50 DMA line ($84.15) and prior highs in the $80-81 area define important support to watch on pullbacks. Sep '20 quarterly earnings were +14% on +19% sales revenues versus the year ago period, below the +25% minimum guideline (C criteria) raising fundamental concerns.
>>> FEATURED STOCK ARTICLE : Hit New All-Time High With Gain Backed by Average Volume - 1/19/2021 |
View all notes |
Set NEW NOTE alert |
Company Profile |
SEC
News |
Chart |
Request a new note
C
A
S
I |
CLFD
-
NASDAQ
Clearfield Inc
TELECOMMUNICATIONS - Cables / Satalite Equipment
|
$32.17
|
+0.36
1.13% |
$32.44
|
158,042
125.43% of 50 DAV
50 DAV is 126,000
|
$37.54
-14.30%
|
1/20/2021
|
$31.38
|
PP = $28.42
|
|
MB = $29.84
|
Most Recent Note - 2/1/2021 12:37:42 PM
G - Extended from any sound base after a streak of volume-driven gains. Prior highs in the $28 area define initial support to watch above its 50 DMA line ($26.52). Reported Dec '20 quarterly earnings +475% on +40% sales revenues versus the year ago period, continuing its strong earning track record.
>>> FEATURED STOCK ARTICLE : Perched Near Record High With Earnings Report Due Soon - 1/27/2021 |
View all notes |
Set NEW NOTE alert |
Company Profile |
SEC
News |
Chart |
Request a new note
C
A
S
I |
Symbol/Exchange
Company Name
Industry Group |
PRICE |
CHANGE
(%Change) |
Day High |
Volume
(% DAV)
(% 50 day avg vol) |
52 Wk Hi
% From Hi |
Featured
Date |
Price
Featured |
Pivot Featured |
|
Max Buy |
NOW
-
NYSE
Servicenow Inc
Computer Sftwr-Enterprse
|
$576.65
|
-6.86
-1.18% |
$587.43
|
1,473,405
107.89% of 50 DAV
50 DAV is 1,365,700
|
$588.82
-2.07%
|
8/20/2020
|
$453.34
|
PP = $454.79
|
|
MB = $477.53
|
Most Recent Note - 2/2/2021 12:08:06 PM
G - Hitting new 52-week and all-time highs with today's big volume-driven gain clearing a new 6-week flat base. A new pivot point is not being cited due to fundamental concerns noted as its impressive rally has continued. Gapped up on 1/28/21 promptly rebounding above its 50 DMA line ($535) and challenging its prior high. Fundamental concerns remain after it reported Dec '20 quarterly earnings +22% on +31% sales revenues versus the year ago period, its 2nd consecutive comparison below the +25% minimum guideline (C criteria) of the fact-based investment system.
>>> FEATURED STOCK ARTICLE : Gain Today and Rebound Above 50-Day Moving Average Line - 1/8/2021 |
View all notes |
Set NEW NOTE alert |
Company Profile |
SEC
News |
Chart |
Request a new note
C
A
S
I |
SMPL
-
NASDAQ
Simply Good Foods Co
Food-Confectionery
|
$28.88
|
-0.98
-3.28% |
$29.72
|
587,822
47.38% of 50 DAV
50 DAV is 1,240,700
|
$32.03
-9.83%
|
12/28/2020
|
$30.40
|
PP = $31.44
|
|
MB = $33.01
|
 Most Recent Note - 2/3/2021 5:22:02 PM
G - Pulled back today with lighter than average volume. Its Relative Strength Rating is 70, still below the 80+ minimum guideline. Its 50 DMA line ($26.89) and prior low ($26.78) define near term support in the area to watch.
>>> FEATURED STOCK ARTICLE : Relative Strength Rating Suffered During Stalling Action - 1/21/2021 |
View all notes |
Set NEW NOTE alert |
Company Profile |
SEC
News |
Chart |
Request a new note
C
A
S
I |
ALRM
-
NASDAQ
Alarm.com Holdings Inc
Security/Sfty
|
$96.50
|
+0.00
0.00% |
$97.31
|
243,056
53.07% of 50 DAV
50 DAV is 458,000
|
$108.67
-11.20%
|
11/6/2020
|
$71.88
|
PP = $74.76
|
|
MB = $78.50
|
Most Recent Note - 1/29/2021 5:10:29 PM
G - It was down again today with lighter than average volume, slumping near the 50 DMA line ($89.52) which defines important near-term support to watch.
>>> FEATURED STOCK ARTICLE : Encountered Distributional Pressure After Big Rally - 1/20/2021 |
View all notes |
Set NEW NOTE alert |
Company Profile |
SEC
News |
Chart |
Request a new note
C
A
S
I |
TEAM
-
NASDAQ
Atlassian Corp Plc
Comp Sftwr-Spec Enterprs
|
$243.99
|
-4.80
-1.93% |
$248.25
|
1,113,481
71.24% of 50 DAV
50 DAV is 1,563,000
|
$250.03
-2.42%
|
10/12/2020
|
$193.77
|
PP = $199.60
|
|
MB = $209.58
|
Most Recent Note - 1/29/2021 12:50:46 PM
G - Sputtering below its 50 DMA line ($228) which acted as resistance after a violation raised concerns. Recent low ($208.62 on 1/27/21) defines important near-term support to watch. Its current Relative Strength Rating is 62, below the +80 minimum guideline for buy candidates. Earnings rose +7% on +26% sales revenues for the Sep '20 quarter versus the year ago period, below the +25% minimum earnings guideline (C criteria), raising fundamental concerns.
>>> FEATURED STOCK ARTICLE : Relative Strength Rating Remains Below 80+ Minimum Guideline - 1/11/2021 |
View all notes |
Set NEW NOTE alert |
Company Profile |
SEC
News |
Chart |
Request a new note
C
A
S
I |
SHOP
-
NYSE
Shopify Inc Cl A
Computer Sftwr-Enterprse
|
$1,224.16
|
-11.19
-0.91% |
$1,246.00
|
1,145,798
88.21% of 50 DAV
50 DAV is 1,299,000
|
$1,285.19
-4.75%
|
2/2/2021
|
$1,218.72
|
PP = $1,285.28
|
|
MB = $1,349.54
|
Most Recent Note - 2/3/2021 5:20:15 PM
Y - Held its ground today following big volume-driven gain on the prior session. A new pivot point was cited based on its 12/22/20 high plus 10 cents. Faces little resistance due to overhead supply up to the $1,285 level. Subsequent gains and a close above the pivot point backed by at least +40% above average volume may trigger a new (or add-on) technical buy signal. Found prompt support near its 50 DMA line ($1,129). Prior low ($1,076 on 1/06/21) defines the next important support to watch. See the latest FSU analysis for more details and a new annotated graph.
>>> FEATURED STOCK ARTICLE : Perched Within Striking Distance of New Pivot Point - 2/3/2021 |
View all notes |
Set NEW NOTE alert |
Company Profile |
SEC
News |
Chart |
Request a new note
C
A
S
I |
Symbol/Exchange
Company Name
Industry Group |
PRICE |
CHANGE
(%Change) |
Day High |
Volume
(% DAV)
(% 50 day avg vol) |
52 Wk Hi
% From Hi |
Featured
Date |
Price
Featured |
Pivot Featured |
|
Max Buy |
YETI
-
NYSE
Yeti Holdings Inc
Leisure-Products
|
$67.65
|
+0.69
1.03% |
$68.01
|
1,014,909
76.31% of 50 DAV
50 DAV is 1,330,000
|
$80.89
-16.37%
|
11/5/2020
|
$57.25
|
PP = $55.14
|
|
MB = $57.90
|
Most Recent Note - 2/2/2021 5:37:54 PM
G - Recently sputtering below its 50 DMA line ($69.08) raising concerns and triggering a technical sell signal. Only a rebound above the 50 DMA line would help its outlook improve.
>>> FEATURED STOCK ARTICLE : 50-Day Moving Average and Prior Lows Define Near-Term Support - 1/22/2021 |
View all notes |
Set NEW NOTE alert |
Company Profile |
SEC
News |
Chart |
Request a new note
C
A
S
I |
BJ
-
NYSE
BJs Wholesale Club Hldgs
Retail-DiscountandVariety
|
$42.68
|
-0.09
-0.21% |
$43.15
|
1,433,893
53.71% of 50 DAV
50 DAV is 2,669,800
|
$50.18
-14.95%
|
1/28/2021
|
$44.74
|
PP = $47.56
|
|
MB = $49.94
|
Most Recent Note - 1/29/2021 5:09:05 PM
Y - Suffered a 2nd consecutive loss today with above average volume. Finished weak on the prior session after highlighted in yellow with pivot point cited based on its 8/26/21 high. Abruptly retreated after a volume-driven breakout on the prior session capped a 7 session winning streak. See the latest FSU analysis for more details and an annotated graph.
>>> FEATURED STOCK ARTICLE : Pulled Back After Breakout Capped 7-Day Winning Streak - 1/28/2021 |
View all notes |
Set NEW NOTE alert |
Company Profile |
SEC
News |
Chart |
Request a new note
C
A
S
I |
DOCU
-
NASDAQ
Docusign Inc
Computer Sftwr-Enterprse
|
$236.83
|
-3.01
-1.26% |
$243.55
|
1,862,912
52.15% of 50 DAV
50 DAV is 3,572,000
|
$290.23
-18.40%
|
1/12/2021
|
$253.50
|
PP = $256.10
|
|
MB = $268.91
|
Most Recent Note - 2/2/2021 12:46:06 PM
Y - Color code is changed to yellow as the gain today and rebound above the 50 DMA line ($235) helps its outlook improve. Faces some resistance due to overhead supply. The prior low ($216.50 on 1/04/21) defines the next important support to watch. Fundamentals remain strong.
>>> FEATURED STOCK ARTICLE : Twice Average Volume Behind Breakout Gain - 1/12/2021 |
View all notes |
Set NEW NOTE alert |
Company Profile |
SEC
News |
Chart |
Request a new note
C
A
S
I |
QTWO
-
NYSE
Q2 Holdings Inc
Computer Sftwr-Financial
|
$134.79
|
-2.23
-1.63% |
$137.81
|
293,641
60.30% of 50 DAV
50 DAV is 487,000
|
$142.76
-5.58%
|
11/12/2020
|
$105.14
|
PP = $106.54
|
|
MB = $111.87
|
Most Recent Note - 2/2/2021 12:47:44 PM
G - Rebounding near the prior high with today's big gain, but it is extended from any sound base. Its 50 DMA line ($124) defines important near term support to watch on pullbacks.
>>> FEATURED STOCK ARTICLE : Perched Near All-Time High Stubbornly Holding Ground - 1/26/2021 |
View all notes |
Set NEW NOTE alert |
Company Profile |
SEC
News |
Chart |
Request a new note
C
A
S
I |
AXON
-
NASDAQ
Axon Enterprise Inc
Security/Sfty
|
$167.55
|
+1.02
0.61% |
$169.06
|
293,451
47.95% of 50 DAV
50 DAV is 612,000
|
$180.69
-7.27%
|
12/22/2020
|
$127.84
|
PP = $130.51
|
|
MB = $137.04
|
Most Recent Note - 2/2/2021 5:32:53 PM
G - Posted a 3rd consecutive small gain today with light volume, it is very extended from any sound base. Its 50 DMA line ($135.78) and prior high ($134) define important support to watch on pullbacks. Fundamentals remain strong. See the latest FSU analysis for more details and a new annotated graph. Formerly traded under the ticker symbol AAXN where prior notes and detailed analysis may be reviewed.
>>> FEATURED STOCK ARTICLE : Extended From Prior Base Following Streak fo Volume-Driven Gains - 2/2/2021 |
View all notes |
Set NEW NOTE alert |
Company Profile |
SEC
News |
Chart |
Request a new note
C
A
S
I |
Symbol/Exchange
Company Name
Industry Group |
PRICE |
CHANGE
(%Change) |
Day High |
Volume
(% DAV)
(% 50 day avg vol) |
52 Wk Hi
% From Hi |
Featured
Date |
Price
Featured |
Pivot Featured |
|
Max Buy |
|
|
|
THESE ARE NOT BUY RECOMMENDATIONS!
Comments contained in the body of this report are technical
opinions only. The material herein has been obtained
from sources believed to be reliable and accurate, however,
its accuracy and completeness cannot be guaranteed.
This site is not an investment advisor, hence it does
not endorse or recommend any securities or other investments.
Any recommendation contained in this report may not
be suitable for all investors and it is not to be deemed
an offer or solicitation on our part with respect to
the purchase or sale of any securities. All trademarks,
service marks and trade names appearing in this report
are the property of their respective owners, and are
likewise used for identification purposes only.
This report is a service available
only to active Paid Premium Members.
You may opt-out of receiving report notifications
at any time. Questions or comments may be submitted
by writing to Premium Membership Services 665 S.E. 10 Street, Suite 201 Deerfield Beach, FL 33441-5634 or by calling 1-800-965-8307
or 954-785-1121.
|
|
|