You are not logged in.
This means you
CAN ONLY VIEW reports that were published prior to Thursday, April 10, 2025.
You
MUST UPGRADE YOUR MEMBERSHIP if you want to see any current reports.
AFTER MARKET UPDATE - MONDAY, JANUARY 3RD, 2022
Previous After Market Report Next After Market Report >>>
|
|
|
|
DOW |
+246.76 |
36,585.06 |
+0.68% |
|
Volume |
844,999,964 |
+20% |
|
Volume |
4,373,671,500 |
+31% |
|
NASDAQ |
+187.83 |
15,832.80 |
+1.20% |
|
Advancers |
1,927 |
57% |
|
Advancers |
3,316 |
70% |
|
S&P 500 |
+30.38 |
4,796.56 |
+0.64% |
|
Decliners |
1,434 |
43% |
|
Decliners |
1,434 |
30% |
|
Russell 2000 |
+27.24 |
2,272.56 |
+1.21% |
|
52 Wk Highs |
96 |
|
|
52 Wk Highs |
98 |
|
|
S&P 600 |
+15.15 |
1,416.86 |
+1.08% |
|
52 Wk Lows |
29 |
|
|
52 Wk Lows |
86 |
|
|
 |
Leadership Improved as Major Indices Rose With Higher Volume
Kenneth J. Gruneisen - Passed the CAN SLIM® Master's Exam
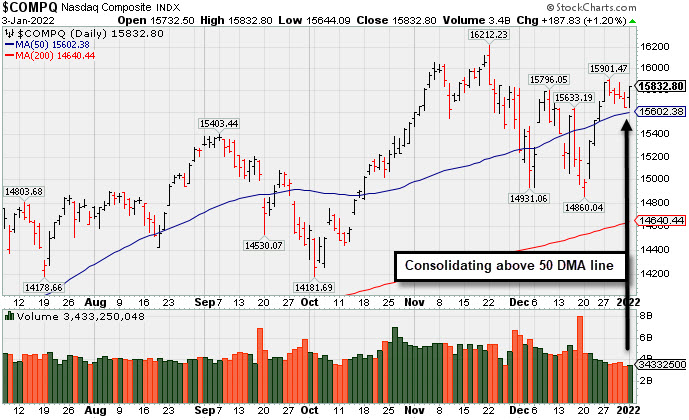
The S&P 500 rose 0.6% to close at a fresh record. The broad benchmark just came off a 26.9% annual rally to extend its strongest three-year run since 1999 (+72%). The Dow added 246 points to notch its own all-time peak, while the tech-heavy Nasdaq Composite climbed 1.2%. The volume totals reported were higher than the prior session on the NYSE and on the Nasdaq exchange. Advancers led decliners by a 5-4 margin on the NYSE and by more than 2-1 on the Nasdaq exchange. There were 50 high-ranked companies from the Leaders List that hit new 52-week highs and were listed on the BreakOuts Page, versus the total of 35 on the prior session. New 52-week highs outnumbered new 52-week lows on the NYSE and on the Nasdaq exchange. The market averages (M criteria) are in a confirmed uptrend. New buying efforts are to be carefully made under the fact-based investment system's strict criteria.
 PICTURED: The Nasdaq Composite Index is consolidating above the 50-day moving average (DMA) line.
U.S. stocks finished firmly higher on Monday, kicking off 2022 on a positive note. Six of 11 S&P 500 sectors closed in negative territory, with defensive groups leading decliners and the more cyclical-oriented pockets mixed. Energy shares extended last year’s outperformance, as WTI crude added 1.1% to $76.00/barrel following its biggest annual advance since 2009. Consumer Discretionary stocks were also among the standouts. Tesla Inc. (TSLA +13.53%) rose after posting record vehicle deliveries during the fourth quarter that dwarfed consensus estimates. Meanwhile, Amazon.com Inc. (AMZN +2.21%) rose as positive analyst commentary helped the e-commerce giant start the year on the front foot. The Information Technology group also advanced, with Apple Inc. (AAPL +2.50%) briefly eclipsing $3 trillion in market capitalization during intraday trading.
Treasuries experienced their worst start to a year since 2009, with the yield on the 10-year note spiking 13 basis points (0.13%) to 1.64% after climbing 59 basis points (0.59%) in 2021. A gauge of the U.S. dollar surged 0.6%, pressuring COMEX gold, which fell 1.4% to $1,803.00/ounce on the heels of its largest annual decline since 2015.
On the data front, a final December reading on U.S. manufacturing activity from research firm IHS Markit was revised modestly lower, though remained firmly in expansionary territory. Separately, a release revealed construction spending rose a smaller-than-anticipated 0.4% in November. |
 Kenneth J. Gruneisen started out as a licensed stockbroker in August 1987, a couple of months prior to the historic stock market crash that took the Dow Jones Industrial Average down -22.6% in a single day. He has published daily fact-based fundamental and technical analysis on high-ranked stocks online for two decades. Through FACTBASEDINVESTING.COM, Kenneth provides educational articles, news, market commentary, and other information regarding proven investment systems that work in good times and bad.
Comments contained in the body of this report are technical opinions only and are not necessarily those of Gruneisen Growth Corp. The material herein has been obtained from sources believed to be reliable and accurate, however, its accuracy and completeness cannot be guaranteed. Our firm, employees, and customers may effect transactions, including transactions contrary to any recommendation herein, or have positions in the securities mentioned herein or options with respect thereto. Any recommendation contained in this report may not be suitable for all investors and it is not to be deemed an offer or solicitation on our part with respect to the purchase or sale of any securities. |
|
 |
Energy Groups Outpaced Financial, Retail, and Tech Gains
Kenneth J. Gruneisen - Passed the CAN SLIM® Master's Exam
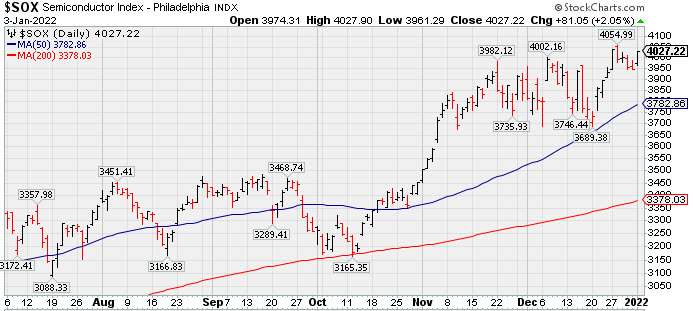
The Bank Index ($BKX +2.62%) outpaced the Broker/Dealer Index ($XBD +0.76%) and the Retail Index ($RLX +0.65%). The Semiconductor Index ($SOX +2.05%) led the tech sector higher while the Biotech Index ($BTK +0.73%) and the Networking Index ($NWX +0.22%) both posted smaller gains. Energy-linked groups were standout gainers as the Oil Services Index ($OSX +6.72%) outpaced the Integrated Oil Index ($XOI +2.95%), meanwhile, the Gold & Silver Index ($XAU -2.07%) fell.
PICTURED: The Semiconductor Index ($SOX +2.05%) found support above its 50-day moving average (DMA) line and is perched near its all-time high.
| Oil Services |
$OSX |
56.27 |
+3.54 |
+6.72% |
+6.73% |
| Integrated Oil |
$XOI |
1,212.90 |
+34.70 |
+2.95% |
+53.05% |
| Semiconductor |
$SOX |
4,027.22 |
+81.05 |
+2.05% |
+2.05% |
| Networking |
$NWX |
973.25 |
+2.17 |
+0.22% |
+0.22% |
| Broker/Dealer |
$XBD |
490.56 |
+3.70 |
+0.76% |
+29.91% |
| Retail |
$RLX |
4,254.14 |
+27.68 |
+0.65% |
+19.39% |
| Gold & Silver |
$XAU |
129.71 |
-2.75 |
-2.07% |
-2.07% |
| Bank |
$BKX |
135.69 |
+3.47 |
+2.62% |
+38.59% |
| Biotech |
$BTK |
5,558.51 |
+40.06 |
+0.73% |
+0.73% |
|
|
|
 |
Still Below 50-Day Moving Average
Kenneth J. Gruneisen - Passed the CAN SLIM® Master's Exam
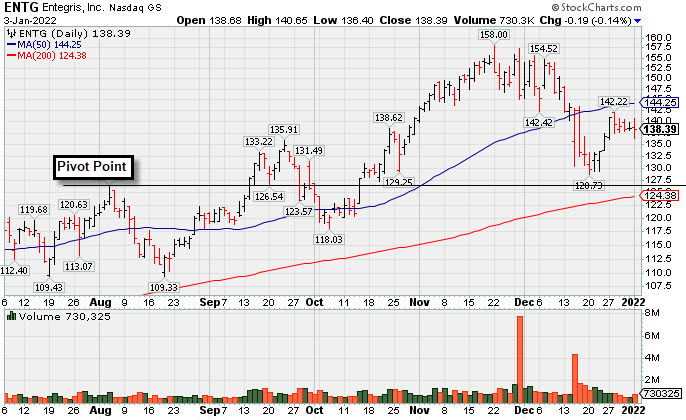
Entegris Inc (ENTG -$0.19 or -0.14% to $138.39) suffered a small loss today with below average volume. A rebound above the 50-day moving average (DMA) line ($144.25) is needed for its outlook to improve.
Fundamentals remain strong after it recently reported Sep '21 quarterly earnings +37% on +20% sales revenues versus the year ago period, its 6th strong quarter backed with an improving sales revenues growth rate, helping it match the +25% minimum guideline (C criteria). Annual earnings (A criteria) growth has been strong and steady.
ENTG was highlighted in yellow with pivot point cited based on its 4/05/21 high plus 10 cents in the 8/04/21 mid-day report (read here). It has a 94 Earnings Per Share Rating and its Relative Strength Rating is 87, both above the 80+ minimum guideline for buy candidates. It was last shown in this FSU section on 11/29/21 with an annotated graph under the headline, "Best Ever Close After Volume-Driven Gain".
The company hails from the ELECTRONICS - Semiconductor Equipment and Materials industry group which is currently ranked 21st on the 197 Industry Groups list (L criteria). There are 135.5 million shares outstanding (S criteria). The number of top-rated funds owning its shares rose from 617 in Mar '20 to 735 in Sep '21, a reassuring sign concerning the I criteria. It has a Timeliness Rating of B and Sponsorship Rating of B. |
|
|
Color Codes Explained :
Y - Better candidates highlighted by our
staff of experts.
G - Previously featured
in past reports as yellow but may no longer be buyable under the
guidelines.
***Last / Change / Volume data in this table is the closing quote data***
Symbol/Exchange
Company Name
Industry Group |
PRICE |
CHANGE
(%Change) |
Day High |
Volume
(% DAV)
(% 50 day avg vol) |
52 Wk Hi
% From Hi |
Featured
Date |
Price
Featured |
Pivot Featured |
|
Max Buy |
 BLDR
-
NYSE
BLDR
-
NYSE
Builders Firstsource Inc
Bldg-Constr Prds/Misc
|
$83.49
|
-2.22
-2.59% |
$86.48
|
2,905,135
112.47% of 50 DAV
50 DAV is 2,583,000
|
$86.20
-3.14%
|
8/12/2021
|
$52.38
|
PP = $54.09
|
|
MB = $56.79
|
 Most Recent Note - 1/3/2022 5:23:16 PM
G - Pulled back from its all-time high with today's loss. It is very extended from any sound base. Reported Sep '21 quarterly earnings +308% on +140% sales revenues versus the year ago period. Its 50 DMA line ($71.69) defines near-term support to watch.
>>> FEATURED STOCK ARTICLE : Perched at Record High After +52% Rally in 4 Months - 12/10/2021 |
View all notes |
Set NEW NOTE alert |
Company Profile |
SEC
News |
Chart |
Request a new note
C
A
S
I |
KFRC
-
NASDAQ
Kforce Inc
Comml Svcs-Staffing
|
$75.95
|
+0.73
0.97% |
$76.35
|
132,781
117.51% of 50 DAV
50 DAV is 113,000
|
$81.47
-6.78%
|
9/10/2021
|
$59.53
|
PP = $64.48
|
|
MB = $67.70
|
Most Recent Note - 12/29/2021 4:50:27 PM
G - Consolidating above its 50 DMA line ($73.27) and prior low ($71.05 on 12/14/21) which define important near-term support levels to watch. Recently reported Sep '21 quarterly earnings +8% on +10% sales revenues versus the year ago period, below the +25% minimum earnings guideline (C criteria), raising fundamental concerns. See the latest FSU analysis for more details and a new annotated graph.
>>> FEATURED STOCK ARTICLE : Consolidating Above its 50-Day Moving Average Line - 12/29/2021 |
View all notes |
Set NEW NOTE alert |
Company Profile |
SEC
News |
Chart |
Request a new note
C
A
S
I |
REGN
-
NASDAQ
Regeneron Pharmaceutical
DRUGS - Biotechnology
|
$627.10
|
-4.42
-0.70% |
$629.33
|
515,372
68.99% of 50 DAV
50 DAV is 747,000
|
$686.62
-8.67%
|
12/13/2021
|
$647.95
|
PP = $686.72
|
|
MB = $721.06
|
Most Recent Note - 12/31/2021 5:00:37 PM
Y - Pulled back today with light volume consolidating near its 50 DMA line ($632). More damaging losses would raise concerns. Color code was recently changed to yellow with new pivot point cited based on its 9/01/21 high plus 10 cents. Subsequent gains above the pivot point backed by at least +40% above average volume may trigger a technical buy signal.
>>> FEATURED STOCK ARTICLE : Consolidating Near All-Time High With Little Resistance Remaining - 12/13/2021 |
View all notes |
Set NEW NOTE alert |
Company Profile |
SEC
News |
Chart |
Request a new note
C
A
S
I |
LLY
-
NYSE
Eli Lilly & Co
Medical-Diversified
|
$271.73
|
-4.49
-1.63% |
$274.41
|
2,607,405
83.30% of 50 DAV
50 DAV is 3,130,000
|
$283.91
-4.29%
|
12/16/2021
|
$279.28
|
PP = $275.97
|
|
MB = $289.77
|
Most Recent Note - 12/29/2021 3:58:53 PM
Y - Showed resilience after a pullback and volume totals have been cooling while it remains perched near its all-time high. Recent low ($260) defines initial support to watch above its 50 DMA line ($257.49)
>>> FEATURED STOCK ARTICLE : Eli Lilly & Co Powered to New Highs With Volume - 12/16/2021 |
View all notes |
Set NEW NOTE alert |
Company Profile |
SEC
News |
Chart |
Request a new note
C
A
S
I |
CAMT
-
NASDAQ
Camtek Ltd
ELECTRONICS - Scientific and Technical Instrum
|
$48.32
|
+2.28
4.95% |
$48.49
|
223,937
84.82% of 50 DAV
50 DAV is 264,000
|
$49.60
-2.58%
|
11/9/2021
|
$45.43
|
PP = $46.11
|
|
MB = $48.42
|
Most Recent Note - 1/3/2022 5:30:15 PM
G - Posted a gain today with higher (near average) volume. Faces very little resistance due to overhead supply up to the $49 level. Fundamentals remain strong. Its 50 DMA line ($43.76) defines support above the prior low.
>>> FEATURED STOCK ARTICLE : Closed Above 50-Day Average After Big Gain With Light Volume - 12/15/2021 |
View all notes |
Set NEW NOTE alert |
Company Profile |
SEC
News |
Chart |
Request a new note
C
A
S
I |
Symbol/Exchange
Company Name
Industry Group |
PRICE |
CHANGE
(%Change) |
Day High |
Volume
(% DAV)
(% 50 day avg vol) |
52 Wk Hi
% From Hi |
Featured
Date |
Price
Featured |
Pivot Featured |
|
Max Buy |
AMD
-
NASDAQ
Advanced Micro Devices
ELECTRONICS - Semiconductor - Broad Line
|
$150.24
|
+6.34
4.41% |
$151.65
|
59,295,483
101.19% of 50 DAV
50 DAV is 58,598,000
|
$164.46
-8.65%
|
10/27/2021
|
$124.91
|
PP = $122.59
|
|
MB = $128.72
|
Most Recent Note - 1/3/2022 12:19:33 PM
G - Consolidating above its 50 DMA line ($142.43) which recently acted as support. Any violation may trigger a technical sell signal. Fundamentals remain strong after it reported Sep '21 quarterly earnings +78% on +54% sales revenues versus the year ago period.
>>> FEATURED STOCK ARTICLE : AMD Pulling Back After Considerable Rally - 12/1/2021 |
View all notes |
Set NEW NOTE alert |
Company Profile |
SEC
News |
Chart |
Request a new note
C
A
S
I |
UMC
-
NYSE
United Microelectrnc Adr
ELECTRONICS - Semiconductor - Integrated Cir
|
$11.64
|
-0.06
-0.51% |
$11.65
|
6,323,800
83.20% of 50 DAV
50 DAV is 7,601,000
|
$12.68
-8.20%
|
12/1/2021
|
$12.60
|
PP = $12.72
|
|
MB = $13.36
|
Most Recent Note - 12/28/2021 6:18:43 PM
Y - Still perched within striking distance of its all-time high after recently retesting support near its 50 DMA line ($11.20). More damaging losses would raise concerns. A gain and solid close above the pivot point may help clinch a proper new (or add-on) technical buy signal. Reported Sep '21 quarterly earnings +100% on +30% sales revenues versus the year ago period.
>>> FEATURED STOCK ARTICLE : Rebound Above 50-Day Moving Average Showed Resilience - 11/30/2021 |
View all notes |
Set NEW NOTE alert |
Company Profile |
SEC
News |
Chart |
Request a new note
C
A
S
I |
ENTG
-
NASDAQ
Entegris Inc
ELECTRONICS - Semiconductor Equipment and Mate
|
$138.39
|
-0.19
-0.14% |
$140.65
|
735,125
62.51% of 50 DAV
50 DAV is 1,176,000
|
$158.00
-12.41%
|
8/4/2021
|
$125.33
|
PP = $126.51
|
|
MB = $132.84
|
Most Recent Note - 1/3/2022 5:26:18 PM
G - Still sputtering and a rebound above the 50 DMA line ($144.25) is needed for its outlook to improve. Fundamentals remain strong after it recently reported Sep '21 quarterly earnings +37% on +20% sales revenues versus the year ago period. See the latest FSU analysis for more details and a new annotated graph.
>>> FEATURED STOCK ARTICLE : Still Below 50-Day Moving Average - 1/3/2022 |
View all notes |
Set NEW NOTE alert |
Company Profile |
SEC
News |
Chart |
Request a new note
C
A
S
I |
DHR
-
NYSE
Danaher Corp
Medical-Diversified
|
$315.76
|
-13.25
-4.03% |
$328.57
|
3,588,723
140.18% of 50 DAV
50 DAV is 2,560,000
|
$333.96
-5.45%
|
12/16/2021
|
$321.36
|
PP = $334.06
|
|
MB = $350.76
|
Most Recent Note - 1/3/2022 5:28:12 PM
Y - Volume was higher as it pulled back today testing its 50 DMA line ($313.29) after it was perched within striking distance of its 52-week high. Highlighted in yellow with pivot point cited base on its 9/10/21 high plus 10 cents in the 12/16/21 mid-day report. Subsequent gains above the pivot point with at least +40% above average volume may trigger a technical buy signal. Fundamentals remain strong.
>>> FEATURED STOCK ARTICLE : Consolidating Near Prior Highs Above 50-Day Moving Average - 12/17/2021 |
View all notes |
Set NEW NOTE alert |
Company Profile |
SEC
News |
Chart |
Request a new note
C
A
S
I |
SKY
-
NYSE
Skyline Champion Corp
Bldg-Mobile/Mfg andamp; RV
|
$77.94
|
-1.04
-1.32% |
$79.83
|
580,018
117.41% of 50 DAV
50 DAV is 494,000
|
$85.92
-9.29%
|
11/3/2021
|
$72.19
|
PP = $66.92
|
|
MB = $70.27
|
Most Recent Note - 12/30/2021 5:06:47 PM
G - It has not formed a sound new base but promptly rebounded above the 50 DMA line ($74.92). Fundamentals remain strong.
>>> FEATURED STOCK ARTICLE : Pulling Back From All-Time High After Recent Rally - 12/14/2021 |
View all notes |
Set NEW NOTE alert |
Company Profile |
SEC
News |
Chart |
Request a new note
C
A
S
I |
Symbol/Exchange
Company Name
Industry Group |
PRICE |
CHANGE
(%Change) |
Day High |
Volume
(% DAV)
(% 50 day avg vol) |
52 Wk Hi
% From Hi |
Featured
Date |
Price
Featured |
Pivot Featured |
|
Max Buy |
DHI
-
NYSE
D R Horton Inc
MATERIALS and CONSTRUCTION - Residential Construction
|
$105.26
|
-3.19
-2.94% |
$108.64
|
2,457,651
88.09% of 50 DAV
50 DAV is 2,790,000
|
$110.45
-4.70%
|
12/6/2021
|
$104.40
|
PP = $106.99
|
|
MB = $112.34
|
Most Recent Note - 1/3/2022 5:24:46 PM
Y - Volume was higher (near average) behind today's loss while perched near its all-time high. Showed stalling action since highlighted in yellow with pivot point cited based on its 5/10/21 high plus 10 cents in the 12/06/21 mid-day report. Reported Sep '21 earnings +68% on +27% sales revenues versus the year-ago period, its 8th strong quarterly comparison above the +25% minimum guideline (C criteria). Annual earnings growth (A criteria) has been strong.
>>> FEATURED STOCK ARTICLE : Builder Built a Solid Base And Challenged Prior High - 12/6/2021 |
View all notes |
Set NEW NOTE alert |
Company Profile |
SEC
News |
Chart |
Request a new note
C
A
S
I |
TITN
-
NASDAQ
Titan Machinery Inc
SPECIALTY RETAIL
|
$33.96
|
+0.27
0.80% |
$34.99
|
157,344
88.89% of 50 DAV
50 DAV is 177,000
|
$38.58
-11.98%
|
11/23/2021
|
$36.22
|
PP = $35.34
|
|
MB = $37.11
|
Most Recent Note - 12/31/2021 5:03:59 PM
G - Consolidating after finding prompt support near its 50 DMA line ($32.18) but it has not formed a sound base and faces resistance due to overhead supply up to the $38 level. Reported Oct '21 quarterly earnings +81% on +26% sales revenues over the year ago period, its 4th strong quarterly comparison. See the latest FSU analysis for more details and a new annotated graph.
>>> FEATURED STOCK ARTICLE : Recently Found Support at 50-Day Moving Average Line - 12/31/2021 |
View all notes |
Set NEW NOTE alert |
Company Profile |
SEC
News |
Chart |
Request a new note
C
A
S
I |
CLFD
-
NASDAQ
Clearfield Inc
TELECOMMUNICATIONS - Cables / Satalite Equipment
|
$80.35
|
-4.07
-4.82% |
$86.22
|
319,607
210.27% of 50 DAV
50 DAV is 152,000
|
$86.71
-7.33%
|
12/16/2021
|
$72.76
|
PP = $72.10
|
|
MB = $75.71
|
Most Recent Note - 1/3/2022 12:26:47 PM
G - Pulling back from its all-time high following volume-driven gains. Very extended from the prior base, the prior high ($72) defines initial support to watch above its 50 DMA line ($66.69). Reported Sep '21 quarterly earnings +141% on +66% sales revenues above the year ago period.
>>> FEATURED STOCK ARTICLE : Negative Reversal After Hitting a New All Time High - 12/30/2021 |
View all notes |
Set NEW NOTE alert |
Company Profile |
SEC
News |
Chart |
Request a new note
C
A
S
I |
ODFL
-
NASDAQ
Old Dominion Fght Line
TRANSPORTATION - Trucking
|
$346.37
|
-12.01
-3.35% |
$360.00
|
788,269
130.72% of 50 DAV
50 DAV is 603,000
|
$373.58
-7.28%
|
12/7/2021
|
$365.61
|
PP = $364.17
|
|
MB = $382.38
|
Most Recent Note - 12/29/2021 4:01:37 PM
Y - Posted a 6th consecutive small gain today with light volume after finding prompt support near its 50 DMA line ($347.53). Faces very little near term resistance up to the $373 level..
>>> FEATURED STOCK ARTICLE : Perched at All Time High After Tight Consolidation Several Weeks - 12/7/2021 |
View all notes |
Set NEW NOTE alert |
Company Profile |
SEC
News |
Chart |
Request a new note
C
A
S
I |
POOL
-
NASDAQ
Pool Corp
WHOLESALE - Basic Materials Wholesale
|
$550.25
|
-15.75
-2.78% |
$566.00
|
270,166
109.82% of 50 DAV
50 DAV is 246,000
|
$582.27
-5.50%
|
12/27/2021
|
$555.44
|
PP = $582.37
|
|
MB = $611.49
|
Most Recent Note - 1/3/2022 5:32:06 PM
Y - Suffered a loss today testing its 50 DMA line ($546.49). Color code was changed to yellow with new pivot point cited based on its 11/19/21 high plus 10 cents. Subsequent gains above the pivot point backed by at least +40% above average volume may trigger a new technical buy signal. Reported strong Sep '21 quarterly results.
>>> FEATURED STOCK ARTICLE : Forming New Base After Finding Prompt Support at 50 DMA - 12/27/2021 |
View all notes |
Set NEW NOTE alert |
Company Profile |
SEC
News |
Chart |
Request a new note
C
A
S
I |
Symbol/Exchange
Company Name
Industry Group |
PRICE |
CHANGE
(%Change) |
Day High |
Volume
(% DAV)
(% 50 day avg vol) |
52 Wk Hi
% From Hi |
Featured
Date |
Price
Featured |
Pivot Featured |
|
Max Buy |
SMPL
-
NASDAQ
Simply Good Foods Co
Food-Confectionery
|
$42.08
|
+0.51
1.23% |
$42.11
|
595,082
133.13% of 50 DAV
50 DAV is 447,000
|
$42.37
-0.68%
|
12/22/2021
|
$40.04
|
PP = $41.45
|
|
MB = $43.52
|
Most Recent Note - 12/29/2021 3:52:13 PM
Y - Inching into new high territory with today's 6th consecutive small gain lacking great volume conviction. Color code was recently changed to yellow with new pivot point cited based on its 11/08/21 high plus 10 cents. Gains above a stock's pivot point must be backed by at least +40% above average volume to trigger a proper technical buy signal. Its 50 DMA line ($38.74) defines important near-term support to watch on pullbacks.
>>> FEATURED STOCK ARTICLE : Formed New 5-Week Base and Perched Near Pivot Point - 12/22/2021 |
View all notes |
Set NEW NOTE alert |
Company Profile |
SEC
News |
Chart |
Request a new note
C
A
S
I |
WDAY
-
NYSE
Workday Inc Cl A
Computer Sftwr-Enterprse
|
$263.72
|
-9.46
-3.46% |
$272.50
|
2,833,338
178.15% of 50 DAV
50 DAV is 1,590,400
|
$307.81
-14.32%
|
9/7/2021
|
$275.69
|
PP = $282.87
|
|
MB = $297.01
|
Most Recent Note - 1/3/2022 1:03:09 PM
G - Today's loss has it slumping further below its 50 DMA line ($281.55) which recently acted as resistance. Its current Relative Strength Rating is 74, below the 80+ minimum guideline for buy candidates. A rebound above the 50 DMA line is needed for its outlook to improve. Prior low ($258.22 on 12/06/21) and 200 DMA line ($255) define the important support where violations may trigger more worrisome technical sell signals. Reported Oct '21 quarterly earnings +28% on +20% sales revenues versus the year ago period. Fundamentals remain strong.
>>> FEATURED STOCK ARTICLE : Relative Strength Rating Fell While Sputtering Below 50 DMA Line - 12/23/2021 |
View all notes |
Set NEW NOTE alert |
Company Profile |
SEC
News |
Chart |
Request a new note
C
A
S
I |
TTD
-
NASDAQ
The Trade Desk Inc Cl A
Comml Svcs-Advertising
|
$90.11
|
-1.53
-1.67% |
$93.26
|
3,733,073
70.24% of 50 DAV
50 DAV is 5,315,000
|
$114.09
-21.02%
|
11/9/2021
|
$95.16
|
PP = $90.00
|
|
MB = $94.50
|
Most Recent Note - 12/31/2021 5:01:58 PM
G - Volume totals have been cooling while consolidating above the prior high ($90) and finding prompt support near its 50 DMA line ($91.51). Recent resilience has helped its outlook improve, but it faces resistance due to overhead supply up to the $114 level.
>>> FEATURED STOCK ARTICLE : Quietly Slumping Into Prior Base and Below 50-Day Moving Average - 12/20/2021 |
View all notes |
Set NEW NOTE alert |
Company Profile |
SEC
News |
Chart |
Request a new note
C
A
S
I |
MEDP
-
NASDAQ
Medpace Holdings Inc
Medical-Research Eqp/Svc
|
$214.31
|
-3.33
-1.53% |
$219.22
|
168,419
96.79% of 50 DAV
50 DAV is 174,000
|
$231.00
-7.23%
|
9/10/2021
|
$196.32
|
PP = $196.22
|
|
MB = $206.03
|
Most Recent Note - 12/28/2021 6:14:57 PM
G - Pulled back today after rebounding near the prior high. Found support near its 50 DMA line ($213.30) recently, and prior highs in the $199 area also define important near-term support to watch. More damaging losses may trigger a worrisome technical sell signal. See the latest FSU analysis for more details and a new annotated graph. Recently noted repeatedly - "Sep '21 earnings rose +18% on +28% sales revenues versus the year ago period, below the +25% minimum earnings guideline (C criteria), raising fundamental concerns.
>>> FEATURED STOCK ARTICLE : Pulling Back After Rebounding Near High - 12/28/2021 |
View all notes |
Set NEW NOTE alert |
Company Profile |
SEC
News |
Chart |
Request a new note
C
A
S
I |
AVTR
-
NYSE
Avantor Inc
Medical-Research Eqp/Svc
|
$40.56
|
-1.58
-3.75% |
$41.99
|
3,641,558
96.62% of 50 DAV
50 DAV is 3,769,000
|
$44.37
-8.59%
|
12/27/2021
|
$41.96
|
PP = $44.47
|
|
MB = $46.69
|
Most Recent Note - 1/3/2022 5:21:37 PM
Y - Pulled back today with higher volume, consolidating above its 50 DMA line ($39.47), and it faces overhead supply up to the $44 level. Subsequent gains above the pivot point backed by at least +40% above average volume may trigger a new technical buy signal. Prior lows in the high $36 area define important near-term support. Reported Sep '21 quarterly earnings +46% above the year ago period.
>>> FEATURED STOCK ARTICLE : Rebounding With Volume-Driven Gains - 12/21/2021 |
View all notes |
Set NEW NOTE alert |
Company Profile |
SEC
News |
Chart |
Request a new note
C
A
S
I |
Symbol/Exchange
Company Name
Industry Group |
PRICE |
CHANGE
(%Change) |
Day High |
Volume
(% DAV)
(% 50 day avg vol) |
52 Wk Hi
% From Hi |
Featured
Date |
Price
Featured |
Pivot Featured |
|
Max Buy |
|
|
|
THESE ARE NOT BUY RECOMMENDATIONS!
Comments contained in the body of this report are technical
opinions only. The material herein has been obtained
from sources believed to be reliable and accurate, however,
its accuracy and completeness cannot be guaranteed.
This site is not an investment advisor, hence it does
not endorse or recommend any securities or other investments.
Any recommendation contained in this report may not
be suitable for all investors and it is not to be deemed
an offer or solicitation on our part with respect to
the purchase or sale of any securities. All trademarks,
service marks and trade names appearing in this report
are the property of their respective owners, and are
likewise used for identification purposes only.
This report is a service available
only to active Paid Premium Members.
You may opt-out of receiving report notifications
at any time. Questions or comments may be submitted
by writing to Premium Membership Services 665 S.E. 10 Street, Suite 201 Deerfield Beach, FL 33441-5634 or by calling 1-800-965-8307
or 954-785-1121.
|
|
|