You are not logged in.
This means you
CAN ONLY VIEW reports that were published prior to Sunday, March 30, 2025.
You
MUST UPGRADE YOUR MEMBERSHIP if you want to see any current reports.
AFTER MARKET UPDATE - FRIDAY, DECEMBER 31ST, 2021
Previous After Market Report Next After Market Report >>>
|
|
|
|
DOW |
-59.78 |
36,338.30 |
-0.16% |
|
Volume |
702,491,193 |
+10% |
|
Volume |
3,349,187,100 |
-9% |
|
NASDAQ |
-96.59 |
15,644.97 |
-0.61% |
|
Advancers |
1,990 |
60% |
|
Advancers |
2,135 |
46% |
|
S&P 500 |
-12.55 |
4,766.18 |
-0.26% |
|
Decliners |
1,333 |
40% |
|
Decliners |
2,537 |
54% |
|
Russell 2000 |
-3.48 |
2,245.31 |
-0.15% |
|
52 Wk Highs |
131 |
|
|
52 Wk Highs |
84 |
|
|
S&P 600 |
-0.62 |
1,401.71 |
-0.04% |
|
52 Wk Lows |
42 |
|
|
52 Wk Lows |
174 |
|
|
 |
Major Indices Pulled Back Yet Closed With Solid Yearly Gains
Kenneth J. Gruneisen - Passed the CAN SLIM® Master's Exam
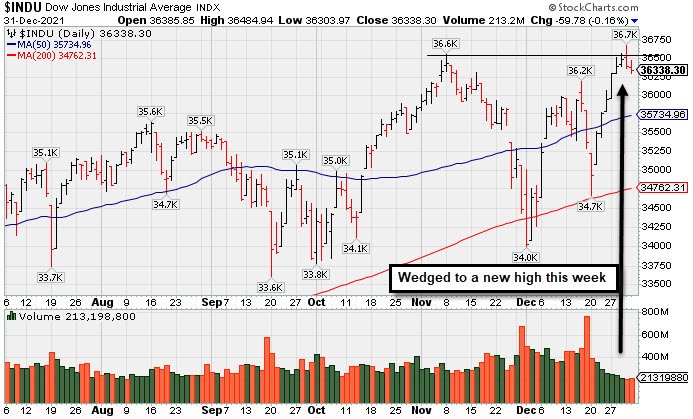
The S&P 500 ended 0.3% lower on the session but posted its best December performance since 2010 (+4.4%). The broad benchmark capped a 26.9% annual rally to extend its strongest three-year run since 1999 (+72%). The Nasdaq Composite dropped 0.6% on the day to pare its monthly gain to 0.7%, still logging a 21.4% increase in 2021. Notably, this marked the first time since 2016 that the tech-heavy index underperformed the broader S&P 500. The Dow lost 59 points but settled 5.4% higher for December en route to this year’s 18.7% rise. The small-cap Russell 2000 was up over 2% on the month and climbed nearly 14% in 2021. For the fourth quarter, the Dow, S&P 500 and Nasdaq Composite advanced 7.4%, 10.7%, and 8.3%, respectively. The volume totals reported Friday were mixed, higher than the prior session on the NYSE and lower on the Nasdaq exchange. Advancers led decliners by a 3-2 margin on the NYSE while decliners outnumbered advancers by 6-5 on the Nasdaq exchange. There were 35 high-ranked companies from the Leaders List that hit new 52-week highs and were listed on the BreakOuts Page, versus the total of 67 on the prior session. New 52-week highs again outnumbered new 52-week lows on the NYSE, but new lows still outnumbered new highs on the Nasdaq exchange. The market averages (M criteria) are in a confirmed uptrend. New buying efforts are to be carefully made under the fact-based investment system's strict criteria.
 PICTURED: The Dow Jones Industrial Average paused after wedging just above the prior high with a streak of gains lacking great volume conviction.
U.S. stocks fell in thin holiday trading on New Year’s Eve, with the major averages perched near records. All 11 S&P 500 sectors closed in positive territory for 2021, with the Energy group leading the advance with a 47.7% ascent—its best year on record. Treasuries held steady, with the yield on the 10-year note unchanged at 1.51%, having risen 60 basis points (0.60%) during the year. The Bloomberg U.S. Treasury Index realized its first negative annual total return since 2013.
In commodities, WTI crude retreated 1.9% to $75.51/barrel, though still recorded its best year since 2009 (+55.5%). In the metals complex, COMEX gold weathered its largest annual decline since 2015, shedding 3.4% to $1,830.20/ounce as a gauge of the U.S. dollar rallied more than 6%. Meanwhile, a benchmark of industrial metals enjoyed its strongest yearly performance over a decade. |
 Kenneth J. Gruneisen started out as a licensed stockbroker in August 1987, a couple of months prior to the historic stock market crash that took the Dow Jones Industrial Average down -22.6% in a single day. He has published daily fact-based fundamental and technical analysis on high-ranked stocks online for two decades. Through FACTBASEDINVESTING.COM, Kenneth provides educational articles, news, market commentary, and other information regarding proven investment systems that work in good times and bad.
Comments contained in the body of this report are technical opinions only and are not necessarily those of Gruneisen Growth Corp. The material herein has been obtained from sources believed to be reliable and accurate, however, its accuracy and completeness cannot be guaranteed. Our firm, employees, and customers may effect transactions, including transactions contrary to any recommendation herein, or have positions in the securities mentioned herein or options with respect thereto. Any recommendation contained in this report may not be suitable for all investors and it is not to be deemed an offer or solicitation on our part with respect to the purchase or sale of any securities. |
|
 |
Retail, Broker/Dealer, and Tech Indexes Edged Lower
Kenneth J. Gruneisen - Passed the CAN SLIM® Master's Exam
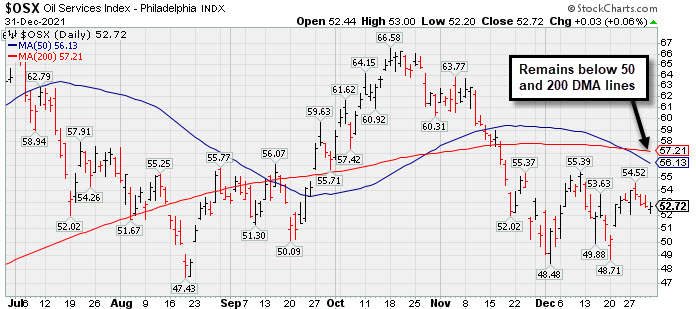
The Retail Index ($RLX -0.30%) and Broker/Dealer Index ($XBD -0.42%) both edged lower while the Bank Index ($BKX -0.06%) finished flat. The Semiconductor Index ($SOX -0.15%), Networking Index ($NWX -0.24%), and Biotech Index ($BTK -0.66%) each ended slightly lower. The Gold & Silver Index ($XAU +0.59%) edged higher while the Oil Services Index ($OSX +0.06%) and Integrated Oil Index ($XOI +0.12%) both were little changed.
PICTURED: The Oil Services Index ($OSX +0.06%) remains below its 50-day and 200-day moving average (DMA) lines.
| Oil Services |
$OSX |
52.72 |
+0.03 |
+0.06% |
+18.93% |
| Integrated Oil |
$XOI |
1,178.20 |
+1.40 |
+0.12% |
+48.67% |
| Semiconductor |
$SOX |
3,946.16 |
-5.88 |
-0.15% |
+41.16% |
| Networking |
$NWX |
971.08 |
-2.31 |
-0.24% |
+35.41% |
| Broker/Dealer |
$XBD |
486.86 |
-2.03 |
-0.42% |
+28.93% |
| Retail |
$RLX |
4,226.46 |
-12.83 |
-0.30% |
+18.61% |
| Gold & Silver |
$XAU |
132.45 |
+0.78 |
+0.59% |
-8.14% |
| Bank |
$BKX |
132.22 |
-0.08 |
-0.06% |
+35.05% |
| Biotech |
$BTK |
5,518.45 |
-36.63 |
-0.66% |
-3.84% |
|
|
|
 |
Recently Found Support at 50-Day Moving Average Line
Kenneth J. Gruneisen - Passed the CAN SLIM® Master's Exam
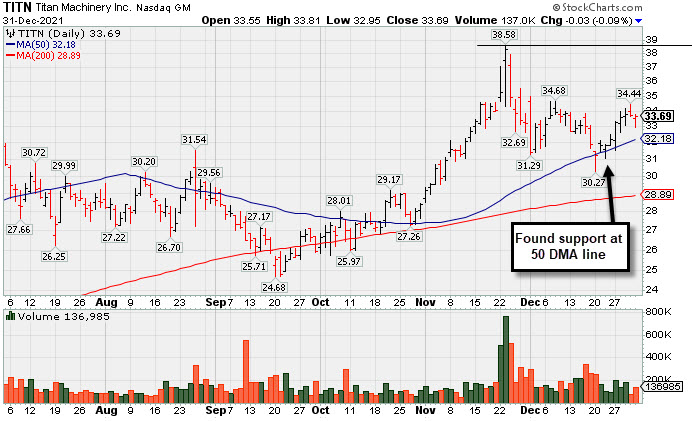
Titan Machinery Inc (TITN -$0.03 or -0.09% to $33.69) has been consolidating after it found prompt support near its 50-day moving average (DMA) line ($32.18). It has not formed a sound base and faces some near-term resistance due to overhead supply up to the $38 level. TITN was first highlighted in yellow in the 11/23/21 mid-day report (read here) with pivot point cited base on its 6/01/21 high plus 10 cents. More detailed analysis an an annotated graph where shown that evening under the headline, "Strong Close With Gain Backed by +467% Above Average Volume".
Bullish action came after it reported Oct '21 quarterly earnings +81% on +26% sales revenues versus the year ago period, its 4th strong quarterly comparison. It currently has the highest possible earnings Per Share Rating of 99. Following years of losses it has shown strong earnings growth for FY '19-21.
The small supply of only 22.6 million shares outstanding (S criteria) can contribute to greater price volatility in the event of institutional buying or selling. The number of top-rated funds owning its shares rose from 241 in Dec '20 to 301 in Sep '21, a reassuring sign concerning the I criteria. Its current Up/Down Volume Ratio of 1.3 is an unbiased indication its shares have been under accumulation over the past 50 days.
|
|
|
Color Codes Explained :
Y - Better candidates highlighted by our
staff of experts.
G - Previously featured
in past reports as yellow but may no longer be buyable under the
guidelines.
***Last / Change / Volume data in this table is the closing quote data***
Symbol/Exchange
Company Name
Industry Group |
PRICE |
CHANGE
(%Change) |
Day High |
Volume
(% DAV)
(% 50 day avg vol) |
52 Wk Hi
% From Hi |
Featured
Date |
Price
Featured |
Pivot Featured |
|
Max Buy |
 BLDR
-
NYSE
BLDR
-
NYSE
Builders Firstsource Inc
Bldg-Constr Prds/Misc
|
$85.71
|
+1.66
1.98% |
$86.20
|
1,449,436
56.16% of 50 DAV
50 DAV is 2,581,000
|
$85.77
-0.07%
|
8/12/2021
|
$52.38
|
PP = $54.09
|
|
MB = $56.79
|
Most Recent Note - 12/27/2021 5:27:27 PM
G - Posted a 4th consecutive gain today with near average volume and hit another new all-time high. Very extended from any sound base. Reported Sep '21 quarterly earnings +308% on +140% sales revenues versus the year ago period. It is well above its 50 DMA line ($69) defines near-term support to watch.
>>> FEATURED STOCK ARTICLE : Perched at Record High After +52% Rally in 4 Months - 12/10/2021 |
View all notes |
Set NEW NOTE alert |
Company Profile |
SEC
News |
Chart |
Request a new note
C
A
S
I |
KFRC
-
NASDAQ
Kforce Inc
Comml Svcs-Staffing
|
$75.22
|
+0.43
0.57% |
$75.57
|
93,990
83.92% of 50 DAV
50 DAV is 112,000
|
$81.47
-7.67%
|
9/10/2021
|
$59.53
|
PP = $64.48
|
|
MB = $67.70
|
Most Recent Note - 12/29/2021 4:50:27 PM
G - Consolidating above its 50 DMA line ($73.27) and prior low ($71.05 on 12/14/21) which define important near-term support levels to watch. Recently reported Sep '21 quarterly earnings +8% on +10% sales revenues versus the year ago period, below the +25% minimum earnings guideline (C criteria), raising fundamental concerns. See the latest FSU analysis for more details and a new annotated graph.
>>> FEATURED STOCK ARTICLE : Consolidating Above its 50-Day Moving Average Line - 12/29/2021 |
View all notes |
Set NEW NOTE alert |
Company Profile |
SEC
News |
Chart |
Request a new note
C
A
S
I |
REGN
-
NASDAQ
Regeneron Pharmaceutical
DRUGS - Biotechnology
|
$631.52
|
-10.99
-1.71% |
$645.50
|
350,330
46.28% of 50 DAV
50 DAV is 757,000
|
$686.62
-8.02%
|
12/13/2021
|
$647.95
|
PP = $686.72
|
|
MB = $721.06
|
 Most Recent Note - 12/31/2021 5:00:37 PM
Y - Pulled back today with light volume consolidating near its 50 DMA line ($632). More damaging losses would raise concerns. Color code was recently changed to yellow with new pivot point cited based on its 9/01/21 high plus 10 cents. Subsequent gains above the pivot point backed by at least +40% above average volume may trigger a technical buy signal.
>>> FEATURED STOCK ARTICLE : Consolidating Near All-Time High With Little Resistance Remaining - 12/13/2021 |
View all notes |
Set NEW NOTE alert |
Company Profile |
SEC
News |
Chart |
Request a new note
C
A
S
I |
LLY
-
NYSE
Eli Lilly & Co
Medical-Diversified
|
$276.22
|
-1.03
-0.37% |
$278.73
|
1,313,638
41.92% of 50 DAV
50 DAV is 3,134,000
|
$283.91
-2.71%
|
12/16/2021
|
$279.28
|
PP = $275.97
|
|
MB = $289.77
|
Most Recent Note - 12/29/2021 3:58:53 PM
Y - Showed resilience after a pullback and volume totals have been cooling while it remains perched near its all-time high. Recent low ($260) defines initial support to watch above its 50 DMA line ($257.49)
>>> FEATURED STOCK ARTICLE : Eli Lilly & Co Powered to New Highs With Volume - 12/16/2021 |
View all notes |
Set NEW NOTE alert |
Company Profile |
SEC
News |
Chart |
Request a new note
C
A
S
I |
CAMT
-
NASDAQ
Camtek Ltd
ELECTRONICS - Scientific and Technical Instrum
|
$46.04
|
+0.35
0.77% |
$46.20
|
70,135
26.57% of 50 DAV
50 DAV is 264,000
|
$49.60
-7.18%
|
11/9/2021
|
$45.43
|
PP = $46.11
|
|
MB = $48.42
|
Most Recent Note - 12/29/2021 4:08:36 PM
G - Posted a gain today with light volume, consolidating above its 50 DMA line ($43.32). Faces little resistance due to overhead supply up to the $49 level. Fundamentals remain strong.
>>> FEATURED STOCK ARTICLE : Closed Above 50-Day Average After Big Gain With Light Volume - 12/15/2021 |
View all notes |
Set NEW NOTE alert |
Company Profile |
SEC
News |
Chart |
Request a new note
C
A
S
I |
Symbol/Exchange
Company Name
Industry Group |
PRICE |
CHANGE
(%Change) |
Day High |
Volume
(% DAV)
(% 50 day avg vol) |
52 Wk Hi
% From Hi |
Featured
Date |
Price
Featured |
Pivot Featured |
|
Max Buy |
AMD
-
NASDAQ
Advanced Micro Devices
ELECTRONICS - Semiconductor - Broad Line
|
$143.90
|
-1.25
-0.86% |
$148.61
|
49,004,139
84.06% of 50 DAV
50 DAV is 58,294,000
|
$164.46
-12.50%
|
10/27/2021
|
$124.91
|
PP = $122.59
|
|
MB = $128.72
|
Most Recent Note - 12/31/2021 12:38:25 PM
G - Volume totals have been cooling while consolidating above its 50 DMA line ($141.85) which recently acted as support. Any violation may trigger a technical sell signal. Fundamentals remain strong after it reported Sep '21 quarterly earnings +78% on +54% sales revenues versus the year ago period.
>>> FEATURED STOCK ARTICLE : AMD Pulling Back After Considerable Rally - 12/1/2021 |
View all notes |
Set NEW NOTE alert |
Company Profile |
SEC
News |
Chart |
Request a new note
C
A
S
I |
UMC
-
NYSE
United Microelectrnc Adr
ELECTRONICS - Semiconductor - Integrated Cir
|
$11.70
|
+0.06
0.52% |
$11.83
|
2,381,067
31.05% of 50 DAV
50 DAV is 7,669,000
|
$12.68
-7.73%
|
12/1/2021
|
$12.60
|
PP = $12.72
|
|
MB = $13.36
|
Most Recent Note - 12/28/2021 6:18:43 PM
Y - Still perched within striking distance of its all-time high after recently retesting support near its 50 DMA line ($11.20). More damaging losses would raise concerns. A gain and solid close above the pivot point may help clinch a proper new (or add-on) technical buy signal. Reported Sep '21 quarterly earnings +100% on +30% sales revenues versus the year ago period.
>>> FEATURED STOCK ARTICLE : Rebound Above 50-Day Moving Average Showed Resilience - 11/30/2021 |
View all notes |
Set NEW NOTE alert |
Company Profile |
SEC
News |
Chart |
Request a new note
C
A
S
I |
ENTG
-
NASDAQ
Entegris Inc
ELECTRONICS - Semiconductor Equipment and Mate
|
$138.58
|
+0.34
0.25% |
$139.80
|
475,569
40.37% of 50 DAV
50 DAV is 1,178,000
|
$158.00
-12.29%
|
8/4/2021
|
$125.33
|
PP = $126.51
|
|
MB = $132.84
|
Most Recent Note - 12/27/2021 5:20:01 PM
G - Posted a 4th consecutive gain today with below average volume after damaging volume-driven losses. A rebound above the 50 DMA line ($143.45) is needed for its outlook to improve. Fundamentals remain strong after it recently reported Sep '21 quarterly earnings +37% on +20% sales revenues versus the year ago period.
>>> FEATURED STOCK ARTICLE : Best Ever Close After Volume-Driven Gain - 11/29/2021 |
View all notes |
Set NEW NOTE alert |
Company Profile |
SEC
News |
Chart |
Request a new note
C
A
S
I |
DHR
-
NYSE
Danaher Corp
Medical-Diversified
|
$329.01
|
+0.54
0.16% |
$331.23
|
1,188,310
45.95% of 50 DAV
50 DAV is 2,586,000
|
$333.96
-1.48%
|
12/16/2021
|
$321.36
|
PP = $334.06
|
|
MB = $350.76
|
Most Recent Note - 12/29/2021 3:41:14 PM
Y - Volume totals have been cooling while consolidating well above its 50 DMA line ($312.51) and still perched within striking distance of its 52-week high. Highlighted in yellow with pivot point cited base on its 9/10/21 high plus 10 cents in the 12/16/21 mid-day report. Subsequent gains above the pivot point with at least +40% above average volume may trigger a technical buy signal. Fundamentals remain strong.
>>> FEATURED STOCK ARTICLE : Consolidating Near Prior Highs Above 50-Day Moving Average - 12/17/2021 |
View all notes |
Set NEW NOTE alert |
Company Profile |
SEC
News |
Chart |
Request a new note
C
A
S
I |
SKY
-
NYSE
Skyline Champion Corp
Bldg-Mobile/Mfg andamp; RV
|
$78.98
|
+0.76
0.97% |
$79.13
|
261,512
52.94% of 50 DAV
50 DAV is 494,000
|
$85.92
-8.08%
|
11/3/2021
|
$72.19
|
PP = $66.92
|
|
MB = $70.27
|
Most Recent Note - 12/30/2021 5:06:47 PM
G - It has not formed a sound new base but promptly rebounded above the 50 DMA line ($74.92). Fundamentals remain strong.
>>> FEATURED STOCK ARTICLE : Pulling Back From All-Time High After Recent Rally - 12/14/2021 |
View all notes |
Set NEW NOTE alert |
Company Profile |
SEC
News |
Chart |
Request a new note
C
A
S
I |
Symbol/Exchange
Company Name
Industry Group |
PRICE |
CHANGE
(%Change) |
Day High |
Volume
(% DAV)
(% 50 day avg vol) |
52 Wk Hi
% From Hi |
Featured
Date |
Price
Featured |
Pivot Featured |
|
Max Buy |
DHI
-
NYSE
D R Horton Inc
MATERIALS and CONSTRUCTION - Residential Construction
|
$108.45
|
+0.94
0.87% |
$108.99
|
981,451
34.99% of 50 DAV
50 DAV is 2,805,000
|
$110.45
-1.81%
|
12/6/2021
|
$104.40
|
PP = $106.99
|
|
MB = $112.34
|
Most Recent Note - 12/27/2021 12:21:38 PM
Y - Volume totals have been cooling while hovering near its all-time high. Showed stalling action since highlighted in yellow with pivot point cited based on its 5/10/21 high plus 10 cents in the 12/06/21 mid-day report. Reported Sep '21 earnings +68% on +27% sales revenues versus the year-ago period, its 8th strong quarterly comparison above the +25% minimum guideline (C criteria). Annual earnings growth (A criteria) has been strong.
>>> FEATURED STOCK ARTICLE : Builder Built a Solid Base And Challenged Prior High - 12/6/2021 |
View all notes |
Set NEW NOTE alert |
Company Profile |
SEC
News |
Chart |
Request a new note
C
A
S
I |
TITN
-
NASDAQ
Titan Machinery Inc
SPECIALTY RETAIL
|
$33.69
|
-0.03
-0.09% |
$33.81
|
136,985
76.96% of 50 DAV
50 DAV is 178,000
|
$38.58
-12.67%
|
11/23/2021
|
$36.22
|
PP = $35.34
|
|
MB = $37.11
|
Most Recent Note - 12/31/2021 5:03:59 PM
G - Consolidating after finding prompt support near its 50 DMA line ($32.18) but it has not formed a sound base and faces resistance due to overhead supply up to the $38 level. Reported Oct '21 quarterly earnings +81% on +26% sales revenues over the year ago period, its 4th strong quarterly comparison. See the latest FSU analysis for more details and a new annotated graph.
>>> FEATURED STOCK ARTICLE : Recently Found Support at 50-Day Moving Average Line - 12/31/2021 |
View all notes |
Set NEW NOTE alert |
Company Profile |
SEC
News |
Chart |
Request a new note
C
A
S
I |
CLFD
-
NASDAQ
Clearfield Inc
TELECOMMUNICATIONS - Cables / Satalite Equipment
|
$84.42
|
+2.62
3.20% |
$85.35
|
189,116
126.92% of 50 DAV
50 DAV is 149,000
|
$86.71
-2.64%
|
12/16/2021
|
$72.76
|
PP = $72.10
|
|
MB = $75.71
|
Most Recent Note - 12/31/2021 12:49:37 PM
G - Perched at its all-time high and holding its ground following volume-driven gains, very extended from the prior base. Prior high ($72) defines initial support to watch on pullbacks. Reported Sep '21 quarterly earnings +141% on +66% sales revenues above the year ago period.
>>> FEATURED STOCK ARTICLE : Negative Reversal After Hitting a New All Time High - 12/30/2021 |
View all notes |
Set NEW NOTE alert |
Company Profile |
SEC
News |
Chart |
Request a new note
C
A
S
I |
ODFL
-
NASDAQ
Old Dominion Fght Line
TRANSPORTATION - Trucking
|
$358.38
|
+2.11
0.59% |
$359.69
|
275,430
45.38% of 50 DAV
50 DAV is 607,000
|
$373.58
-4.07%
|
12/7/2021
|
$365.61
|
PP = $364.17
|
|
MB = $382.38
|
Most Recent Note - 12/29/2021 4:01:37 PM
Y - Posted a 6th consecutive small gain today with light volume after finding prompt support near its 50 DMA line ($347.53). Faces very little near term resistance up to the $373 level..
>>> FEATURED STOCK ARTICLE : Perched at All Time High After Tight Consolidation Several Weeks - 12/7/2021 |
View all notes |
Set NEW NOTE alert |
Company Profile |
SEC
News |
Chart |
Request a new note
C
A
S
I |
POOL
-
NASDAQ
Pool Corp
WHOLESALE - Basic Materials Wholesale
|
$566.00
|
+5.19
0.93% |
$569.21
|
142,945
57.87% of 50 DAV
50 DAV is 247,000
|
$582.27
-2.79%
|
12/27/2021
|
$555.44
|
PP = $582.37
|
|
MB = $611.49
|
Most Recent Note - 12/28/2021 12:25:11 PM
Y - Color code was changed to yellow with new pivot point cited based on its 11/19/21 high plus 10 cents. Subsequent gains above the pivot point backed by at least +40% above average volume may trigger a new technical buy signal. Reported strong Sep '21 quarterly results and found support at its 50 DMA line ($539) during the recent consolidation. Showed resilience since dropped from the Featured Stocks list on 10/04/21.
>>> FEATURED STOCK ARTICLE : Forming New Base After Finding Prompt Support at 50 DMA - 12/27/2021 |
View all notes |
Set NEW NOTE alert |
Company Profile |
SEC
News |
Chart |
Request a new note
C
A
S
I |
Symbol/Exchange
Company Name
Industry Group |
PRICE |
CHANGE
(%Change) |
Day High |
Volume
(% DAV)
(% 50 day avg vol) |
52 Wk Hi
% From Hi |
Featured
Date |
Price
Featured |
Pivot Featured |
|
Max Buy |
SMPL
-
NASDAQ
Simply Good Foods Co
Food-Confectionery
|
$41.57
|
+0.29
0.70% |
$41.80
|
354,087
79.04% of 50 DAV
50 DAV is 448,000
|
$42.37
-1.89%
|
12/22/2021
|
$40.04
|
PP = $41.45
|
|
MB = $43.52
|
Most Recent Note - 12/29/2021 3:52:13 PM
Y - Inching into new high territory with today's 6th consecutive small gain lacking great volume conviction. Color code was recently changed to yellow with new pivot point cited based on its 11/08/21 high plus 10 cents. Gains above a stock's pivot point must be backed by at least +40% above average volume to trigger a proper technical buy signal. Its 50 DMA line ($38.74) defines important near-term support to watch on pullbacks.
>>> FEATURED STOCK ARTICLE : Formed New 5-Week Base and Perched Near Pivot Point - 12/22/2021 |
View all notes |
Set NEW NOTE alert |
Company Profile |
SEC
News |
Chart |
Request a new note
C
A
S
I |
WDAY
-
NYSE
Workday Inc Cl A
Computer Sftwr-Enterprse
|
$273.18
|
-3.32
-1.20% |
$277.29
|
748,045
47.02% of 50 DAV
50 DAV is 1,591,000
|
$307.81
-11.25%
|
9/7/2021
|
$275.69
|
PP = $282.87
|
|
MB = $297.01
|
Most Recent Note - 12/29/2021 4:03:53 PM
G - Its current Relative Strength Rating is 77, still the 80+ minimum guideline for buy candidates. Still lingering below its 50 DMA line ($282) which has acted as resistance. A rebound above the 50 DMA line is needed for its outlook to improve. Prior low ($258.22 on 12/06/21) and 200 DMA line ($254.85) define the next important support to watch. Reported Oct '21 quarterly earnings +28% on +20% sales revenues versus the year ago period. Fundamentals remain strong.
>>> FEATURED STOCK ARTICLE : Relative Strength Rating Fell While Sputtering Below 50 DMA Line - 12/23/2021 |
View all notes |
Set NEW NOTE alert |
Company Profile |
SEC
News |
Chart |
Request a new note
C
A
S
I |
TTD
-
NASDAQ
The Trade Desk Inc Cl A
Comml Svcs-Advertising
|
$91.64
|
-2.63
-2.79% |
$94.85
|
2,223,220
41.79% of 50 DAV
50 DAV is 5,320,000
|
$114.09
-19.68%
|
11/9/2021
|
$95.16
|
PP = $90.00
|
|
MB = $94.50
|
Most Recent Note - 12/31/2021 5:01:58 PM
G - Volume totals have been cooling while consolidating above the prior high ($90) and finding prompt support near its 50 DMA line ($91.51). Recent resilience has helped its outlook improve, but it faces resistance due to overhead supply up to the $114 level.
>>> FEATURED STOCK ARTICLE : Quietly Slumping Into Prior Base and Below 50-Day Moving Average - 12/20/2021 |
View all notes |
Set NEW NOTE alert |
Company Profile |
SEC
News |
Chart |
Request a new note
C
A
S
I |
MEDP
-
NASDAQ
Medpace Holdings Inc
Medical-Research Eqp/Svc
|
$217.64
|
-1.44
-0.66% |
$221.34
|
108,656
62.45% of 50 DAV
50 DAV is 174,000
|
$231.00
-5.78%
|
9/10/2021
|
$196.32
|
PP = $196.22
|
|
MB = $206.03
|
Most Recent Note - 12/28/2021 6:14:57 PM
G - Pulled back today after rebounding near the prior high. Found support near its 50 DMA line ($213.30) recently, and prior highs in the $199 area also define important near-term support to watch. More damaging losses may trigger a worrisome technical sell signal. See the latest FSU analysis for more details and a new annotated graph. Recently noted repeatedly - "Sep '21 earnings rose +18% on +28% sales revenues versus the year ago period, below the +25% minimum earnings guideline (C criteria), raising fundamental concerns.
>>> FEATURED STOCK ARTICLE : Pulling Back After Rebounding Near High - 12/28/2021 |
View all notes |
Set NEW NOTE alert |
Company Profile |
SEC
News |
Chart |
Request a new note
C
A
S
I |
AVTR
-
NYSE
Avantor Inc
Medical-Research Eqp/Svc
|
$42.14
|
+0.13
0.31% |
$42.48
|
2,242,652
59.31% of 50 DAV
50 DAV is 3,781,000
|
$44.37
-5.03%
|
12/27/2021
|
$41.96
|
PP = $44.47
|
|
MB = $46.69
|
Most Recent Note - 12/27/2021 5:26:44 PM
Y - Color code is changed to yellow with new pivot point cited based on its 9/23/21 high plus 10 cents. Posted a 4th consecutive gain today with lighter volume. Consolidating above its 50 DMA line ($39.16) and it faces little overhead supply up to the $44 level. Subsequent gains above the pivot point backed by at least +40% above average volume may trigger a new technical buy signal. Prior lows in the high $36 area define important near-term support. Reported Sep '21 quarterly earnings +46% above the year ago period.
>>> FEATURED STOCK ARTICLE : Rebounding With Volume-Driven Gains - 12/21/2021 |
View all notes |
Set NEW NOTE alert |
Company Profile |
SEC
News |
Chart |
Request a new note
C
A
S
I |
Symbol/Exchange
Company Name
Industry Group |
PRICE |
CHANGE
(%Change) |
Day High |
Volume
(% DAV)
(% 50 day avg vol) |
52 Wk Hi
% From Hi |
Featured
Date |
Price
Featured |
Pivot Featured |
|
Max Buy |
|
|
|
THESE ARE NOT BUY RECOMMENDATIONS!
Comments contained in the body of this report are technical
opinions only. The material herein has been obtained
from sources believed to be reliable and accurate, however,
its accuracy and completeness cannot be guaranteed.
This site is not an investment advisor, hence it does
not endorse or recommend any securities or other investments.
Any recommendation contained in this report may not
be suitable for all investors and it is not to be deemed
an offer or solicitation on our part with respect to
the purchase or sale of any securities. All trademarks,
service marks and trade names appearing in this report
are the property of their respective owners, and are
likewise used for identification purposes only.
This report is a service available
only to active Paid Premium Members.
You may opt-out of receiving report notifications
at any time. Questions or comments may be submitted
by writing to Premium Membership Services 665 S.E. 10 Street, Suite 201 Deerfield Beach, FL 33441-5634 or by calling 1-800-965-8307
or 954-785-1121.
|
|
|