***Last / Change / Volume data in this table is the closing quote data***
Symbol/Exchange
Company Name
Industry Group |
PRICE |
CHANGE
(%Change) |
Day High |
Volume
(% DAV)
(% 50 day avg vol) |
52 Wk Hi
% From Hi |
Featured
Date |
Price
Featured |
Pivot Featured |
|
Max Buy |
 BLDR
-
NYSE
BLDR
-
NYSE
Builders Firstsource Inc
Bldg-Constr Prds/Misc
|
$85.42
|
+1.93
2.31% |
$85.55
|
2,342,825
89.52% of 50 DAV
50 DAV is 2,617,000
|
$86.48
-1.23%
|
8/12/2021
|
$52.38
|
PP = $54.09
|
|
MB = $56.79
|
Most Recent Note - 1/3/2022 5:23:16 PM
G - Pulled back from its all-time high with today's loss. It is very extended from any sound base. Reported Sep '21 quarterly earnings +308% on +140% sales revenues versus the year ago period. Its 50 DMA line ($71.69) defines near-term support to watch.
>>> FEATURED STOCK ARTICLE : Perched at Record High After +52% Rally in 4 Months - 12/10/2021 |
View all notes |
Set NEW NOTE alert |
Company Profile |
SEC
News |
Chart |
Request a new note
C
A
S
I |
KFRC
-
NASDAQ
Kforce Inc
Comml Svcs-Staffing
|
$75.74
|
-0.21
-0.28% |
$77.06
|
60,691
53.24% of 50 DAV
50 DAV is 114,000
|
$81.47
-7.03%
|
9/10/2021
|
$59.53
|
PP = $64.48
|
|
MB = $67.70
|
Most Recent Note - 12/29/2021 4:50:27 PM
G - Consolidating above its 50 DMA line ($73.27) and prior low ($71.05 on 12/14/21) which define important near-term support levels to watch. Recently reported Sep '21 quarterly earnings +8% on +10% sales revenues versus the year ago period, below the +25% minimum earnings guideline (C criteria), raising fundamental concerns. See the latest FSU analysis for more details and a new annotated graph.
>>> FEATURED STOCK ARTICLE : Consolidating Above its 50-Day Moving Average Line - 12/29/2021 |
View all notes |
Set NEW NOTE alert |
Company Profile |
SEC
News |
Chart |
Request a new note
C
A
S
I |
REGN
-
NASDAQ
Regeneron Pharmaceutical
DRUGS - Biotechnology
|
$616.82
|
-10.28
-1.64% |
$625.07
|
705,877
94.75% of 50 DAV
50 DAV is 745,000
|
$686.62
-10.17%
|
12/13/2021
|
$647.95
|
PP = $686.72
|
|
MB = $721.06
|
Most Recent Note - 12/31/2021 5:00:37 PM
Y - Pulled back today with light volume consolidating near its 50 DMA line ($632). More damaging losses would raise concerns. Color code was recently changed to yellow with new pivot point cited based on its 9/01/21 high plus 10 cents. Subsequent gains above the pivot point backed by at least +40% above average volume may trigger a technical buy signal.
>>> FEATURED STOCK ARTICLE : Consolidating Near All-Time High With Little Resistance Remaining - 12/13/2021 |
View all notes |
Set NEW NOTE alert |
Company Profile |
SEC
News |
Chart |
Request a new note
C
A
S
I |
LLY
-
NYSE
Eli Lilly & Co
Medical-Diversified
|
$266.81
|
-4.92
-1.81% |
$269.88
|
2,335,718
74.20% of 50 DAV
50 DAV is 3,148,000
|
$283.91
-6.02%
|
12/16/2021
|
$279.28
|
PP = $275.97
|
|
MB = $289.77
|
Most Recent Note - 12/29/2021 3:58:53 PM
Y - Showed resilience after a pullback and volume totals have been cooling while it remains perched near its all-time high. Recent low ($260) defines initial support to watch above its 50 DMA line ($257.49)
>>> FEATURED STOCK ARTICLE : Eli Lilly & Co Powered to New Highs With Volume - 12/16/2021 |
View all notes |
Set NEW NOTE alert |
Company Profile |
SEC
News |
Chart |
Request a new note
C
A
S
I |
CAMT
-
NASDAQ
Camtek Ltd
ELECTRONICS - Scientific and Technical Instrum
|
$45.35
|
-2.97
-6.15% |
$48.60
|
256,215
95.96% of 50 DAV
50 DAV is 267,000
|
$49.60
-8.57%
|
11/9/2021
|
$45.43
|
PP = $46.11
|
|
MB = $48.42
|
 Most Recent Note - 1/4/2022 5:50:11 PM
G - Pulled back abruptly today with higher (near average) volume. Faces little resistance due to overhead supply up to the $49 level. Fundamentals remain strong. Its 50 DMA line ($43.88) defines support above the prior low.
>>> FEATURED STOCK ARTICLE : Closed Above 50-Day Average After Big Gain With Light Volume - 12/15/2021 |
View all notes |
Set NEW NOTE alert |
Company Profile |
SEC
News |
Chart |
Request a new note
C
A
S
I |
Symbol/Exchange
Company Name
Industry Group |
PRICE |
CHANGE
(%Change) |
Day High |
Volume
(% DAV)
(% 50 day avg vol) |
52 Wk Hi
% From Hi |
Featured
Date |
Price
Featured |
Pivot Featured |
|
Max Buy |
AMD
-
NASDAQ
Advanced Micro Devices
ELECTRONICS - Semiconductor - Broad Line
|
$144.42
|
-5.82
-3.87% |
$152.42
|
79,988,163
135.36% of 50 DAV
50 DAV is 59,091,000
|
$164.46
-12.19%
|
10/27/2021
|
$124.91
|
PP = $122.59
|
|
MB = $128.72
|
Most Recent Note - 1/4/2022 12:25:51 PM
G - Big loss today with higher volume is testing its 50 DMA line ($142.88) which recently acted as support. A damaging violation may trigger a technical sell signal. Prior low ($130.60) defines the next important chart support level to watch. Fundamentals remain strong after it reported Sep '21 quarterly earnings +78% on +54% sales revenues versus the year ago period.
>>> FEATURED STOCK ARTICLE : AMD Pulling Back After Considerable Rally - 12/1/2021 |
View all notes |
Set NEW NOTE alert |
Company Profile |
SEC
News |
Chart |
Request a new note
C
A
S
I |
UMC
-
NYSE
United Microelectrnc Adr
ELECTRONICS - Semiconductor - Integrated Cir
|
$11.51
|
-0.13
-1.12% |
$11.62
|
8,292,547
108.84% of 50 DAV
50 DAV is 7,619,000
|
$12.68
-9.23%
|
12/1/2021
|
$12.60
|
PP = $12.72
|
|
MB = $13.36
|
Most Recent Note - 1/4/2022 5:44:47 PM
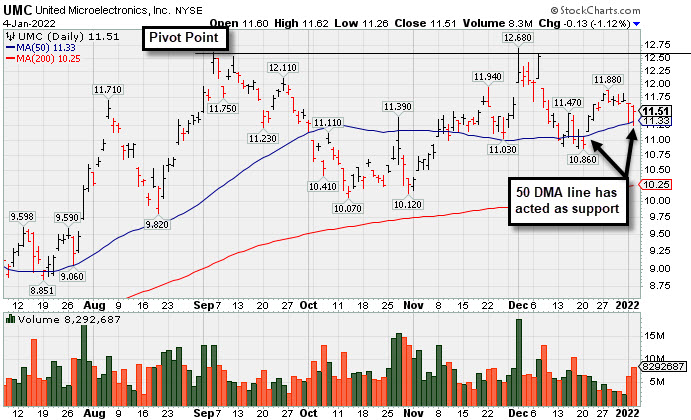
Y - Recent losses are retesting support near its 50 DMA line ($11.32). More damaging losses would raise concerns. A gain and solid close above the pivot point may help clinch a proper new (or add-on) technical buy signal. Reported Sep '21 quarterly earnings +100% on +30% sales revenues versus the year ago period. See the latest FSU analysis for more details and a new annotated graph.
>>> FEATURED STOCK ARTICLE : Testing Support and Perched Not Far From Prior Highs - 1/4/2022 |
View all notes |
Set NEW NOTE alert |
Company Profile |
SEC
News |
Chart |
Request a new note
C
A
S
I |
ENTG
-
NASDAQ
Entegris Inc
ELECTRONICS - Semiconductor Equipment and Mate
|
$139.22
|
+0.83
0.60% |
$139.65
|
1,322,428
112.45% of 50 DAV
50 DAV is 1,176,000
|
$158.00
-11.89%
|
8/4/2021
|
$125.33
|
PP = $126.51
|
|
MB = $132.84
|
Most Recent Note - 1/3/2022 5:26:18 PM
G - Still sputtering and a rebound above the 50 DMA line ($144.25) is needed for its outlook to improve. Fundamentals remain strong after it recently reported Sep '21 quarterly earnings +37% on +20% sales revenues versus the year ago period. See the latest FSU analysis for more details and a new annotated graph.
>>> FEATURED STOCK ARTICLE : Still Below 50-Day Moving Average - 1/3/2022 |
View all notes |
Set NEW NOTE alert |
Company Profile |
SEC
News |
Chart |
Request a new note
C
A
S
I |
DHR
-
NYSE
Danaher Corp
Medical-Diversified
|
$307.26
|
-8.50
-2.69% |
$316.04
|
4,468,852
173.48% of 50 DAV
50 DAV is 2,576,000
|
$333.96
-7.99%
|
12/16/2021
|
$321.36
|
PP = $334.06
|
|
MB = $350.76
|
Most Recent Note - 1/3/2022 5:28:12 PM
Y - Volume was higher as it pulled back today testing its 50 DMA line ($313.29) after it was perched within striking distance of its 52-week high. Highlighted in yellow with pivot point cited base on its 9/10/21 high plus 10 cents in the 12/16/21 mid-day report. Subsequent gains above the pivot point with at least +40% above average volume may trigger a technical buy signal. Fundamentals remain strong.
>>> FEATURED STOCK ARTICLE : Consolidating Near Prior Highs Above 50-Day Moving Average - 12/17/2021 |
View all notes |
Set NEW NOTE alert |
Company Profile |
SEC
News |
Chart |
Request a new note
C
A
S
I |
SKY
-
NYSE
Skyline Champion Corp
Bldg-Mobile/Mfg andamp; RV
|
$79.23
|
+1.29
1.66% |
$79.65
|
364,340
72.58% of 50 DAV
50 DAV is 502,000
|
$85.92
-7.79%
|
11/3/2021
|
$72.19
|
PP = $66.92
|
|
MB = $70.27
|
Most Recent Note - 12/30/2021 5:06:47 PM
G - It has not formed a sound new base but promptly rebounded above the 50 DMA line ($74.92). Fundamentals remain strong.
>>> FEATURED STOCK ARTICLE : Pulling Back From All-Time High After Recent Rally - 12/14/2021 |
View all notes |
Set NEW NOTE alert |
Company Profile |
SEC
News |
Chart |
Request a new note
C
A
S
I |
Symbol/Exchange
Company Name
Industry Group |
PRICE |
CHANGE
(%Change) |
Day High |
Volume
(% DAV)
(% 50 day avg vol) |
52 Wk Hi
% From Hi |
Featured
Date |
Price
Featured |
Pivot Featured |
|
Max Buy |
DHI
-
NYSE
D R Horton Inc
MATERIALS and CONSTRUCTION - Residential Construction
|
$105.72
|
+0.46
0.44% |
$106.75
|
3,502,997
124.66% of 50 DAV
50 DAV is 2,810,000
|
$110.45
-4.28%
|
12/6/2021
|
$104.40
|
PP = $106.99
|
|
MB = $112.34
|
Most Recent Note - 1/3/2022 5:24:46 PM
Y - Volume was higher (near average) behind today's loss while perched near its all-time high. Showed stalling action since highlighted in yellow with pivot point cited based on its 5/10/21 high plus 10 cents in the 12/06/21 mid-day report. Reported Sep '21 earnings +68% on +27% sales revenues versus the year-ago period, its 8th strong quarterly comparison above the +25% minimum guideline (C criteria). Annual earnings growth (A criteria) has been strong.
>>> FEATURED STOCK ARTICLE : Builder Built a Solid Base And Challenged Prior High - 12/6/2021 |
View all notes |
Set NEW NOTE alert |
Company Profile |
SEC
News |
Chart |
Request a new note
C
A
S
I |
TITN
-
NASDAQ
Titan Machinery Inc
SPECIALTY RETAIL
|
$35.39
|
+1.43
4.21% |
$35.66
|
132,326
74.34% of 50 DAV
50 DAV is 178,000
|
$38.58
-8.27%
|
11/23/2021
|
$36.22
|
PP = $35.34
|
|
MB = $37.11
|
Most Recent Note - 12/31/2021 5:03:59 PM
G - Consolidating after finding prompt support near its 50 DMA line ($32.18) but it has not formed a sound base and faces resistance due to overhead supply up to the $38 level. Reported Oct '21 quarterly earnings +81% on +26% sales revenues over the year ago period, its 4th strong quarterly comparison. See the latest FSU analysis for more details and a new annotated graph.
>>> FEATURED STOCK ARTICLE : Recently Found Support at 50-Day Moving Average Line - 12/31/2021 |
View all notes |
Set NEW NOTE alert |
Company Profile |
SEC
News |
Chart |
Request a new note
C
A
S
I |
CLFD
-
NASDAQ
Clearfield Inc
TELECOMMUNICATIONS - Cables / Satalite Equipment
|
$81.00
|
+0.65
0.81% |
$82.97
|
131,431
83.71% of 50 DAV
50 DAV is 157,000
|
$86.71
-6.59%
|
12/16/2021
|
$72.76
|
PP = $72.10
|
|
MB = $75.71
|
Most Recent Note - 1/3/2022 12:26:47 PM
G - Pulling back from its all-time high following volume-driven gains. Very extended from the prior base, the prior high ($72) defines initial support to watch above its 50 DMA line ($66.69). Reported Sep '21 quarterly earnings +141% on +66% sales revenues above the year ago period.
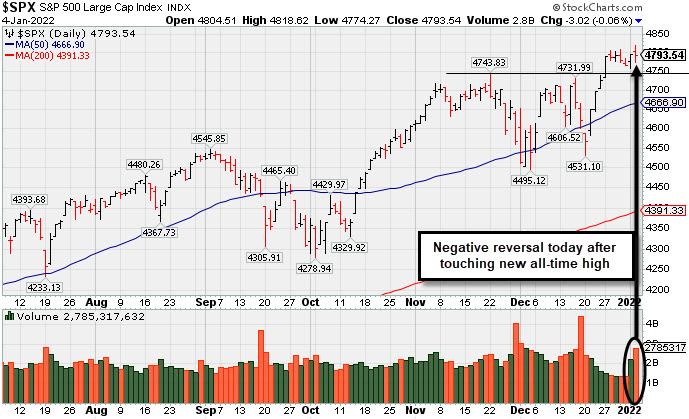
>>> FEATURED STOCK ARTICLE : Negative Reversal After Hitting a New All Time High - 12/30/2021 |
View all notes |
Set NEW NOTE alert |
Company Profile |
SEC
News |
Chart |
Request a new note
C
A
S
I |
ODFL
-
NASDAQ
Old Dominion Fght Line
TRANSPORTATION - Trucking
|
$354.98
|
+8.61
2.49% |
$356.42
|
810,621
133.33% of 50 DAV
50 DAV is 608,000
|
$373.58
-4.98%
|
12/7/2021
|
$365.61
|
PP = $364.17
|
|
MB = $382.38
|
Most Recent Note - 1/4/2022 5:57:36 PM
Y - Posted a gain today with slightly above average volume, again finding prompt support near its 50 DMA line ($350.62). Faces very little near term resistance up to the $373 level..
>>> FEATURED STOCK ARTICLE : Perched at All Time High After Tight Consolidation Several Weeks - 12/7/2021 |
View all notes |
Set NEW NOTE alert |
Company Profile |
SEC
News |
Chart |
Request a new note
C
A
S
I |
POOL
-
NASDAQ
Pool Corp
WHOLESALE - Basic Materials Wholesale
|
$549.89
|
-0.36
-0.07% |
$555.64
|
193,963
79.49% of 50 DAV
50 DAV is 244,000
|
$582.27
-5.56%
|
12/27/2021
|
$555.44
|
PP = $582.37
|
|
MB = $611.49
|
Most Recent Note - 1/3/2022 5:32:06 PM
Y - Suffered a loss today testing its 50 DMA line ($546.49). Color code was changed to yellow with new pivot point cited based on its 11/19/21 high plus 10 cents. Subsequent gains above the pivot point backed by at least +40% above average volume may trigger a new technical buy signal. Reported strong Sep '21 quarterly results.
>>> FEATURED STOCK ARTICLE : Forming New Base After Finding Prompt Support at 50 DMA - 12/27/2021 |
View all notes |
Set NEW NOTE alert |
Company Profile |
SEC
News |
Chart |
Request a new note
C
A
S
I |
Symbol/Exchange
Company Name
Industry Group |
PRICE |
CHANGE
(%Change) |
Day High |
Volume
(% DAV)
(% 50 day avg vol) |
52 Wk Hi
% From Hi |
Featured
Date |
Price
Featured |
Pivot Featured |
|
Max Buy |
SMPL
-
NASDAQ
Simply Good Foods Co
Food-Confectionery
|
$42.35
|
+0.27
0.64% |
$43.17
|
929,235
207.88% of 50 DAV
50 DAV is 447,000
|
$42.37
-0.05%
|
12/22/2021
|
$40.04
|
PP = $41.45
|
|
MB = $43.52
|
Most Recent Note - 1/4/2022 6:01:28 PM
Y - Hit a new high today while adding to a recently noted spurt of small gains marked by higher volume. Due to report Nov '21 quarterly results. Volume and volatility often increase near earnings news. Its 50 DMA line ($39.27) defines important near-term support to watch on pullbacks.
>>> FEATURED STOCK ARTICLE : Formed New 5-Week Base and Perched Near Pivot Point - 12/22/2021 |
View all notes |
Set NEW NOTE alert |
Company Profile |
SEC
News |
Chart |
Request a new note
C
A
S
I |
WDAY
-
NYSE
Workday Inc Cl A
Computer Sftwr-Enterprse
|
$253.06
|
-10.66
-4.04% |
$263.95
|
5,063,131
312.08% of 50 DAV
50 DAV is 1,622,400
|
$307.81
-17.79%
|
9/7/2021
|
$275.69
|
PP = $282.87
|
|
MB = $297.01
|
Most Recent Note - 1/4/2022 5:56:05 PM
It will be dropped from the Featured Stocks list tonight after a more damaging volume-driven loss undercutting its 200 DMA line and prior lows. Its current Relative Strength Rating is 60, below the 80+ minimum guideline for buy candidates. A rebound above the 50 DMA line is needed for its outlook to improve. Fundamentals remain strong.
>>> FEATURED STOCK ARTICLE : Relative Strength Rating Fell While Sputtering Below 50 DMA Line - 12/23/2021 |
View all notes |
Set NEW NOTE alert |
Company Profile |
SEC
News |
Chart |
Request a new note
C
A
S
I |
TTD
-
NASDAQ
The Trade Desk Inc Cl A
Comml Svcs-Advertising
|
$85.36
|
-4.75
-5.27% |
$90.85
|
7,356,809
137.79% of 50 DAV
50 DAV is 5,339,000
|
$114.09
-25.18%
|
11/9/2021
|
$95.16
|
PP = $90.00
|
|
MB = $94.50
|
Most Recent Note - 1/4/2022 5:53:10 PM
Volume was higher behind today's damaging loss violating its 50 DMA line ($91.92) and undercutting the prior low. It will be dropped from the Featured Stocks list tonight. Only a prompt rebound above the 50 DMA line would help its outlook improve. Faces resistance due to overhead supply up to the $114 level.
>>> FEATURED STOCK ARTICLE : Quietly Slumping Into Prior Base and Below 50-Day Moving Average - 12/20/2021 |
View all notes |
Set NEW NOTE alert |
Company Profile |
SEC
News |
Chart |
Request a new note
C
A
S
I |
MEDP
-
NASDAQ
Medpace Holdings Inc
Medical-Research Eqp/Svc
|
$204.68
|
-9.63
-4.49% |
$215.90
|
174,922
100.53% of 50 DAV
50 DAV is 174,000
|
$231.00
-11.39%
|
9/10/2021
|
$196.32
|
PP = $196.22
|
|
MB = $206.03
|
Most Recent Note - 1/4/2022 5:49:01 PM
Violated its 50 DMA line ($216) with today's big loss raising concerns and testing the prior low in the $199 area. Only a prompt rebound above the 50 DMA line would help its outlook improve. It will be dropped from the Featured Stocks list tonight. Recently noted repeatedly - "Sep '21 earnings rose +18% on +28% sales revenues versus the year ago period, below the +25% minimum earnings guideline (C criteria), raising fundamental concerns.
>>> FEATURED STOCK ARTICLE : Pulling Back After Rebounding Near High - 12/28/2021 |
View all notes |
Set NEW NOTE alert |
Company Profile |
SEC
News |
Chart |
Request a new note
C
A
S
I |
AVTR
-
NYSE
Avantor Inc
Medical-Research Eqp/Svc
|
$39.17
|
-1.39
-3.43% |
$40.20
|
4,951,105
131.40% of 50 DAV
50 DAV is 3,768,000
|
$44.37
-11.72%
|
12/27/2021
|
$41.96
|
PP = $44.47
|
|
MB = $46.69
|
Most Recent Note - 1/3/2022 5:21:37 PM
Y - Pulled back today with higher volume, consolidating above its 50 DMA line ($39.47), and it faces overhead supply up to the $44 level. Subsequent gains above the pivot point backed by at least +40% above average volume may trigger a new technical buy signal. Prior lows in the high $36 area define important near-term support. Reported Sep '21 quarterly earnings +46% above the year ago period.
>>> FEATURED STOCK ARTICLE : Rebounding With Volume-Driven Gains - 12/21/2021 |
View all notes |
Set NEW NOTE alert |
Company Profile |
SEC
News |
Chart |
Request a new note
C
A
S
I |
Symbol/Exchange
Company Name
Industry Group |
PRICE |
CHANGE
(%Change) |
Day High |
Volume
(% DAV)
(% 50 day avg vol) |
52 Wk Hi
% From Hi |
Featured
Date |
Price
Featured |
Pivot Featured |
|
Max Buy |