You are not logged in.
This means you
CAN ONLY VIEW reports that were published prior to Tuesday, March 25, 2025.
You
MUST UPGRADE YOUR MEMBERSHIP if you want to see any current reports.
AFTER MARKET UPDATE - THURSDAY, DECEMBER 15TH, 2022
Previous After Market Report Next After Market Report >>>
|
|
|
|
DOW |
-764.13 |
33,202.22 |
-2.25% |
|
Volume |
1,038,665,544 |
-2% |
|
Volume |
5,544,446,900 |
+1% |
|
NASDAQ |
-360.36 |
10,810.53 |
-3.23% |
|
Advancers |
553 |
18% |
|
Advancers |
1,212 |
27% |
|
S&P 500 |
-99.57 |
3,895.75 |
-2.49% |
|
Decliners |
2,466 |
82% |
|
Decliners |
3,342 |
73% |
|
Russell 2000 |
-45.85 |
1,774.61 |
-2.52% |
|
52 Wk Highs |
38 |
|
|
52 Wk Highs |
83 |
|
|
S&P 600 |
-28.55 |
1,165.04 |
-2.39% |
|
52 Wk Lows |
126 |
|
|
52 Wk Lows |
379 |
|
|
 |
Breadth Negative as Major Averages Suffer Big Losses
Kenneth J. Gruneisen - Passed the CAN SLIM® Master's Exam
The Dow dropped 764 points, while the Nasdaq Composite fell 3.2%. The S&P 500 declined 2.5%, with all 11 sectors ending in negative territory. Volume totals were mixed, lighter than the prior session on the NYSE and higher on the Nasdaq exchange. Breadth was negative as decliners led advancers by more than a 4-1 margin on the NYSE and nearly 3-1 on the Nasdaq exchange. There were 10 high-ranked companies from the Leaders List that hit new 52-week highs and were listed on the BreakOuts Page, versus the total of 20 on the prior session. New 52-week lows totals expanded and solidly outnumbered shrinking new 52-week highs on the NYSE and on the Nasdaq exchange. The market is in an uptrend under pressure (M criteria). Healthy leadership (new 52-week highs totals) must continue for the rally be productive, but new highs totals have recently contracted. Only stocks meeting all key-criteria of the fact-based investment system should be considered as buy candidates.
Chart courtesy of www.stockcharts.com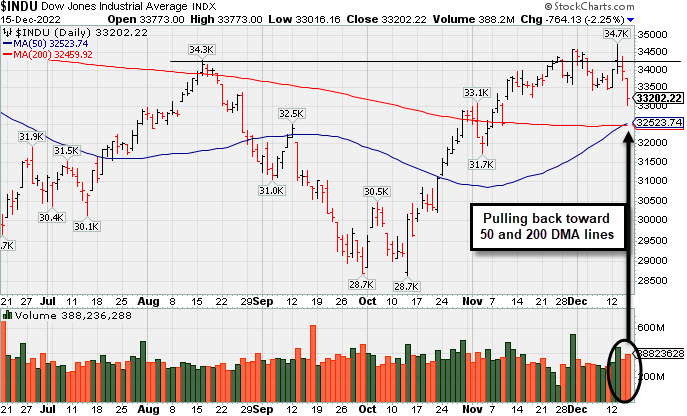 PICTURED: The Dow Jones Industrial Average fell back below its 200-day moving average (DMA) line after rallying above it on the prior session. Subsequent gains and a rebound back above the 200 DMA could help to signal that the benchmark index is in healthier shape.
U.S. equities plummeted Thursday following November’s largest retail sales drop in almost a year. Retail sales declined 0.6% missing estimates of -0.2% for the month of November and down significantly from October’s 1.3% growth. Some analysts said the disappointing retail data may suggest inflation and the Federal Reserve’s (Fed) rate hikes have taken a toll on consumers. Meanwhile, investor concerns grow worrisome that the Fed will push the economy into a recession rather than assist in a “soft landing”.
On the data front, initial jobless claims came in lighter-than-expected for the week ended December 10 at 211,000 versus the 232,000 expected while continuing claims remained unchanged. November’s industrial production continued to decline from October’s -0.1% to -0.2% month-over-month. Meanwhile, capacity utilization slightly eased to 79.7% from last month’s print of 79.9%.
Treasuries were mixed Thursday as recessionary fears mount following the Fed’s hawkish comments Wednesday. The yield on the benchmark 10-year note declined three basis points (0.03%) to 3.45%, while the 30-year bond yield dipped three basis points (0.03%) to 3.50%. The yield on the two-year note, which is more sensitive to changes in Fed policy, advanced two basis points (0.02%) to 4.24%. In commodities, West Texas Intermediate (WTI) crude declined 1.6% to $76.06/barrel after its three-day rally following reports the Keystone pipeline has resumed its operations after being closed for a week. Also pressuring prices, is the possibility of a global recession as major central banks around the world delivered another round of tightening.
|
 Kenneth J. Gruneisen started out as a licensed stockbroker in August 1987, a couple of months prior to the historic stock market crash that took the Dow Jones Industrial Average down -22.6% in a single day. He has published daily fact-based fundamental and technical analysis on high-ranked stocks online for two decades. Through FACTBASEDINVESTING.COM, Kenneth provides educational articles, news, market commentary, and other information regarding proven investment systems that work in good times and bad.
Comments contained in the body of this report are technical opinions only and are not necessarily those of Gruneisen Growth Corp. The material herein has been obtained from sources believed to be reliable and accurate, however, its accuracy and completeness cannot be guaranteed. Our firm, employees, and customers may effect transactions, including transactions contrary to any recommendation herein, or have positions in the securities mentioned herein or options with respect thereto. Any recommendation contained in this report may not be suitable for all investors and it is not to be deemed an offer or solicitation on our part with respect to the purchase or sale of any securities. |
|
 |
Financial, Retail, Tech, and Commodity-Linked Groups Fell
Kenneth J. Gruneisen - Passed the CAN SLIM® Master's Exam
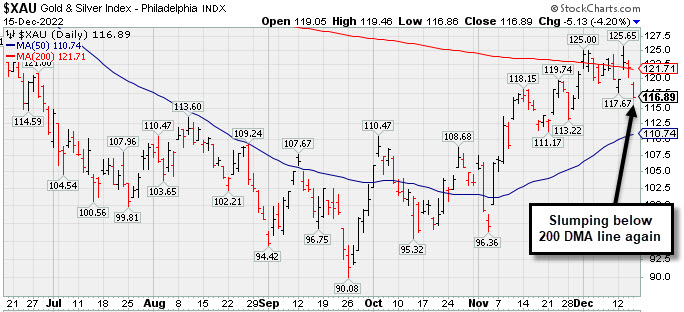
The Broker/Dealer Index ($XBD -2.71%), Bank Index ($BKX -1.88%), and Retail Index ($RLX -2.41%) suffered unanimous losses that weighed on the major indices. The Semiconductor Index ($SOX -4.17%) led the tech sector lower while the Networking Index ($NWX -3.26%) slumped and the Biotech Index ($BTK -1.75%) also lost ground. The Gold & Silver Index ($XAU -4.20%) was a standout decliner while the Oil Services Index ($OSX -0.96%) and Integrated Oil Index ($XOI -0.46%) both suffered smaller losses.
PICTURED: The Gold & Silver Index ($XAU -4.20%) is slumping below its 200-day moving average (DMA) line again.
| Oil Services |
$OSX |
79.72 |
-0.77 |
-0.96% |
+51.21% |
| Integrated Oil |
$XOI |
1,731.18 |
-7.95 |
-0.46% |
+46.93% |
| Semiconductor |
$SOX |
2,661.40 |
-115.86 |
-4.17% |
-32.56% |
| Networking |
$NWX |
797.35 |
-26.88 |
-3.26% |
-17.89% |
| Broker/Dealer |
$XBD |
447.27 |
-12.48 |
-2.71% |
-8.13% |
| Retail |
$RLX |
2,835.61 |
-70.05 |
-2.41% |
-32.91% |
| Gold & Silver |
$XAU |
116.89 |
-5.13 |
-4.20% |
-11.75% |
| Bank |
$BKX |
98.43 |
-1.89 |
-1.88% |
-25.55% |
| Biotech |
$BTK |
5,325.52 |
-94.98 |
-1.75% |
-3.50% |
|
|
|
 |
Violated 50-Day Moving Average After Recently Failing to Break Out
Kenneth J. Gruneisen - Passed the CAN SLIM® Master's Exam
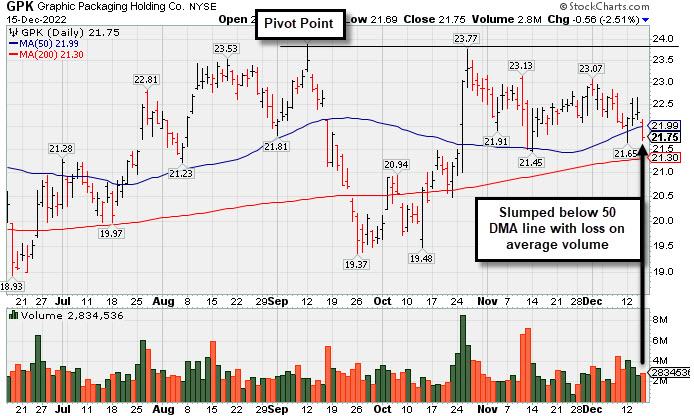
Graphic Packaging Hldg (GPK -$0.56 or -2.51% to $21.75) pulled back below its 50-day moving average (DMA) line ($22.09) with today's loss on near average volume raising concerns and triggering a technical sell signal, and its color code was changed to green. A prompt rebound above the 50 DMA line is needed for its outlook to improve. It faces resistance due to overhead supply up to the $24 level.
GPK was highlighted in yellow with pivot point cited based on its 9/12/22 high plus 10 cents in the 10/25/22 mid-day report (read here). GPK has a 99 Earnings Per Share Rating. It reported Sep '22 quarterly earnings +79% on +38% sales revenues versus the year ago period. It was last shown in this FSU section on 11/17/22 with an annotated graph under the headline, "Consolidating Above 50-Day Moving Average Still Perched Near High". Fundamentals have remained strong. The past 3 quarterly comparisons were well above the +25% minimum earnings guideline (C criteria). Its annual earnings history has been good since a downturn in FY '16 and '17, meeting the fact-based investment system's fundamental guidelines (A criteria).
The Paper & Paper Products group is ranked 107th on the 197 Industry Groups list and it has a C+ (46) Group Relative Strength Rating (L criteria). The number of top-rated funds owning its shares rose from 596 in Sep '21 to 666 in Sep '22, a reassuring sign concerning the I criteria. Its current Up/Down Volume Ratio of 1.1 is an unbiased indication its shares have been under distributional pressure over the past 50 days.
|
|
|
Color Codes Explained :
Y - Better candidates highlighted by our
staff of experts.
G - Previously featured
in past reports as yellow but may no longer be buyable under the
guidelines.
***Last / Change / Volume data in this table is the closing quote data***
Symbol/Exchange
Company Name
Industry Group |
PRICE |
CHANGE
(%Change) |
Day High |
Volume
(% DAV)
(% 50 day avg vol) |
52 Wk Hi
% From Hi |
Featured
Date |
Price
Featured |
Pivot Featured |
|
Max Buy |
 ESQ
-
NASDAQ
ESQ
-
NASDAQ
Esquire Financial Hldgs
Finance-Commercial Loans
|
$41.22
|
-0.46
-1.10% |
$41.65
|
12,164
45.05% of 50 DAV
50 DAV is 27,000
|
$48.13
-14.36%
|
10/18/2022
|
$40.02
|
PP = $39.95
|
|
MB = $41.95
|
 Most Recent Note - 12/15/2022 4:43:50 PM
G - Slumped further below its 50 DMA line with today's 3rd consecutive loss, testing prior highs in the $41 area defining important near-term support to watch.
>>> FEATURED STOCK ARTICLE : Pulled Back Following "Negative Reversal" at All-Time High - 11/25/2022 |
View all notes |
Set NEW NOTE alert |
Company Profile |
SEC
News |
Chart |
Request a new note
C
A
S
I |
CMC
-
NYSE
Commercial Metals Co
METALS and MINING - Steel and Iron
|
$47.46
|
-1.39
-2.85% |
$48.39
|
809,384
80.78% of 50 DAV
50 DAV is 1,002,000
|
$50.83
-6.63%
|
10/14/2022
|
$41.61
|
PP = $44.45
|
|
MB = $46.67
|
Most Recent Note - 12/15/2022 4:30:42 PM
G - Gapped down today for a loss with below average volume, pulling back toward its 50 DMA line ($45.74) and prior highs in the $46 area defining important near-term support to watch. Fundamentals remain strong.
>>> FEATURED STOCK ARTICLE : Wedging Higher With Recent Gains Lacking Great Volume - 12/2/2022 |
View all notes |
Set NEW NOTE alert |
Company Profile |
SEC
News |
Chart |
Request a new note
C
A
S
I |
VRTX
-
NASDAQ
Vertex Pharmaceuticals
Medical-Biomed/Biotech
|
$308.40
|
-3.69
-1.18% |
$312.40
|
1,008,792
68.72% of 50 DAV
50 DAV is 1,468,000
|
$324.75
-5.03%
|
10/24/2022
|
$308.47
|
PP = $306.05
|
|
MB = $321.35
|
Most Recent Note - 12/15/2022 4:58:25 PM
Y - Pulled back today with below average volume after wedging to new highs with light volume, testing support near its 50 DMA line ($307.71) and prior pivot point. Recently reported Sep '22 quarterly earnings +14% on +18% sales revenues versus the year ago period, below the +25% minimum earnings guideline raising fundamental concerns (C criteria).
>>> FEATURED STOCK ARTICLE : Testing Support Near 50-Day Moving Average Line and Prior Pivot - 12/13/2022 |
View all notes |
Set NEW NOTE alert |
Company Profile |
SEC
News |
Chart |
Request a new note
C
A
S
I |
GPK
-
NYSE
Graphic Packaging Hldg
CONSUMER NON-DURABLES - Packaging and Containers
|
$21.75
|
-0.56
-2.51% |
$22.15
|
2,836,076
96.60% of 50 DAV
50 DAV is 2,936,000
|
$24.07
-9.64%
|
10/25/2022
|
$22.75
|
PP = $24.17
|
|
MB = $25.38
|
Most Recent Note - 12/15/2022 5:31:26 PM
G - Pulled back below its 50-day moving average (DMA) line ($22.09) with today's loss on near average volume raising concerns and triggering a technical sell signal. Color code is changed to green. A prompt rebound above the 50 DMA line is needed for its outlook to improve Fundamentals remain strong. See the latest FSU analysis for more details and a new annotated graph.
>>> FEATURED STOCK ARTICLE : Violated 50-Day Moving Average After Recently Failing to Break Out - 12/15/2022 |
View all notes |
Set NEW NOTE alert |
Company Profile |
SEC
News |
Chart |
Request a new note
C
A
S
I |
CBZ
-
NYSE
C B I Z Inc
Comml Svcs-Consulting
|
$48.71
|
-1.26
-2.52% |
$49.71
|
251,617
96.78% of 50 DAV
50 DAV is 260,000
|
$51.67
-5.73%
|
10/26/2022
|
$47.83
|
PP = $48.57
|
|
MB = $51.00
|
Most Recent Note - 12/15/2022 4:23:26 PM
Y - Pulled back from its 52-week high today with a 2nd loss on below average volume. Its 50 DMA line ($47.71) and recent low define important near-term support. It has formed an orderly new 6-week flat base but a new pivot point was not cited because it has made little headway from the prior base and remains below the "max buy" level. Recently reported Sep '22 quarterly earnings +24% on +28% sales revenues versus the year ago period.
>>> FEATURED STOCK ARTICLE : Gapped Up and Rebounded Above Pivot Point - 11/18/2022 |
View all notes |
Set NEW NOTE alert |
Company Profile |
SEC
News |
Chart |
Request a new note
C
A
S
I |
Symbol/Exchange
Company Name
Industry Group |
PRICE |
CHANGE
(%Change) |
Day High |
Volume
(% DAV)
(% 50 day avg vol) |
52 Wk Hi
% From Hi |
Featured
Date |
Price
Featured |
Pivot Featured |
|
Max Buy |
ENPH
-
NASDAQ
Enphase Energy Inc
Energy-Solar
|
$314.06
|
-18.74
-5.63% |
$334.84
|
3,467,985
88.45% of 50 DAV
50 DAV is 3,921,000
|
$339.92
-7.61%
|
10/26/2022
|
$301.55
|
PP = $324.94
|
|
MB = $341.19
|
Most Recent Note - 12/15/2022 4:40:19 PM
Y - Pulled back today with below average volume while slumping back below its pivot point. Stalled after hitting a new all-time high on 12/02/22 with a volume-driven gain above its pivot point. Faces no resistance due to overhead supply. Its 50 DMA line ($292) defines near-term support to watch on pullbacks. Fundamentals remain strong.
>>> FEATURED STOCK ARTICLE : Perched Near High Still Awaiting Technical Breakout - 11/21/2022 |
View all notes |
Set NEW NOTE alert |
Company Profile |
SEC
News |
Chart |
Request a new note
C
A
S
I |
HRMY
-
NASDAQ
Harmony Biosciences Holdings
Medical-Biomed/Biotech
|
$56.13
|
-2.52
-4.30% |
$58.38
|
457,542
97.37% of 50 DAV
50 DAV is 469,900
|
$62.09
-9.60%
|
11/1/2022
|
$55.31
|
PP = $57.23
|
|
MB = $60.09
|
Most Recent Note - 12/15/2022 4:49:29 PM
Y - Suffered a 3rd consecutive loss today slumping below its pivot point raising concerns. Its 50 DMA line ($55.29) and 11/17/22 low ($53.06) define important near-term support to watch.
>>> FEATURED STOCK ARTICLE : Harmony Still Hovering Near All-Time High - 11/28/2022 |
View all notes |
Set NEW NOTE alert |
Company Profile |
SEC
News |
Chart |
Request a new note
C
A
S
I |
CLH
-
NYSE
Clean Harbors Inc
Pollution Control
|
$116.50
|
-2.26
-1.90% |
$118.24
|
316,681
78.39% of 50 DAV
50 DAV is 404,000
|
$125.41
-7.10%
|
11/2/2022
|
$121.59
|
PP = $124.59
|
|
MB = $130.82
|
Most Recent Note - 12/15/2022 4:25:31 PM
Y - Still consolidating below its pivot point and today's loss on light volume undercut its 50 DMA line ($117.33) nearly testing the recent low ($114.86 on 11/29/22) which defines important near-term support to watch. Fundamentals remain strong.
>>> FEATURED STOCK ARTICLE : Volume-Driven Losses Undercut 50-Day Moving Average - 11/29/2022 |
View all notes |
Set NEW NOTE alert |
Company Profile |
SEC
News |
Chart |
Request a new note
C
A
S
I |
NPO
-
NYSE
Enpro Industries Inc
Machinery-Gen Industrial
|
$106.15
|
-1.79
-1.66% |
$107.02
|
126,750
125.50% of 50 DAV
50 DAV is 101,000
|
$127.67
-16.86%
|
11/4/2022
|
$119.06
|
PP = $117.73
|
|
MB = $123.62
|
Most Recent Note - 12/15/2022 4:53:18 PM
G - Violated its 50 DMA line ($108.93) with damaging losses this week triggering a technical sell signal. A prompt rebound above the 50 DMA line is needed for its outlook to improve. Fundamentals remain strong.
>>> FEATURED STOCK ARTICLE : Consolidating Near Old Highs Following Recent Breakout - 12/1/2022 |
View all notes |
Set NEW NOTE alert |
Company Profile |
SEC
News |
Chart |
Request a new note
C
A
S
I |
DGII
-
NASDAQ
Digi International Inc
COMPUTER HARDWARE - Networking and Communication Dev
|
$39.16
|
-0.41
-1.04% |
$40.05
|
440,734
120.09% of 50 DAV
50 DAV is 367,000
|
$43.68
-10.35%
|
11/10/2022
|
$41.82
|
PP = $40.96
|
|
MB = $43.01
|
Most Recent Note - 12/15/2022 4:38:46 PM
Y - Pulled back today with above average volume testing near its 50 DMA line ($38.86) defining important near-term support to watch. More damaging losses would raise concerns and trigger a technical sell signal. Fundamentals remain strong.
>>> FEATURED STOCK ARTICLE : Sputtering After Recently Wedging to New Highs - 12/6/2022 |
View all notes |
Set NEW NOTE alert |
Company Profile |
SEC
News |
Chart |
Request a new note
C
A
S
I |
Symbol/Exchange
Company Name
Industry Group |
PRICE |
CHANGE
(%Change) |
Day High |
Volume
(% DAV)
(% 50 day avg vol) |
52 Wk Hi
% From Hi |
Featured
Date |
Price
Featured |
Pivot Featured |
|
Max Buy |
GFF
-
NYSE
Griffon Corporation
MATERIALS and CONSTRUCTION - General Building Materials
|
$34.83
|
-1.16
-3.22% |
$35.54
|
357,818
98.03% of 50 DAV
50 DAV is 365,000
|
$37.69
-7.59%
|
11/10/2022
|
$34.13
|
PP = $35.02
|
|
MB = $36.77
|
Most Recent Note - 12/15/2022 4:46:11 PM
Y - Pulled back from its 52-week high with today's 2nd consecutive loss. Recently consolidating near prior highs in the $34 area which define initial support to watch above its 50 DMA line ($33.12). Reported Sep '22 quarterly earnings +230% on +24% sales revenues versus the year ago period.
>>> FEATURED STOCK ARTICLE : No Meaningful Progress After Breakout 3 Weeks Ago - 12/7/2022 |
View all notes |
Set NEW NOTE alert |
Company Profile |
SEC
News |
Chart |
Request a new note
C
A
S
I |
ANET
-
NYSE
Arista Networks Inc
Computer-Networking
|
$125.58
|
-5.41
-4.13% |
$129.53
|
2,546,612
104.58% of 50 DAV
50 DAV is 2,435,000
|
$148.57
-15.47%
|
11/14/2022
|
$132.05
|
PP = $133.70
|
|
MB = $140.39
|
Most Recent Note - 12/15/2022 4:19:40 PM
Y - Pulled back today nearly testing its 50-day moving average (DMA) line ($123.70) and prior low defining near-term support to watch. More damaging losses would raise concerns. Subsequent gains and a close above the pivot point must be backed by at least +40% above average volume to trigger a proper technical buy signal. Faces some resistance due to overhead supply up to the $148 level. Fundamentals are strong.
>>> FEATURED STOCK ARTICLE : Sputtered Back Below Prior High Hurting Outlook - 12/9/2022 |
View all notes |
Set NEW NOTE alert |
Company Profile |
SEC
News |
Chart |
Request a new note
C
A
S
I |
CPRX
-
NASDAQ
Catalyst Pharma Inc
Medical-Biomed/Biotech
|
$16.84
|
-0.87
-4.91% |
$17.58
|
2,423,656
109.62% of 50 DAV
50 DAV is 2,211,000
|
$18.39
-8.43%
|
11/22/2022
|
$17.38
|
PP = $16.66
|
|
MB = $17.49
|
Most Recent Note - 12/15/2022 4:33:28 PM
Y - Pulled back today for a 2nd loss on average volume slumping near its pivot point. Recently consolidating near the prior high and well above its 50 DMA line ($14.98).
>>> FEATURED STOCK ARTICLE : Breakout From Cup-With-Handle With 90% Above Average Volume - 11/22/2022 |
View all notes |
Set NEW NOTE alert |
Company Profile |
SEC
News |
Chart |
Request a new note
C
A
S
I |
TITN
-
NASDAQ
Titan Machinery Inc
SPECIALTY RETAIL
|
$38.54
|
-2.40
-5.86% |
$40.66
|
249,807
130.11% of 50 DAV
50 DAV is 192,000
|
$44.35
-13.10%
|
11/30/2022
|
$40.10
|
PP = $38.68
|
|
MB = $40.61
|
Most Recent Note - 12/15/2022 4:56:40 PM
Y - Suffered a big loss today consolidating near the prior high in the $38 area which defines initial support to watch. Fundamentals remain strong after reporting Oct '22 quarterly earnings +91% on +47% sales revenues.
>>> FEATURED STOCK ARTICLE : Gap Up and Big Volume-Driven Breakout Gain - 11/30/2022 |
View all notes |
Set NEW NOTE alert |
Company Profile |
SEC
News |
Chart |
Request a new note
C
A
S
I |
MYE
-
NYSE
Myers Industries Inc
Containers/Packaging
|
$22.81
|
-0.49
-2.10% |
$23.24
|
305,850
237.09% of 50 DAV
50 DAV is 129,000
|
$25.55
-10.72%
|
12/8/2022
|
$23.94
|
PP = $25.65
|
|
MB = $26.93
|
Most Recent Note - 12/15/2022 4:52:05 PM
Y - Pulled back today for a 2nd consecutive loss with above average volume. Highlighted in yellow with pivot point cited based on its 6/06/22 high plus 10 cents in the 12/08/22 mid-day report. Subsequent gains above the pivot point backed by at least +40% above average volume may trigger a technical buy signal. The Sep '22 quarter showed +78% earnings on +14% sales revenues versus the year ago period. The past 4 quarterly comparisons were above the +25% minimum guideline (C criteria), however, its sales revenues growth rate has shown deceleration in sequential comparisons +45%, +29%, +24%, to +14%. Annual earnings (A criteria) history had a slight downturn in FY '19 but growth has been otherwise strong and steady.
>>> FEATURED STOCK ARTICLE : Myers Industries on Track for 9th Straight Weekly Gain - 12/8/2022 |
View all notes |
Set NEW NOTE alert |
Company Profile |
SEC
News |
Chart |
Request a new note
C
A
S
I |
Symbol/Exchange
Company Name
Industry Group |
PRICE |
CHANGE
(%Change) |
Day High |
Volume
(% DAV)
(% 50 day avg vol) |
52 Wk Hi
% From Hi |
Featured
Date |
Price
Featured |
Pivot Featured |
|
Max Buy |
BOX
-
NYSE
Box Inc Cl A
Computer Sftwr-Database
|
$31.06
|
-0.63
-1.99% |
$31.64
|
2,253,020
205.38% of 50 DAV
50 DAV is 1,097,000
|
$33.04
-5.99%
|
12/12/2022
|
$29.83
|
PP = $29.57
|
|
MB = $31.05
|
Most Recent Note - 12/15/2022 4:20:55 PM
G - Pulled back today following 3 consecutive volume-driven gains, consolidating near its "max buy" level. Faces some additional resistance due to overhead supply up to the $33 level. Quarterly and annual earnings increases have been strong and steady.
>>> FEATURED STOCK ARTICLE : Volume Heavy Behind Breakout for Box Inc - 12/12/2022 |
View all notes |
Set NEW NOTE alert |
Company Profile |
SEC
News |
Chart |
Request a new note
C
A
S
I |
STRL
-
NASDAQ
Sterling Infrastructure
MATERIALS and; CONSTRUCTION - Heavy Construction
|
$31.03
|
-0.86
-2.70% |
$31.70
|
166,494
91.99% of 50 DAV
50 DAV is 181,000
|
$33.62
-7.70%
|
12/14/2022
|
$32.41
|
PP = $33.72
|
|
MB = $35.41
|
Most Recent Note - 12/15/2022 4:55:05 PM
Y - Pulled back today for a 2nd loss with lighter volume. Highlighted in yellow with pivot point cited based on its 11/08/22 high plus 10 cents in the 12/14/22 mid-day report. Consolidating for about 5 weeks in a tight range near its all-time high with volume totals cooling. Faces very little resistance due to overhead supply. Subsequent gains above the pivot point backed by at least +40% above average volume are needed to trigger a proper technical buy signal. Reported Sep '22 quarterly earnings +35% on +20% sales revenues versus the year ago period, its 5th quarterly comparison at or above the +25% minimum earnings guideline (C criteria). After years of losses it has shown improving annual earnings (A criteria) since FY '17.
>>> FEATURED STOCK ARTICLE : Sterling Infrastructure Forming Orderly Base Pattern - 12/14/2022 |
View all notes |
Set NEW NOTE alert |
Company Profile |
SEC
News |
Chart |
Request a new note
C
A
S
I |
|
|
|
THESE ARE NOT BUY RECOMMENDATIONS!
Comments contained in the body of this report are technical
opinions only. The material herein has been obtained
from sources believed to be reliable and accurate, however,
its accuracy and completeness cannot be guaranteed.
This site is not an investment advisor, hence it does
not endorse or recommend any securities or other investments.
Any recommendation contained in this report may not
be suitable for all investors and it is not to be deemed
an offer or solicitation on our part with respect to
the purchase or sale of any securities. All trademarks,
service marks and trade names appearing in this report
are the property of their respective owners, and are
likewise used for identification purposes only.
This report is a service available
only to active Paid Premium Members.
You may opt-out of receiving report notifications
at any time. Questions or comments may be submitted
by writing to Premium Membership Services 665 S.E. 10 Street, Suite 201 Deerfield Beach, FL 33441-5634 or by calling 1-800-965-8307
or 954-785-1121.
|
|
|