You are not logged in.
This means you
CAN ONLY VIEW reports that were published prior to Tuesday, March 25, 2025.
You
MUST UPGRADE YOUR MEMBERSHIP if you want to see any current reports.
AFTER MARKET UPDATE - TUESDAY, NOVEMBER 29TH, 2022
Previous After Market Report Next After Market Report >>>
|
|
|
|
DOW |
+3.07 |
33,852.53 |
+0.01% |
|
Volume |
790,014,303 |
-4% |
|
Volume |
4,536,429,800 |
+8% |
|
NASDAQ |
-65.72 |
10,983.78 |
-0.59% |
|
Advancers |
1,744 |
57% |
|
Advancers |
2,206 |
49% |
|
S&P 500 |
-6.31 |
3,957.63 |
-0.16% |
|
Decliners |
1,328 |
43% |
|
Decliners |
2,337 |
51% |
|
Russell 2000 |
+5.59 |
1,836.55 |
+0.31% |
|
52 Wk Highs |
46 |
|
|
52 Wk Highs |
85 |
|
|
S&P 600 |
+4.81 |
1,213.64 |
+0.40% |
|
52 Wk Lows |
68 |
|
|
52 Wk Lows |
188 |
|
|
 |
Major Indices Ended Mixed as Leadership Thinned
Kenneth J. Gruneisen - Passed the CAN SLIM® Master's Exam
The Dow added 3 points, while the Nasdaq Composite decreased 0.6%. The S&P 500 declined 0.2%. Volume totals were mixed, lighter than the prior session on the NYSE and higher on the Nasdaq exchange. Advancers led decliners by a 9-7 margin on the NYSE but decliners narrowly outnumbered advancers on the Nasdaq exchange. There were 10 high-ranked companies from the Leaders List that hit new 52-week highs and were listed on the BreakOuts Page, versus the total of 16 on the prior session. New 52-week lows outnumbered new 52-week highs on the NYSE and on the Nasdaq exchange. The market is in a confirmed uptrend (M criteria). Healthy leadership (new 52-week highs totals) must continue for the rally be more productive. Only stocks meeting all key-criteria of the fact-based investment system should be considered as buy candidates.
Chart courtesy of www.stockcharts.com PICTURED: The Dow Jones Industrial Average has paused after trading above its August high. Of the 3 major indices only the Dow is in "healthy shape" above its 200 DMA line.
U.S. equities finished mixed Tuesday as investors struggled to recover from Monday’s losses and are looking ahead to Federal Reserve (Fed) President Jerome Powell’s speech Wednesday afternoon. Powell’s speech is expected to give insight into whether the central bank will slow down its interest rate hikes as market participants continue to look towards the future. Six of the 11 sectors in the S&P 500 finished in negative territory with Information Technology leading laggards.
On the data front, September’s Federal Housing Finance Agency’s (FHFA) House Price Index came in hotter-than-expected at 0.1%, up from August’s -0.7%. Meanwhile, September’s S&P CoreLogic Case Shiller 20-City Home Price index decreased 1.2% month-over-month and increased 10.4% annually, a smaller increase than anticipated. Finally, November’s Conference Board Consumer Confidence Index moved 2.3 points lower from October’s print to 100.2 signaling elevated recession risk.
Treasury yields finished higher Tuesday, after the Fed signaled higher interest rates are not going anywhere. The yield on the benchmark 10-year note increased eight basis points (0.08%) to 3.76%, while the 30-year bond yield added eight basis points (0.08%) to 3.81%. The yield on the two-year note gained three basis points (0.03%) to 4.48%. In commodities, West Texas Intermediate (WTI) crude gained 1.5% to $78.42/barrel as investor’s grow optimistic that China’s strict COVID-19 policy may loosen in the near future. However, gains were slightly hampered as the Organization of the Petroleum Exporting Countries and allies (OPEC+) announced they will not adjust their output plans at the December 4 meeting.
|
 Kenneth J. Gruneisen started out as a licensed stockbroker in August 1987, a couple of months prior to the historic stock market crash that took the Dow Jones Industrial Average down -22.6% in a single day. He has published daily fact-based fundamental and technical analysis on high-ranked stocks online for two decades. Through FACTBASEDINVESTING.COM, Kenneth provides educational articles, news, market commentary, and other information regarding proven investment systems that work in good times and bad.
Comments contained in the body of this report are technical opinions only and are not necessarily those of Gruneisen Growth Corp. The material herein has been obtained from sources believed to be reliable and accurate, however, its accuracy and completeness cannot be guaranteed. Our firm, employees, and customers may effect transactions, including transactions contrary to any recommendation herein, or have positions in the securities mentioned herein or options with respect thereto. Any recommendation contained in this report may not be suitable for all investors and it is not to be deemed an offer or solicitation on our part with respect to the purchase or sale of any securities. |
|
 |
Commodity-Linked Groups and Financial Indexes Rose
Kenneth J. Gruneisen - Passed the CAN SLIM® Master's Exam
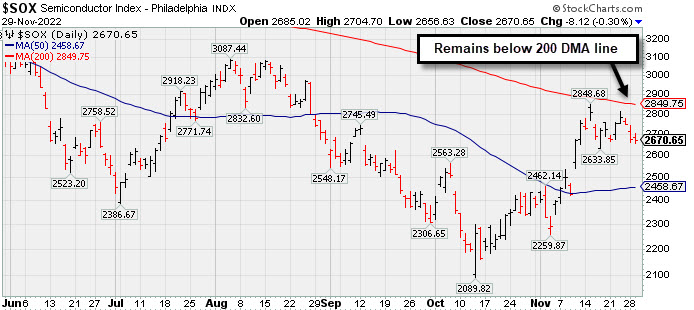
The Bank Index ($BKX +1.16%) and Broker/Dealer Index ($XBD +0.86%) both posted influential gains but the Retail Index ($RLX -0.95%) created a drag on the major indices. Commodity-linked groups had a positive bias as the Gold & Silver Index ($XAU +2.86%), Oil Services Index ($OSX +2.60%), and Integrated Oil Index ($XOI +1.49%) each posted solid gains. Meanwhile, the Biotech Index ($BTK -0.72%) led the tech sector lower while the Semiconductor Index ($SOX -0.30%) suffered a smaller loss and the Networking Index ($NWX -0.07%) was nearly unchanged.
PICTURED: The Semiconductor Index ($SOX -0.30%) remains below its 200-day moving average (DMA) line.
| Oil Services |
$OSX |
82.62 |
+2.09 |
+2.60% |
+56.72% |
| Integrated Oil |
$XOI |
1,867.73 |
+27.43 |
+1.49% |
+58.52% |
| Semiconductor |
$SOX |
2,670.65 |
-8.13 |
-0.30% |
-32.32% |
| Networking |
$NWX |
806.91 |
-0.57 |
-0.07% |
-16.91% |
| Broker/Dealer |
$XBD |
473.09 |
+4.01 |
+0.86% |
-2.83% |
| Retail |
$RLX |
2,904.42 |
-27.72 |
-0.95% |
-31.28% |
| Gold & Silver |
$XAU |
116.59 |
+3.24 |
+2.86% |
-11.97% |
| Bank |
$BKX |
106.76 |
+1.22 |
+1.16% |
-19.26% |
| Biotech |
$BTK |
5,143.79 |
-37.15 |
-0.72% |
-6.79% |
|
|
|
 |
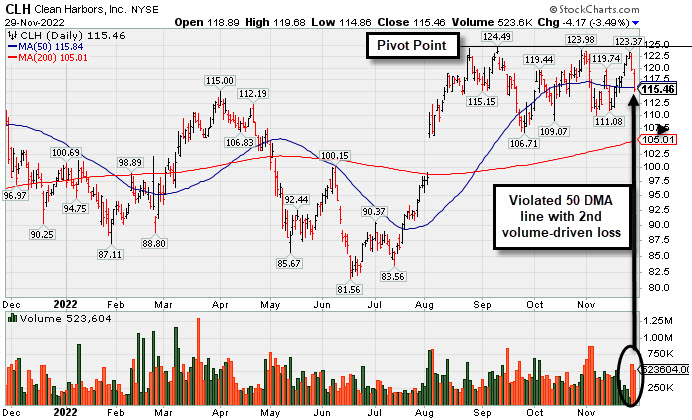
Volume-Driven Losses Undercut 50-Day Moving Average
Kenneth J. Gruneisen - Passed the CAN SLIM® Master's Exam
Clean Harbors Inc (CLH -$4.17 or -3.49% to $115.46) suffered a 2nd consecutive loss with above average volume and violated its 50-day moving average (DMA) line ($115.84) triggering a technical sell signal. Only a prompt rebound above the 50 DMA line would help its outlook improve. A streak of 8 consecutive gains helped it approach its prior highs and pivot point, but it again failed to break out and trigger a technical buy signal.
CLH was last shown in greater detail on 11/02/22 with an annotated graph under the headline, "Testing 50 Day Moving Average Line After Forming New Base". Fundamentals remain strong after reporting Sep '22 quarterly earnings +113% on +43% sales revenues versus the year ago period. CLH was highlighted in yellow with pivot point cited based on its 9/12/22 high plus 10 cents in the 11/02/22 mid-day report (read here). It has a highest possible Earnings Per Share Rating of 99.Prior quarters showed a strong earnings track record with earnings above the +25% minimum guideline (C criteria). Annual earnings (A criteria) growth has been strong and steady.
There are only 54.1 million shares outstanding (S criteria), which can contribute to greater price volatility in the event of institutional buying or selling. The number of top-rated funds owning its shares rose from 590 in Sep '21 to 652 in Sep '22, a reassuring sign concerning the I criteria. The current Up/Down Volume Ratio of 0.8 is an unbiased indication its shares have been under distributional pressure over the past 50 days. It has a Timeliness Rating of A and a Sponsorship rating of B, but an Accumulation Distribution Rating of D.
|
|
|
Color Codes Explained :
Y - Better candidates highlighted by our
staff of experts.
G - Previously featured
in past reports as yellow but may no longer be buyable under the
guidelines.
***Last / Change / Volume data in this table is the closing quote data***
Symbol/Exchange
Company Name
Industry Group |
PRICE |
CHANGE
(%Change) |
Day High |
Volume
(% DAV)
(% 50 day avg vol) |
52 Wk Hi
% From Hi |
Featured
Date |
Price
Featured |
Pivot Featured |
|
Max Buy |
 ESQ
-
NASDAQ
ESQ
-
NASDAQ
Esquire Financial Hldgs
Finance-Commercial Loans
|
$43.26
|
-0.27
-0.62% |
$43.63
|
14,729
52.60% of 50 DAV
50 DAV is 28,000
|
$48.13
-10.12%
|
10/18/2022
|
$40.02
|
PP = $39.95
|
|
MB = $41.95
|
Most Recent Note - 11/28/2022 9:04:27 PM
G - Suffered a 3rd consecutive loss today after a "negative reversal" on 11/23/22 with above average volume. Prior highs and its 50 DMA line coincide in the $41 area defining important near-term support to watch on pullbacks.
>>> FEATURED STOCK ARTICLE : Pulled Back Following "Negative Reversal" at All-Time High - 11/25/2022 |
View all notes |
Set NEW NOTE alert |
Company Profile |
SEC
News |
Chart |
Request a new note
C
A
S
I |
CCRN
-
NASDAQ
Cross Country Healthcare
DIVERSIFIED SERVICES - Staffing and Outsourcing Service
|
$35.30
|
-0.26
-0.73% |
$35.99
|
408,055
49.16% of 50 DAV
50 DAV is 830,000
|
$40.12
-12.01%
|
9/9/2022
|
$27.32
|
PP = $30.61
|
|
MB = $32.14
|
 Most Recent Note - 11/29/2022 8:32:08 AM
G - It has not formed a new base of sufficient length but has been consolidating above its 50 DMA line ($32.99) and its color code is changed to green while trading above its "max buy" level. Reported Sep '22 quarterly earnings +75% on +70% sales revenues versus the year ago period.
>>> FEATURED STOCK ARTICLE : Consolidating Above Prior Highs and Above 50-Day Moving Average - 11/8/2022 |
View all notes |
Set NEW NOTE alert |
Company Profile |
SEC
News |
Chart |
Request a new note
C
A
S
I |
CMC
-
NYSE
Commercial Metals Co
METALS and MINING - Steel and Iron
|
$48.38
|
+0.67
1.40% |
$48.47
|
532,189
53.38% of 50 DAV
50 DAV is 997,000
|
$49.41
-2.08%
|
10/14/2022
|
$41.61
|
PP = $44.45
|
|
MB = $46.67
|
Most Recent Note - 11/28/2022 9:10:16 PM
G - Pulled back for a 3rd consecutive small loss today with below average volume. Fundamentals remain strong. Prior high in the $44 area defines initial support to watch above its 50 DMA line ($42.67).
>>> FEATURED STOCK ARTICLE : Steel/Metal Products Firm Quietly Perched Near All Time High - 11/7/2022 |
View all notes |
Set NEW NOTE alert |
Company Profile |
SEC
News |
Chart |
Request a new note
C
A
S
I |
VRTX
-
NASDAQ
Vertex Pharmaceuticals
Medical-Biomed/Biotech
|
$316.33
|
+1.03
0.33% |
$317.21
|
1,380,280
97.62% of 50 DAV
50 DAV is 1,414,000
|
$323.61
-2.25%
|
10/24/2022
|
$308.47
|
PP = $306.05
|
|
MB = $321.35
|
Most Recent Note - 11/25/2022 2:55:05 PM
Y - Pulled back for a 2nd consecutive loss today with lighter volume. Its 50 DMA line ($300.44) defines near-term support above recent intra-day lows in the $287-288 area. Recently reported Sep '22 quarterly earnings +14% on +18% sales revenues versus the year ago period, below the +25% minimum earnings guideline raising fundamental concerns (C criteria). Annual earnings (A criteria) history has been strong.
>>> FEATURED STOCK ARTICLE : Made Little Progress Following Breakout and Latest Earnings News - 11/16/2022 |
View all notes |
Set NEW NOTE alert |
Company Profile |
SEC
News |
Chart |
Request a new note
C
A
S
I |
GPK
-
NYSE
Graphic Packaging Hldg
CONSUMER NON-DURABLES - Packaging and Containers
|
$22.75
|
+0.41
1.84% |
$22.77
|
2,762,685
95.02% of 50 DAV
50 DAV is 2,907,500
|
$24.07
-5.48%
|
10/25/2022
|
$22.75
|
PP = $24.17
|
|
MB = $25.38
|
Most Recent Note - 11/28/2022 9:07:39 PM
Y - Pulled back for a quiet loss today. Volume totals are cooling while consolidating above its 50 DMA line ($21.56). More damaging losses would raise concerns and trigger a technical sell signal. Subsequent gains above the pivot point backed by at least +40% above average volume may trigger a technical buy signal. Fundamentals remain strong.
>>> FEATURED STOCK ARTICLE : Consolidating Above 50-Day Moving Average Still Perched Near High - 11/17/2022 |
View all notes |
Set NEW NOTE alert |
Company Profile |
SEC
News |
Chart |
Request a new note
C
A
S
I |
Symbol/Exchange
Company Name
Industry Group |
PRICE |
CHANGE
(%Change) |
Day High |
Volume
(% DAV)
(% 50 day avg vol) |
52 Wk Hi
% From Hi |
Featured
Date |
Price
Featured |
Pivot Featured |
|
Max Buy |
CBZ
-
NYSE
C B I Z Inc
Comml Svcs-Consulting
|
$48.84
|
-0.29
-0.59% |
$49.34
|
132,465
49.24% of 50 DAV
50 DAV is 269,000
|
$50.57
-3.42%
|
10/26/2022
|
$47.83
|
PP = $48.57
|
|
MB = $51.00
|
Most Recent Note - 11/25/2022 2:49:22 PM
Y - Posted a small gain with light volume today as it inched further above its pivot point and challenged its 52-week high. Its 50 DMA line ($46.27) and recent low define important near-term support. Recently reported Sep '22 quarterly earnings +24% on +28% sales revenues versus the year ago period.
>>> FEATURED STOCK ARTICLE : Gapped Up and Rebounded Above Pivot Point - 11/18/2022 |
View all notes |
Set NEW NOTE alert |
Company Profile |
SEC
News |
Chart |
Request a new note
C
A
S
I |
ENPH
-
NASDAQ
Enphase Energy Inc
Energy-Solar
|
$303.39
|
-8.82
-2.83% |
$315.74
|
2,371,480
59.98% of 50 DAV
50 DAV is 3,954,000
|
$324.84
-6.60%
|
10/26/2022
|
$301.55
|
PP = $324.94
|
|
MB = $341.19
|
Most Recent Note - 11/29/2022 5:12:33 PM
Y - Pulled back today for a 2nd loss with below average volume, yet still perched within striking distance of its pivot point. Faces no resistance due to overhead supply. Its 50 DMA line ($283) defines near-term support above the recent low ($262.60 on 11/07/22). Fundamentals remain strong.
>>> FEATURED STOCK ARTICLE : Perched Near High Still Awaiting Technical Breakout - 11/21/2022 |
View all notes |
Set NEW NOTE alert |
Company Profile |
SEC
News |
Chart |
Request a new note
C
A
S
I |
HRMY
-
NASDAQ
Harmony Biosciences Holdings
Medical-Biomed/Biotech
|
$57.44
|
-0.45
-0.78% |
$58.41
|
223,859
47.76% of 50 DAV
50 DAV is 468,700
|
$61.55
-6.68%
|
11/1/2022
|
$55.31
|
PP = $57.23
|
|
MB = $60.09
|
Most Recent Note - 11/28/2022 8:58:37 PM
Y - Still hovering near its all-time high. The 11/17/22 low ($53.06) defines initial support to watch above its 50 DMA line ($51.33). See the latest FSU analysis for more details and a new annotated graph.
>>> FEATURED STOCK ARTICLE : Harmony Still Hovering Near All-Time High - 11/28/2022 |
View all notes |
Set NEW NOTE alert |
Company Profile |
SEC
News |
Chart |
Request a new note
C
A
S
I |
CLH
-
NYSE
Clean Harbors Inc
Pollution Control
|
$115.46
|
-4.17
-3.49% |
$119.68
|
523,604
122.62% of 50 DAV
50 DAV is 427,000
|
$124.49
-7.25%
|
11/2/2022
|
$121.59
|
PP = $124.59
|
|
MB = $130.82
|
Most Recent Note - 11/29/2022 5:09:11 PM
G - Today's 2nd consecutive volume-driven loss violated its 50 DMA line raising concerns and triggering a technical sell signal. Color code is changed to green. Only a prompt rebound above the 50 DMA line would help its outlook improve. Fundamentals remain strong. See the latest FSU analysis for more details and a new annotated graph.
>>> FEATURED STOCK ARTICLE : Volume-Driven Losses Undercut 50-Day Moving Average - 11/29/2022 |
View all notes |
Set NEW NOTE alert |
Company Profile |
SEC
News |
Chart |
Request a new note
C
A
S
I |
NPO
-
NYSE
Enpro Industries Inc
Machinery-Gen Industrial
|
$115.07
|
-0.87
-0.75% |
$116.00
|
60,634
61.25% of 50 DAV
50 DAV is 99,000
|
$127.67
-9.87%
|
11/4/2022
|
$119.06
|
PP = $117.73
|
|
MB = $123.62
|
Most Recent Note - 11/25/2022 2:53:48 PM
Y - Volume totals have been cooling while stubbornly holding its ground above the pivot point cited. Fundamentals remain strong.
>>> FEATURED STOCK ARTICLE : Finished Strong After Highlighted in Friday Mid-Day Report - 11/4/2022 |
View all notes |
Set NEW NOTE alert |
Company Profile |
SEC
News |
Chart |
Request a new note
C
A
S
I |
Symbol/Exchange
Company Name
Industry Group |
PRICE |
CHANGE
(%Change) |
Day High |
Volume
(% DAV)
(% 50 day avg vol) |
52 Wk Hi
% From Hi |
Featured
Date |
Price
Featured |
Pivot Featured |
|
Max Buy |
DGII
-
NASDAQ
Digi International Inc
COMPUTER HARDWARE - Networking and Communication Dev
|
$40.66
|
-0.35
-0.85% |
$41.19
|
295,172
74.35% of 50 DAV
50 DAV is 397,000
|
$43.68
-6.91%
|
11/10/2022
|
$41.82
|
PP = $40.96
|
|
MB = $43.01
|
Most Recent Note - 11/25/2022 2:57:40 PM
Y - Volume totals have been cooling while stubbornly holding its ground at its all-time high. Recently wedged above the pivot point cited based on its 10/31/22 high plus 10 cents after forming an advanced "ascending base" pattern. Subsequent gains above the pivot point backed by at least +40% above average volume are needed to confirm a proper technical buy signal. Fundamentals remain strong.
>>> FEATURED STOCK ARTICLE : Finish Below Pivot Point Leaves Disciplined Investors Waiting - 11/10/2022 |
View all notes |
Set NEW NOTE alert |
Company Profile |
SEC
News |
Chart |
Request a new note
C
A
S
I |
GFF
-
NYSE
Griffon Corporation
MATERIALS and CONSTRUCTION - General Building Materials
|
$35.12
|
+0.12
0.34% |
$36.00
|
432,740
119.21% of 50 DAV
50 DAV is 363,000
|
$36.75
-4.44%
|
11/10/2022
|
$34.13
|
PP = $35.02
|
|
MB = $36.77
|
Most Recent Note - 11/28/2022 9:06:25 PM
Y - Pulled back from its 52-week high with today's loss backed by above average volume. Prior highs in the $34 area define initial support to watch above its 50 DMA line ($31.81). Reported Sep '22 quarterly earnings +230% on +24% sales revenues versus the year ago period.
>>> FEATURED STOCK ARTICLE : Griffon Perched Near 52-Week High After 9-Week Base - 11/11/2022 |
View all notes |
Set NEW NOTE alert |
Company Profile |
SEC
News |
Chart |
Request a new note
C
A
S
I |
ANET
-
NYSE
Arista Networks Inc
Computer-Networking
|
$133.71
|
+0.01
0.01% |
$134.47
|
1,109,823
47.67% of 50 DAV
50 DAV is 2,328,000
|
$148.57
-10.00%
|
11/14/2022
|
$132.05
|
PP = $133.70
|
|
MB = $140.39
|
Most Recent Note - 11/25/2022 2:47:36 PM
Y - Held its ground stubbornly as it wedged higher after a cup-with-handle base. Subsequent gains and a close above the pivot point backed by at least +40% above average volume are needed to trigger a proper technical buy signal. Faces some resistance due to overhead supply up to the $148 level. Fundamentals are strong.
>>> FEATURED STOCK ARTICLE : Finished in Middle of Intra-Day Range After Challenging Pivot Point - 11/14/2022 |
View all notes |
Set NEW NOTE alert |
Company Profile |
SEC
News |
Chart |
Request a new note
C
A
S
I |
CPRX
-
NASDAQ
Catalyst Pharma Inc
Medical-Biomed/Biotech
|
$16.27
|
-0.22
-1.33% |
$16.92
|
2,552,473
108.89% of 50 DAV
50 DAV is 2,344,000
|
$18.39
-11.53%
|
11/22/2022
|
$17.38
|
PP = $16.66
|
|
MB = $17.49
|
Most Recent Note - 11/28/2022 12:25:30 PM
Y - Perched at its all-time high today. Rallied from a 9-week cup-with-handle base with a big gain backed above average volume noted. Reported Sep '22 quarterly earnings +86% on +59% sales revenues versus the year ago period. Disciplined investors avoid chasing stocks that are extended more than +5% above prior highs or the "max buy" level.
>>> FEATURED STOCK ARTICLE : Breakout From Cup-With-Handle With 90% Above Average Volume - 11/22/2022 |
View all notes |
Set NEW NOTE alert |
Company Profile |
SEC
News |
Chart |
Request a new note
C
A
S
I |
CLFD
-
NASDAQ
Clearfield Inc
TELECOMMUNICATIONS - Cables / Satalite Equipment
|
$123.88
|
+2.66
2.19% |
$124.03
|
234,468
82.85% of 50 DAV
50 DAV is 283,000
|
$134.90
-8.17%
|
11/23/2022
|
$131.27
|
PP = $130.11
|
|
MB = $136.62
|
Most Recent Note - 11/29/2022 5:11:07 PM
Y - Posted a gain today with lighter volume. Color code was changed to yellow with pivot point cited based on its 8/25/22 high plus 10 cents. A gain and close above the pivot point backed by at least +40% above average volume may trigger a new technical buy signal.
>>> FEATURED STOCK ARTICLE : Hit New High But Encountered Distributional Pressure - 11/23/2022 |
View all notes |
Set NEW NOTE alert |
Company Profile |
SEC
News |
Chart |
Request a new note
C
A
S
I |
Symbol/Exchange
Company Name
Industry Group |
PRICE |
CHANGE
(%Change) |
Day High |
Volume
(% DAV)
(% 50 day avg vol) |
52 Wk Hi
% From Hi |
Featured
Date |
Price
Featured |
Pivot Featured |
|
Max Buy |
|
|
|
THESE ARE NOT BUY RECOMMENDATIONS!
Comments contained in the body of this report are technical
opinions only. The material herein has been obtained
from sources believed to be reliable and accurate, however,
its accuracy and completeness cannot be guaranteed.
This site is not an investment advisor, hence it does
not endorse or recommend any securities or other investments.
Any recommendation contained in this report may not
be suitable for all investors and it is not to be deemed
an offer or solicitation on our part with respect to
the purchase or sale of any securities. All trademarks,
service marks and trade names appearing in this report
are the property of their respective owners, and are
likewise used for identification purposes only.
This report is a service available
only to active Paid Premium Members.
You may opt-out of receiving report notifications
at any time. Questions or comments may be submitted
by writing to Premium Membership Services 665 S.E. 10 Street, Suite 201 Deerfield Beach, FL 33441-5634 or by calling 1-800-965-8307
or 954-785-1121.
|
|
|