You are not logged in.
This means you
CAN ONLY VIEW reports that were published prior to Monday, March 24, 2025.
You
MUST UPGRADE YOUR MEMBERSHIP if you want to see any current reports.
AFTER MARKET UPDATE - THURSDAY, NOVEMBER 17TH, 2022
Previous After Market Report Next After Market Report >>>
|
|
|
|
DOW |
-7.51 |
33,546.32 |
-0.02% |
|
Volume |
839,911,020 |
-3% |
|
Volume |
4,301,097,400 |
-5% |
|
NASDAQ |
-38.70 |
11,144.96 |
-0.35% |
|
Advancers |
1,080 |
36% |
|
Advancers |
1,752 |
38% |
|
S&P 500 |
-12.23 |
3,946.56 |
-0.31% |
|
Decliners |
1,949 |
64% |
|
Decliners |
2,880 |
62% |
|
Russell 2000 |
-14.04 |
1,839.12 |
-0.76% |
|
52 Wk Highs |
34 |
|
|
52 Wk Highs |
63 |
|
|
S&P 600 |
-4.07 |
1,210.36 |
-0.34% |
|
52 Wk Lows |
69 |
|
|
52 Wk Lows |
198 |
|
|
 |
Major Averages Inched Lower With Lighter Volume Totals Again
Kenneth J. Gruneisen - Passed the CAN SLIM® Master's Exam
The Dow shed 7 points, while the Nasdaq Composite fell 0.4%. The S&P 500 slid 0.3%. The volume totals reported were lighter than the prior session totals on the NYSE and on the Nasdaq exchange, revealing less pressure from institutional selling. Breadth was negative as decliners led advancers by almost a 2-1 margin on the NYSE and by about a 3-2 margin on the Nasdaq exchange. There were 8 high-ranked companies from the Leaders List that hit new 52-week highs and were listed on the BreakOuts Page, versus the total of 27 on the prior session. New 52-week lows outnumbered new 52-week highs on the NYSE and on the Nasdaq exchange. The market is in a confirmed uptrend (M criteria). Healthy leadership (new 52-week highs totals) has continued to help the rally be productive. Only stocks meeting all key-criteria of the fact-based investment system should be considered as buy candidates.
Chart courtesy of www.stockcharts.com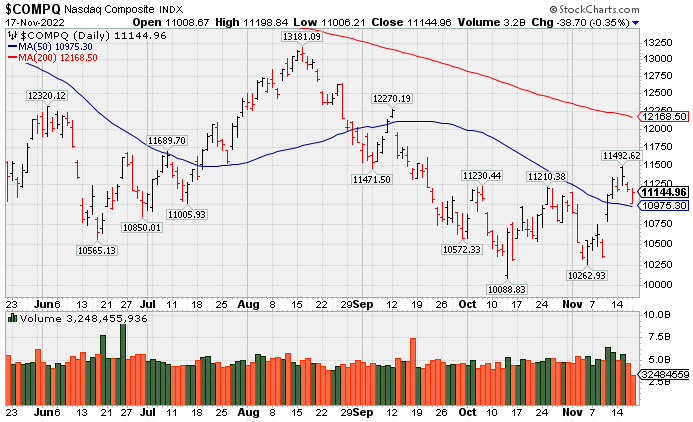 PICTURED: The Nasdaq Composite Index fell on Thursday with lighter volume, slumping back near its 50-day moving average (DMA) line. Of the 3 major indices only the Dow is in "healthy shape" above its 200 DMA line.
U.S. equities closed lower Thursday after Federal Reserve (Fed) officials said rate hikes are far from over. Saint Louis Fed president James Bullard’s announced earlier today the policy rate is not close to a level to be considered sufficiently restrictive, and the current monetary policy has only shown limited effects on observed inflation; however, markets may suggest disinflation in 2023. Eight of the 11 sectors in the S&P 500 finished in positive territory, with Utilities leading laggards.
On the data front, October’s housing starts decreased 4.2% month-over-month. Building permits also declined 2.4% for the month of October, coming in slightly better than analyst expectations of a 3.2% drop. Initial jobless claims for the week ended November 12 came in at 222,000, down from the prior week’s upwardly revised 226,000 print. In corporate news, Bath & Body Works (BBWI +24.39%) rallied for its best day since 2020 after topping earnings expectations and increasing its 2022 guidance.
Treasuries weaken after Fed officials hinted at the continuation of rate hikes. The yield on the 10-year note gained eight basis points (0.08%) to 3.76%, while the 30-year bond yield increased four basis points (0.04%) to 3.87%. The two-year note yield climbed nine basis points (0.09%) to 4.45%. In commodities, West Texas Intermediate (WTI) crude fell 4.3% to $81.94/barrel, hitting its lowest level in more than six weeks, amid continued concerns over global demand and increased COVID-19 cases in China. Meanwhile, U.S. crude inventories fell by a larger than expected 5 million barrels last week. |
 Kenneth J. Gruneisen started out as a licensed stockbroker in August 1987, a couple of months prior to the historic stock market crash that took the Dow Jones Industrial Average down -22.6% in a single day. He has published daily fact-based fundamental and technical analysis on high-ranked stocks online for two decades. Through FACTBASEDINVESTING.COM, Kenneth provides educational articles, news, market commentary, and other information regarding proven investment systems that work in good times and bad.
Comments contained in the body of this report are technical opinions only and are not necessarily those of Gruneisen Growth Corp. The material herein has been obtained from sources believed to be reliable and accurate, however, its accuracy and completeness cannot be guaranteed. Our firm, employees, and customers may effect transactions, including transactions contrary to any recommendation herein, or have positions in the securities mentioned herein or options with respect thereto. Any recommendation contained in this report may not be suitable for all investors and it is not to be deemed an offer or solicitation on our part with respect to the purchase or sale of any securities. |
|
 |
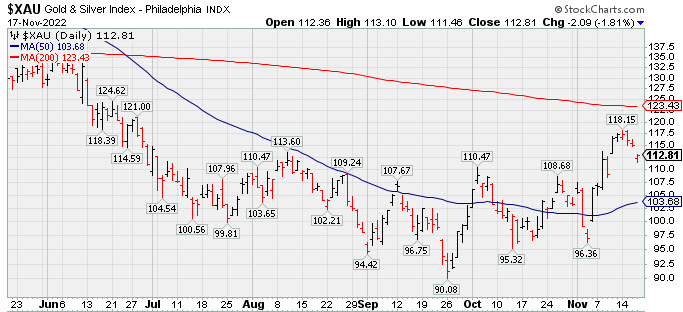
Retail, Financial, and Gold & Silver Indexes Fell
Kenneth J. Gruneisen - Passed the CAN SLIM® Master's Exam
The Retail Index ($RLX -1.48%),Bank Index ($BKX -1.24%), and Broker/Dealer Index ($XBD -0.65%) suffered unanimous losses that weighed on the major averages. The Semiconductor Index ($SOX +1.05%) led the tech sector while the Networking Index ($NWX +0.33%) also inched higher, but the Biotech Index ($BTK -0.24%) inched lower. The Integrated Oil Index ($XOI +0.58%) posted a modest gain while the Oil Services Index ($OSX -0.10%) ended slightly in the red.
PICTURED: The Gold & Silver Index ($XAU -1.81%) pulled back today for a 4th consecutive loss. It remains below its 200-day moving average (DMA) line.
| Oil Services |
$OSX |
85.69 |
-0.08 |
-0.10% |
+62.54% |
| Integrated Oil |
$XOI |
1,906.93 |
+11.02 |
+0.58% |
+61.85% |
| Semiconductor |
$SOX |
2,719.10 |
+28.29 |
+1.05% |
-31.09% |
| Networking |
$NWX |
793.19 |
+2.63 |
+0.33% |
-18.32% |
| Broker/Dealer |
$XBD |
466.28 |
-3.04 |
-0.65% |
-4.23% |
| Retail |
$RLX |
2,908.13 |
-43.75 |
-1.48% |
-31.19% |
| Gold & Silver |
$XAU |
112.81 |
-2.09 |
-1.81% |
-14.83% |
| Bank |
$BKX |
105.03 |
-1.32 |
-1.24% |
-20.56% |
| Biotech |
$BTK |
5,161.82 |
-12.36 |
-0.24% |
-6.46% |
|
|
|
 |
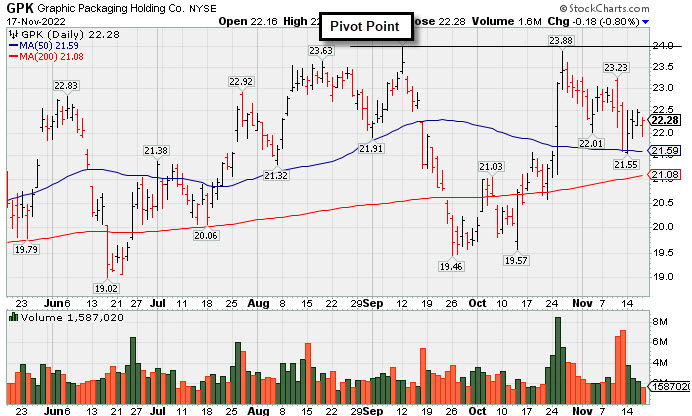
Consolidating Above 50-Day Moving Average Still Perched Near High
Kenneth J. Gruneisen - Passed the CAN SLIM® Master's Exam
Graphic Packaging Hldg (GPK -$0.18 or -0.80% to $22.28) has recently been testing support near its 50-day moving average (DMA) line ($21.59). More damaging losses would raise concerns and trigger a technical sell signal. Subsequent gains above the pivot point backed by at least +40% above average volume may trigger a technical buy signal.
GPK was highlighted in yellow with pivot point cited based on its 9/12/22 high plus 10 cents in the 10/25/22 mid-day report (read here). GPK has a 99 Earnings Per Share Rating. It reported Sep '22 quarterly earnings +79% on +38% sales revenues versus the year ago period. It was last shown in this FSU section on 10/25/22 with an annotated graph under the headline, "Rebound Above 50-Day Moving Average Helped Outlook Improve". Fundamentals have remained strong. The past 3 quarterly comparisons were well above the +25% minimum earnings guideline (C criteria). Its annual earnings history has been good since a downturn in FY '16 and '17, meeting the fact-based investment system's fundamental guidelines (A criteria).
The Paper & Paper Products group is ranked 112th on the 197 Industry Groups list and it has a C+ (44) Group Relative Strength Rating (L criteria). The number of top-rated funds owning its shares rose from 596 in Sep '21 to 655 in Sep '22, a reassuring sign concerning the I criteria. Its current Up/Down Volume Ratio of 0.8 is an unbiased indication its shares have been under distributional pressure over the past 50 days.
|
|
|
Color Codes Explained :
Y - Better candidates highlighted by our
staff of experts.
G - Previously featured
in past reports as yellow but may no longer be buyable under the
guidelines.
***Last / Change / Volume data in this table is the closing quote data***
Symbol/Exchange
Company Name
Industry Group |
PRICE |
CHANGE
(%Change) |
Day High |
Volume
(% DAV)
(% 50 day avg vol) |
52 Wk Hi
% From Hi |
Featured
Date |
Price
Featured |
Pivot Featured |
|
Max Buy |
 ESQ
-
NASDAQ
ESQ
-
NASDAQ
Esquire Financial Hldgs
Finance-Commercial Loans
|
$44.34
|
-0.51
-1.14% |
$44.99
|
18,818
64.89% of 50 DAV
50 DAV is 29,000
|
$48.13
-7.87%
|
10/18/2022
|
$40.02
|
PP = $39.95
|
|
MB = $41.95
|
 Most Recent Note - 11/17/2022 12:35:07 PM
G - Volume totals have been average or lighter while consolidating. Well above prior highs in the $41 area which define support to watch along with its 50 DMA line ($40.60).
>>> FEATURED STOCK ARTICLE : New High With 6th Consecutive Volume-Driven Gain - 10/31/2022 |
View all notes |
Set NEW NOTE alert |
Company Profile |
SEC
News |
Chart |
Request a new note
C
A
S
I |
CCRN
-
NASDAQ
Cross Country Healthcare
DIVERSIFIED SERVICES - Staffing and Outsourcing Service
|
$33.84
|
+0.05
0.15% |
$34.06
|
464,635
49.75% of 50 DAV
50 DAV is 934,000
|
$40.12
-15.65%
|
9/9/2022
|
$27.32
|
PP = $30.61
|
|
MB = $32.14
|
Most Recent Note - 11/16/2022 3:29:12 PM
Y - On track today for a 3rd consecutive gain after a prompt rebound above the 50 DMA line ($31.98) helped its outlook improve. Prior highs in the $30.50 area define important near-term support to watch where more damaging losses would trigger a technical sell signal. Reported Sep '22 quarterly earnings +75% on +70% sales revenues versus the year ago period.
>>> FEATURED STOCK ARTICLE : Consolidating Above Prior Highs and Above 50-Day Moving Average - 11/8/2022 |
View all notes |
Set NEW NOTE alert |
Company Profile |
SEC
News |
Chart |
Request a new note
C
A
S
I |
CMC
-
NYSE
Commercial Metals Co
METALS and MINING - Steel and Iron
|
$47.65
|
+0.41
0.87% |
$47.70
|
566,038
52.22% of 50 DAV
50 DAV is 1,084,000
|
$49.41
-3.56%
|
10/14/2022
|
$41.61
|
PP = $44.45
|
|
MB = $46.67
|
Most Recent Note - 11/17/2022 5:20:13 PM
G - Posted a gain today with light volume, hovering near its all-time high. Fundamentals remain strong. Prior high in the $44 area defines initial support to watch on pullbacks.
>>> FEATURED STOCK ARTICLE : Steel/Metal Products Firm Quietly Perched Near All Time High - 11/7/2022 |
View all notes |
Set NEW NOTE alert |
Company Profile |
SEC
News |
Chart |
Request a new note
C
A
S
I |
VRTX
-
NASDAQ
Vertex Pharmaceuticals
Medical-Biomed/Biotech
|
$309.90
|
+4.46
1.46% |
$311.86
|
1,047,951
70.81% of 50 DAV
50 DAV is 1,480,000
|
$318.38
-2.66%
|
10/24/2022
|
$308.47
|
PP = $306.05
|
|
MB = $321.35
|
Most Recent Note - 11/16/2022 5:31:51 PM
Y - Consolidating above its 50 DMA line ($297) which defines near-term support above recent intra-day lows in the $287-288 area. Recently reported Sep '22 quarterly earnings +14% on +18% sales revenues versus the year ago period, below the +25% minimum earnings guideline raising fundamental concerns (C criteria). Annual earnings (A criteria) history has been strong. See the latest FSU analysis for more details and a new annotated graph.
>>> FEATURED STOCK ARTICLE : Made Little Progress Following Breakout and Latest Earnings News - 11/16/2022 |
View all notes |
Set NEW NOTE alert |
Company Profile |
SEC
News |
Chart |
Request a new note
C
A
S
I |
GPK
-
NYSE
Graphic Packaging Hldg
CONSUMER NON-DURABLES - Packaging and Containers
|
$22.28
|
-0.18
-0.80% |
$22.34
|
1,587,020
52.72% of 50 DAV
50 DAV is 3,010,000
|
$24.07
-7.44%
|
10/25/2022
|
$22.75
|
PP = $24.17
|
|
MB = $25.38
|
Most Recent Note - 11/17/2022 5:15:29 PM
Y - Volume totals are cooling while consolidating above its 50 DMA line ($21.59). More damaging losses would raise concerns and trigger a technical sell signal. Subsequent gains above the pivot point backed by at least +40% above average volume may trigger a technical buy signal. Fundamentals remain strong. See the latest FSU analysis for more details and a new annotated graph.
>>> FEATURED STOCK ARTICLE : Consolidating Above 50-Day Moving Average Still Perched Near High - 11/17/2022 |
View all notes |
Set NEW NOTE alert |
Company Profile |
SEC
News |
Chart |
Request a new note
C
A
S
I |
Symbol/Exchange
Company Name
Industry Group |
PRICE |
CHANGE
(%Change) |
Day High |
Volume
(% DAV)
(% 50 day avg vol) |
52 Wk Hi
% From Hi |
Featured
Date |
Price
Featured |
Pivot Featured |
|
Max Buy |
CBZ
-
NYSE
C B I Z Inc
Comml Svcs-Consulting
|
$47.98
|
+0.16
0.33% |
$48.00
|
156,783
57.22% of 50 DAV
50 DAV is 274,000
|
$50.57
-5.12%
|
10/26/2022
|
$47.83
|
PP = $48.57
|
|
MB = $51.00
|
Most Recent Note - 11/16/2022 3:20:59 PM
Y - Volume totals have been cooling while consolidating just below its pivot point. Its 50 DMA line ($45.69) and recent low define important near-term support. Recently reported Sep '22 quarterly earnings +24% on +28% sales revenues versus the year ago period.
>>> FEATURED STOCK ARTICLE : Earnings Report Due for Commercial Services and Consulting Firm - 10/26/2022 |
View all notes |
Set NEW NOTE alert |
Company Profile |
SEC
News |
Chart |
Request a new note
C
A
S
I |
ENPH
-
NASDAQ
Enphase Energy Inc
Energy-Solar
|
$312.96
|
+7.78
2.55% |
$314.78
|
3,526,569
85.64% of 50 DAV
50 DAV is 4,118,000
|
$324.84
-3.66%
|
10/26/2022
|
$301.55
|
PP = $324.94
|
|
MB = $341.19
|
Most Recent Note - 11/17/2022 12:37:19 PM
Y - On track today for a 4th consecutive gain. Recently challenged its 52-week high and pivot point. Faces little near-term resistance due to overhead supply up to the $324 level. Its 50 DMA line ($283) defines near-term support above the recent low ($262.60 on 11/07/22). Fundamentals remain strong.
>>> FEATURED STOCK ARTICLE : Enphase Energy Rebound Above 50-Day Moving Average Helped Outlook - 10/28/2022 |
View all notes |
Set NEW NOTE alert |
Company Profile |
SEC
News |
Chart |
Request a new note
C
A
S
I |
HRMY
-
NASDAQ
Harmony Biosciences Holdings
Medical-Biomed/Biotech
|
$56.06
|
+0.42
0.75% |
$56.25
|
359,109
67.04% of 50 DAV
50 DAV is 535,700
|
$61.55
-8.92%
|
11/1/2022
|
$55.31
|
PP = $57.23
|
|
MB = $60.09
|
Most Recent Note - 11/17/2022 5:22:00 PM
Y - Managed a "positive reversal" today after early weakness. Recently testing near prior highs in the $57 area that define initial support to watch above its 50 DMA line ($49.90).
>>> FEATURED STOCK ARTICLE : Volume Heavy Behind Technical Breakout After Earnings - 11/1/2022 |
View all notes |
Set NEW NOTE alert |
Company Profile |
SEC
News |
Chart |
Request a new note
C
A
S
I |
CLH
-
NYSE
Clean Harbors Inc
Pollution Control
|
$116.33
|
+0.63
0.54% |
$117.63
|
514,472
113.07% of 50 DAV
50 DAV is 455,000
|
$124.49
-6.55%
|
11/2/2022
|
$121.59
|
PP = $124.59
|
|
MB = $130.82
|
Most Recent Note - 11/16/2022 3:27:42 PM
G - Near its 50 DMA line ($116.02) with today's gain, but a rebound above the 50 DMA line is needed for its outlook to improve. Fundamentals remain strong after reporting Sep '22 quarterly earnings +113% on +43% sales revenues versus the year ago period.
>>> FEATURED STOCK ARTICLE : Testing 50 Day Moving Average Line After Forming New Base - 11/2/2022 |
View all notes |
Set NEW NOTE alert |
Company Profile |
SEC
News |
Chart |
Request a new note
C
A
S
I |
NPO
-
NYSE
Enpro Industries Inc
Machinery-Gen Industrial
|
$120.50
|
-0.61
-0.50% |
$120.81
|
168,585
172.03% of 50 DAV
50 DAV is 98,000
|
$127.67
-5.62%
|
11/4/2022
|
$119.06
|
PP = $117.73
|
|
MB = $123.62
|
Most Recent Note - 11/16/2022 3:25:57 PM
Y - Color code is changed to yellow while pulling back with below average volume today, undercutting its "max buy" level. Reported Sep '22 quarterly earnings +65% on +34% sales revenues versus the year ago period, its 3rd strong quarterly comparison above the +25% minimum earnings guideline (C criteria), helping it better match the winning models of the fact-based investment system. Annual earnings growth has been steady even through the pandemic.
>>> FEATURED STOCK ARTICLE : Finished Strong After Highlighted in Friday Mid-Day Report - 11/4/2022 |
View all notes |
Set NEW NOTE alert |
Company Profile |
SEC
News |
Chart |
Request a new note
C
A
S
I |
Symbol/Exchange
Company Name
Industry Group |
PRICE |
CHANGE
(%Change) |
Day High |
Volume
(% DAV)
(% 50 day avg vol) |
52 Wk Hi
% From Hi |
Featured
Date |
Price
Featured |
Pivot Featured |
|
Max Buy |
DGII
-
NASDAQ
Digi International Inc
COMPUTER HARDWARE - Networking and Communication Dev
|
$39.50
|
-1.86
-4.50% |
$41.09
|
330,918
78.98% of 50 DAV
50 DAV is 419,000
|
$42.04
-6.04%
|
11/10/2022
|
$41.82
|
PP = $40.96
|
|
MB = $43.01
|
Most Recent Note - 11/17/2022 12:32:35 PM
Y - Pulling back today without great volume. Recently wedged above the pivot point cited based on its 10/31/22 high plus 10 cents after forming an advanced "ascending base" pattern. Subsequent gains above the pivot point backed by at least +40% above average volume are needed to confirm a proper technical buy signal. Reported Sep '22 quarterly earnings +80% versus the year ago period, its 3rd strong quarterly comparison well above the +25% minimum earnings guideline (C criteria), helping it better match the fact-based investment system's winning models. Annual earnings (A criteria) history has been strong after a downturn in FY '17-18.
>>> FEATURED STOCK ARTICLE : Finish Below Pivot Point Leaves Disciplined Investors Waiting - 11/10/2022 |
View all notes |
Set NEW NOTE alert |
Company Profile |
SEC
News |
Chart |
Request a new note
C
A
S
I |
GFF
-
NYSE
Griffon Corporation
MATERIALS and CONSTRUCTION - General Building Materials
|
$33.25
|
-0.36
-1.07% |
$34.18
|
480,938
135.86% of 50 DAV
50 DAV is 354,000
|
$34.92
-4.78%
|
11/10/2022
|
$34.13
|
PP = $35.02
|
|
MB = $36.77
|
Most Recent Note - 11/17/2022 12:17:35 PM
Y - Its 50 DMA line ($31.45) defines important near-term support. Up from early lows after pulling back since reporting reporting Sep '22 quarterly earnings +230% versus the year ago period. Volume and volatility often increase near earnings news. Subsequent gains above the pivot point backed by at least +40% above average volume may trigger a technical buy signal.
>>> FEATURED STOCK ARTICLE : Griffon Perched Near 52-Week High After 9-Week Base - 11/11/2022 |
View all notes |
Set NEW NOTE alert |
Company Profile |
SEC
News |
Chart |
Request a new note
C
A
S
I |
ANET
-
NYSE
Arista Networks Inc
Computer-Networking
|
$132.06
|
+1.37
1.05% |
$133.58
|
1,865,850
75.21% of 50 DAV
50 DAV is 2,481,000
|
$148.57
-11.11%
|
11/14/2022
|
$132.05
|
PP = $133.70
|
|
MB = $140.39
|
Most Recent Note - 11/17/2022 5:18:45 PM
Y - Holding its ground stubbornly since highlighted in yellow in the 11/14/22 mid-day report with pivot point cited based on its 11/04/22 high after a cup-with-handle base. Subsequent gains and a close above the pivot point backed by at least +40% above average volume may trigger a technical buy signal. Perched near its August high, but it still faces some resistance due to overhead supply up to the $148 level. Fundamentals are strong.
>>> FEATURED STOCK ARTICLE : Finished in Middle of Intra-Day Range After Challenging Pivot Point - 11/14/2022 |
View all notes |
Set NEW NOTE alert |
Company Profile |
SEC
News |
Chart |
Request a new note
C
A
S
I |
|
|
|
THESE ARE NOT BUY RECOMMENDATIONS!
Comments contained in the body of this report are technical
opinions only. The material herein has been obtained
from sources believed to be reliable and accurate, however,
its accuracy and completeness cannot be guaranteed.
This site is not an investment advisor, hence it does
not endorse or recommend any securities or other investments.
Any recommendation contained in this report may not
be suitable for all investors and it is not to be deemed
an offer or solicitation on our part with respect to
the purchase or sale of any securities. All trademarks,
service marks and trade names appearing in this report
are the property of their respective owners, and are
likewise used for identification purposes only.
This report is a service available
only to active Paid Premium Members.
You may opt-out of receiving report notifications
at any time. Questions or comments may be submitted
by writing to Premium Membership Services 665 S.E. 10 Street, Suite 201 Deerfield Beach, FL 33441-5634 or by calling 1-800-965-8307
or 954-785-1121.
|
|
|