You are not logged in.
This means you
CAN ONLY VIEW reports that were published prior to Tuesday, March 25, 2025.
You
MUST UPGRADE YOUR MEMBERSHIP if you want to see any current reports.
AFTER MARKET UPDATE - MONDAY, DECEMBER 12TH, 2022
Previous After Market Report Next After Market Report >>>
|
|
|
|
DOW |
+528.58 |
34,005.04 |
+1.58% |
|
Volume |
860,850,984 |
-1% |
|
Volume |
4,757,472,300 |
+11% |
|
NASDAQ |
+139.12 |
11,143.74 |
+1.26% |
|
Advancers |
1,932 |
64% |
|
Advancers |
2,596 |
57% |
|
S&P 500 |
+56.18 |
3,990.56 |
+1.43% |
|
Decliners |
1,109 |
36% |
|
Decliners |
1,948 |
43% |
|
Russell 2000 |
+21.95 |
1,818.61 |
+1.22% |
|
52 Wk Highs |
48 |
|
|
52 Wk Highs |
87 |
|
|
S&P 600 |
+12.46 |
1,199.08 |
+1.05% |
|
52 Wk Lows |
90 |
|
|
52 Wk Lows |
295 |
|
|
 |
Major Averages Rose But Recently Have Been Lacking Leadership
Kenneth J. Gruneisen - Passed the CAN SLIM® Master's Exam
The Dow added 528 points, while the Nasdaq Composite climbed 1.3%. The S&P 500 advanced 1.4%. Volume totals were mixed, lighter than the prior session on the NYSE and higher on the Nasdaq exchange. Breadth was positive as advancers led decliners by more than a 3-2 margin on the NYSE and 5-4 on the Nasdaq exchange. However, there were only 6 high-ranked companies from the Leaders List that hit new 52-week highs and were listed on the BreakOuts Page, versus the total of 11 on the prior session. New 52-week lows totals expanded and solidly outnumbered new 52-week highs on the NYSE and on the Nasdaq exchange. The market is in an uptrend (M criteria). Healthy leadership (new 52-week highs totals) must continue for the rally be productive, but new highs totals have recently contracted. Only stocks meeting all key-criteria of the fact-based investment system should be considered as buy candidates.
Chart courtesy of www.stockcharts.com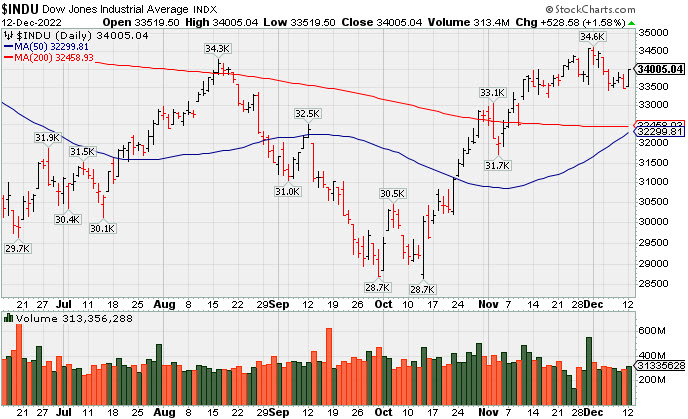 PICTURED: The Dow Jones Industrial Average is consolidating above its 50-day moving average (DMA) line and longer-term 200 DMA average line. Those moving averages are about to converge in what is a considered a technically bullish signal termed a "golden cross".
U.S. equities in all sectors ended in positive territory on Monday as Wall Street rebounded from its worst week since September. Investors shifted their focus to this week’s Consumer Price Index (CPI) data and the Federal Reserve (Fed) monetary policy meeting. The November CPI report is expected to show prices climbed 0.3% month-over-month, easing from October’s 0.4% monthly gain. Meanwhile, headline CPI is expected to come in at 7.3% year-over-year, slowing from October’s 7.7% print. The Fed is widely expected to hike rates by 50 basis points (0.50%), and investors will parse through Fed Chairman Jerome Powell’s post-meeting comments for any clues as to the future course of interest rate hikes.
On the data front, the November New York Fed Survey of Consumer Expectations showed consumers were more optimistic about inflation, with one-year inflations expectations falling to 5.2% from October’s 5.9% print. The three-year and five-year inflation expectation components also declined.
Treasuries weakened ahead of the Fed meeting, with the yield on the benchmark 10-year note up three basis points (0.03%) to 3.61%, while the yield on the 30-year bond remained unchanged at 3.57%. The yield on the two-year note, which is more sensitive to changes in Fed policy, climbed four basis points (0.04%) to 4.38%. In commodities, West Texas Intermediate (WTI) crude recouped some of last week’s losses, adding 3.5% to $73.47/barrel. The moves come amid tight supply conditions due to the closure of the Canada-to-U.S. Keystone pipeline.
|
 Kenneth J. Gruneisen started out as a licensed stockbroker in August 1987, a couple of months prior to the historic stock market crash that took the Dow Jones Industrial Average down -22.6% in a single day. He has published daily fact-based fundamental and technical analysis on high-ranked stocks online for two decades. Through FACTBASEDINVESTING.COM, Kenneth provides educational articles, news, market commentary, and other information regarding proven investment systems that work in good times and bad.
Comments contained in the body of this report are technical opinions only and are not necessarily those of Gruneisen Growth Corp. The material herein has been obtained from sources believed to be reliable and accurate, however, its accuracy and completeness cannot be guaranteed. Our firm, employees, and customers may effect transactions, including transactions contrary to any recommendation herein, or have positions in the securities mentioned herein or options with respect thereto. Any recommendation contained in this report may not be suitable for all investors and it is not to be deemed an offer or solicitation on our part with respect to the purchase or sale of any securities. |
|
 |
Retail, Tech, Energy, and Financial Indexes Rose
Kenneth J. Gruneisen - Passed the CAN SLIM® Master's Exam
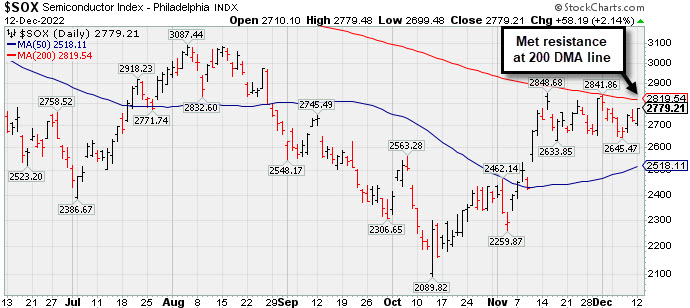
The Retail Index ($RLX +1.34%), Bank Index ($BKX +1.49%), and Broker/Dealer Index ($XBD +0.59%) each posted gains. The tech sector had a positive bias as the Semiconductor Index ($SOX +2.14%), Networking Index ($NWX +1.57%), and Biotech Index ($BTK +1.19%) rose. The Oil Services Index ($OSX +4.13%) and Integrated Oil Index ($XOI +2.67%) both posted solid gains while the Gold & Silver Index ($XAU +0.02%) finished flat.
PICTURED: The Semiconductor Index ($SOX +2.14%) has been consolidating below its 200-day moving average (DMA) line which has acted as resistance.
| Oil Services |
$OSX |
78.17 |
+3.10 |
+4.13% |
+48.27% |
| Integrated Oil |
$XOI |
1,723.25 |
+44.79 |
+2.67% |
+46.26% |
| Semiconductor |
$SOX |
2,779.21 |
+58.19 |
+2.14% |
-29.57% |
| Networking |
$NWX |
824.41 |
+12.76 |
+1.57% |
-15.10% |
| Broker/Dealer |
$XBD |
468.47 |
+2.74 |
+0.59% |
-3.78% |
| Retail |
$RLX |
2,876.30 |
+38.08 |
+1.34% |
-31.95% |
| Gold & Silver |
$XAU |
119.92 |
+0.03 |
+0.02% |
-9.46% |
| Bank |
$BKX |
102.01 |
+1.50 |
+1.49% |
-22.85% |
| Biotech |
$BTK |
5,281.04 |
+61.91 |
+1.19% |
-4.30% |
|
|
|
 |
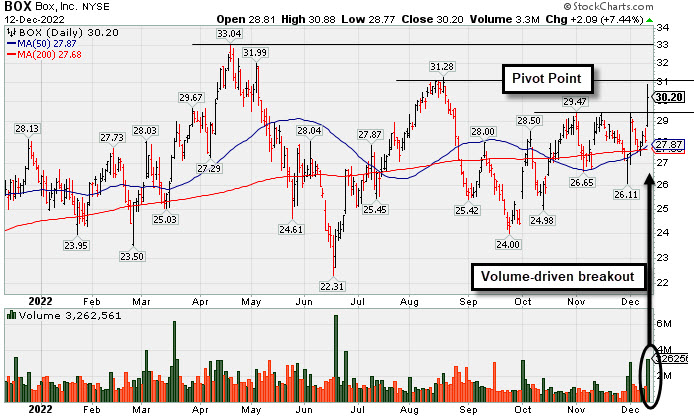
Volume Heavy Behind Breakout for Box Inc
Kenneth J. Gruneisen - Passed the CAN SLIM® Master's Exam
Box Inc Cl A (BOX +$2.09 or +7.44% to $30.20) was highlighted in yellow with pivot point cited based on its 11/01/22 high plus 10 cents in the earlier mid-day report (read here). It formed an orderly base and recently found support near its 50-day and 200-day moving average (DMA) lines. Today's big gain backed by +211% above average volume triggered a technical buy signal. Keep in mind it still faces some additional resistance due to overhead supply up to the $33 level.
BOX reported Sep '22 quarterly earnings +41% on +12% sales revenues over the year ago period, above the +25% minimum earnings guideline (C criteria) for the 3rd consecutive quarterly comparison. Quarterly and annual earnings increases have been strong and steady. It has a 97 Earnings Per Share Rating.
There are 142.3 million shares outstanding. The number of top-rated funds owning its shares rose from 468 in Dec '21 to 541 in Sep '22, a reassuring sign concerning the I criteria. Its current Up/Down Volume Ratio of 1.5 is an unbiased indication its shares have been under accumulation over the past 50 days.
|
|
|
Color Codes Explained :
Y - Better candidates highlighted by our
staff of experts.
G - Previously featured
in past reports as yellow but may no longer be buyable under the
guidelines.
***Last / Change / Volume data in this table is the closing quote data***
Symbol/Exchange
Company Name
Industry Group |
PRICE |
CHANGE
(%Change) |
Day High |
Volume
(% DAV)
(% 50 day avg vol) |
52 Wk Hi
% From Hi |
Featured
Date |
Price
Featured |
Pivot Featured |
|
Max Buy |
 ESQ
-
NASDAQ
ESQ
-
NASDAQ
Esquire Financial Hldgs
Finance-Commercial Loans
|
$42.72
|
+0.47
1.11% |
$42.92
|
15,835
58.65% of 50 DAV
50 DAV is 27,000
|
$48.13
-11.24%
|
10/18/2022
|
$40.02
|
PP = $39.95
|
|
MB = $41.95
|
 Most Recent Note - 12/12/2022 6:09:28 PM
G - Managed a positive reversal today after early weakness below its 50 DMA line, testing prior highs and its 50 DMA line ($42.43) defining important near-term support to watch.
>>> FEATURED STOCK ARTICLE : Pulled Back Following "Negative Reversal" at All-Time High - 11/25/2022 |
View all notes |
Set NEW NOTE alert |
Company Profile |
SEC
News |
Chart |
Request a new note
C
A
S
I |
CCRN
-
NASDAQ
Cross Country Healthcare
DIVERSIFIED SERVICES - Staffing and Outsourcing Service
|
$29.51
|
-0.83
-2.74% |
$30.40
|
1,191,133
145.08% of 50 DAV
50 DAV is 821,000
|
$40.12
-26.45%
|
9/9/2022
|
$27.32
|
PP = $30.61
|
|
MB = $32.14
|
Most Recent Note - 12/12/2022 6:54:09 PM
Suffered a 6th consecutive loss today, slumping further below its 50 DMA line ($34), Damaging losses triggered a more worrisome technical sell signal by violating the prior low ($29.97 on 11/11/22). It will be dropped from the Featured Stocks list tonight.
>>> FEATURED STOCK ARTICLE : Big Loss Testing Support at 50-Day Moving Average - 12/5/2022 |
View all notes |
Set NEW NOTE alert |
Company Profile |
SEC
News |
Chart |
Request a new note
C
A
S
I |
CMC
-
NYSE
Commercial Metals Co
METALS and MINING - Steel and Iron
|
$48.57
|
+0.60
1.25% |
$48.70
|
1,086,849
109.45% of 50 DAV
50 DAV is 993,000
|
$50.83
-4.45%
|
10/14/2022
|
$41.61
|
PP = $44.45
|
|
MB = $46.67
|
Most Recent Note - 12/9/2022 3:11:15 PM
G - Pulling back further today following a "negative reversal" on 12/07/22 after hitting yet a new high, now on track to break a streak of 9 consecutive weekly gains. Fundamentals remain strong. Prior highs define initial support to watch above its 50 DMA line ($44.90).
>>> FEATURED STOCK ARTICLE : Wedging Higher With Recent Gains Lacking Great Volume - 12/2/2022 |
View all notes |
Set NEW NOTE alert |
Company Profile |
SEC
News |
Chart |
Request a new note
C
A
S
I |
VRTX
-
NASDAQ
Vertex Pharmaceuticals
Medical-Biomed/Biotech
|
$314.19
|
+1.97
0.63% |
$315.41
|
1,347,625
91.24% of 50 DAV
50 DAV is 1,477,000
|
$324.75
-3.25%
|
10/24/2022
|
$308.47
|
PP = $306.05
|
|
MB = $321.35
|
Most Recent Note - 12/9/2022 3:16:43 PM
Y - Pulling back today with light volume after wedging to new highs with light volume. Its 50 DMA line ($306.72) defines near-term support to watch. Recently reported Sep '22 quarterly earnings +14% on +18% sales revenues versus the year ago period, below the +25% minimum earnings guideline raising fundamental concerns (C criteria). Annual earnings (A criteria) history has been strong.
>>> FEATURED STOCK ARTICLE : Made Little Progress Following Breakout and Latest Earnings News - 11/16/2022 |
View all notes |
Set NEW NOTE alert |
Company Profile |
SEC
News |
Chart |
Request a new note
C
A
S
I |
GPK
-
NYSE
Graphic Packaging Hldg
CONSUMER NON-DURABLES - Packaging and Containers
|
$22.28
|
+0.18
0.81% |
$22.31
|
4,059,260
138.49% of 50 DAV
50 DAV is 2,931,000
|
$24.07
-7.44%
|
10/25/2022
|
$22.75
|
PP = $24.17
|
|
MB = $25.38
|
Most Recent Note - 12/9/2022 4:39:00 PM
Y - Pulled back today for a 3rd consecutive loss, consolidating above its 50 DMA line ($21.95). More damaging losses would raise concerns and trigger a technical sell signal. Subsequent gains above the pivot point backed by at least +40% above average volume may trigger a technical buy signal. Fundamentals remain strong.
>>> FEATURED STOCK ARTICLE : Consolidating Above 50-Day Moving Average Still Perched Near High - 11/17/2022 |
View all notes |
Set NEW NOTE alert |
Company Profile |
SEC
News |
Chart |
Request a new note
C
A
S
I |
Symbol/Exchange
Company Name
Industry Group |
PRICE |
CHANGE
(%Change) |
Day High |
Volume
(% DAV)
(% 50 day avg vol) |
52 Wk Hi
% From Hi |
Featured
Date |
Price
Featured |
Pivot Featured |
|
Max Buy |
CBZ
-
NYSE
C B I Z Inc
Comml Svcs-Consulting
|
$49.97
|
+0.37
0.75% |
$50.32
|
315,398
122.25% of 50 DAV
50 DAV is 258,000
|
$50.57
-1.19%
|
10/26/2022
|
$47.83
|
PP = $48.57
|
|
MB = $51.00
|
Most Recent Note - 12/12/2022 6:41:39 PM
Y - Posted a 3rd consecutive small gain today with +22% above average volume, hovering near its 52-week high. Its 50 DMA line ($47.45) and recent low define important near-term support. It has formed an orderly new 6-week flat base but a new pivot point is not cited because it has made little headway from the prior base and remains below the "max buy" level. Recently reported Sep '22 quarterly earnings +24% on +28% sales revenues versus the year ago period.
>>> FEATURED STOCK ARTICLE : Gapped Up and Rebounded Above Pivot Point - 11/18/2022 |
View all notes |
Set NEW NOTE alert |
Company Profile |
SEC
News |
Chart |
Request a new note
C
A
S
I |
ENPH
-
NASDAQ
Enphase Energy Inc
Energy-Solar
|
$320.86
|
+1.31
0.41% |
$323.32
|
2,471,326
62.38% of 50 DAV
50 DAV is 3,962,000
|
$339.92
-5.61%
|
10/26/2022
|
$301.55
|
PP = $324.94
|
|
MB = $341.19
|
Most Recent Note - 12/12/2022 6:07:01 PM
Y - Holding its ground after recently slumping below its pivot point raising some concerns. Stalled after hitting a new all-time high on 12/02/22 with a volume-driven gain above its pivot point. Faces no resistance due to overhead supply. Its 50 DMA line ($289.28) defines near-term support above the recent low ($262.60 on 11/07/22). Fundamentals remain strong.
>>> FEATURED STOCK ARTICLE : Perched Near High Still Awaiting Technical Breakout - 11/21/2022 |
View all notes |
Set NEW NOTE alert |
Company Profile |
SEC
News |
Chart |
Request a new note
C
A
S
I |
HRMY
-
NASDAQ
Harmony Biosciences Holdings
Medical-Biomed/Biotech
|
$60.03
|
+1.00
1.69% |
$61.18
|
373,444
78.00% of 50 DAV
50 DAV is 478,800
|
$62.09
-3.32%
|
11/1/2022
|
$55.31
|
PP = $57.23
|
|
MB = $60.09
|
Most Recent Note - 12/9/2022 3:20:18 PM
Y - Color code is changed to yellow while pulling back below its "max buy" level with small losses marked by below average volume. The 11/17/22 low ($53.06) defines important support to watch coinciding with its 50 DMA line ($54.33).
>>> FEATURED STOCK ARTICLE : Harmony Still Hovering Near All-Time High - 11/28/2022 |
View all notes |
Set NEW NOTE alert |
Company Profile |
SEC
News |
Chart |
Request a new note
C
A
S
I |
CLH
-
NYSE
Clean Harbors Inc
Pollution Control
|
$118.16
|
+2.00
1.72% |
$118.23
|
292,117
70.56% of 50 DAV
50 DAV is 414,000
|
$125.41
-5.78%
|
11/2/2022
|
$121.59
|
PP = $124.59
|
|
MB = $130.82
|
Most Recent Note - 12/9/2022 3:18:34 PM
Y - On track today for its 4th loss with below average volume in the span of 5 sessions. Sputtering near its 50 DMA line ($117) and recent low ($114.86 on 11/29/22) which define important near-term support to watch. Fundamentals remain strong.
>>> FEATURED STOCK ARTICLE : Volume-Driven Losses Undercut 50-Day Moving Average - 11/29/2022 |
View all notes |
Set NEW NOTE alert |
Company Profile |
SEC
News |
Chart |
Request a new note
C
A
S
I |
NPO
-
NYSE
Enpro Industries Inc
Machinery-Gen Industrial
|
$111.18
|
+1.39
1.27% |
$111.75
|
64,338
64.34% of 50 DAV
50 DAV is 100,000
|
$127.67
-12.92%
|
11/4/2022
|
$119.06
|
PP = $117.73
|
|
MB = $123.62
|
Most Recent Note - 12/9/2022 3:25:12 PM
Y - Pulling back today for a 5th consecutive loss with below average volume. It has slumped back below its pivot point raising concerns. The 50 DMA line ($107.31) defines important near term support to watch. Fundamentals remain strong.
>>> FEATURED STOCK ARTICLE : Consolidating Near Old Highs Following Recent Breakout - 12/1/2022 |
View all notes |
Set NEW NOTE alert |
Company Profile |
SEC
News |
Chart |
Request a new note
C
A
S
I |
Symbol/Exchange
Company Name
Industry Group |
PRICE |
CHANGE
(%Change) |
Day High |
Volume
(% DAV)
(% 50 day avg vol) |
52 Wk Hi
% From Hi |
Featured
Date |
Price
Featured |
Pivot Featured |
|
Max Buy |
DGII
-
NASDAQ
Digi International Inc
COMPUTER HARDWARE - Networking and Communication Dev
|
$40.00
|
+0.60
1.52% |
$40.42
|
230,654
57.95% of 50 DAV
50 DAV is 398,000
|
$43.68
-8.42%
|
11/10/2022
|
$41.82
|
PP = $40.96
|
|
MB = $43.01
|
Most Recent Note - 12/12/2022 6:45:12 PM
Y - Posted a small gain today with lighter than average volume. Its 50 DMA line ($38.70) defines important near-term support to watch. Fundamentals remain strong.
>>> FEATURED STOCK ARTICLE : Sputtering After Recently Wedging to New Highs - 12/6/2022 |
View all notes |
Set NEW NOTE alert |
Company Profile |
SEC
News |
Chart |
Request a new note
C
A
S
I |
GFF
-
NYSE
Griffon Corporation
MATERIALS and CONSTRUCTION - General Building Materials
|
$36.26
|
+1.37
3.93% |
$36.34
|
564,878
153.92% of 50 DAV
50 DAV is 367,000
|
$36.75
-1.33%
|
11/10/2022
|
$34.13
|
PP = $35.02
|
|
MB = $36.77
|
Most Recent Note - 12/12/2022 6:04:52 PM
Y - Posted a volume-driven gain today for its second-best ever close. Recently consolidating near prior highs in the $34 area which define initial support to watch above its 50 DMA line ($32.87). Reported Sep '22 quarterly earnings +230% on +24% sales revenues versus the year ago period.
>>> FEATURED STOCK ARTICLE : No Meaningful Progress After Breakout 3 Weeks Ago - 12/7/2022 |
View all notes |
Set NEW NOTE alert |
Company Profile |
SEC
News |
Chart |
Request a new note
C
A
S
I |
ANET
-
NYSE
Arista Networks Inc
Computer-Networking
|
$130.96
|
+3.06
2.39% |
$130.99
|
1,982,265
83.15% of 50 DAV
50 DAV is 2,384,000
|
$148.57
-11.85%
|
11/14/2022
|
$132.05
|
PP = $133.70
|
|
MB = $140.39
|
Most Recent Note - 12/12/2022 6:56:11 PM
Y - Posted a gain today with below average volume. Its 50-day moving average (DMA) line ($123) defines near-term support to watch. Subsequent gains and a close above the pivot point must be backed by at least +40% above average volume to trigger a proper technical buy signal. Faces some resistance due to overhead supply up to the $148 level. Fundamentals are strong.
>>> FEATURED STOCK ARTICLE : Sputtered Back Below Prior High Hurting Outlook - 12/9/2022 |
View all notes |
Set NEW NOTE alert |
Company Profile |
SEC
News |
Chart |
Request a new note
C
A
S
I |
CPRX
-
NASDAQ
Catalyst Pharma Inc
Medical-Biomed/Biotech
|
$17.41
|
+1.03
6.29% |
$17.66
|
2,835,715
130.26% of 50 DAV
50 DAV is 2,177,000
|
$18.39
-5.33%
|
11/22/2022
|
$17.38
|
PP = $16.66
|
|
MB = $17.49
|
Most Recent Note - 12/12/2022 6:51:14 PM
Y - Posted a big volume-driven gain today approaching its "max buy" level. Recently consolidating near the prior high and well above its 50 DMA line ($14.70).
>>> FEATURED STOCK ARTICLE : Breakout From Cup-With-Handle With 90% Above Average Volume - 11/22/2022 |
View all notes |
Set NEW NOTE alert |
Company Profile |
SEC
News |
Chart |
Request a new note
C
A
S
I |
TITN
-
NASDAQ
Titan Machinery Inc
SPECIALTY RETAIL
|
$39.62
|
-0.29
-0.73% |
$40.19
|
187,858
101.00% of 50 DAV
50 DAV is 186,000
|
$44.35
-10.67%
|
11/30/2022
|
$40.10
|
PP = $38.68
|
|
MB = $40.61
|
Most Recent Note - 12/12/2022 6:48:53 PM
Y - Consolidating in an orderly fashion above the prior high in the $38 area which defines initial support to watch. Fundamentals remain strong after reporting Oct '22 quarterly earnings +91% on +47% sales revenues.
>>> FEATURED STOCK ARTICLE : Gap Up and Big Volume-Driven Breakout Gain - 11/30/2022 |
View all notes |
Set NEW NOTE alert |
Company Profile |
SEC
News |
Chart |
Request a new note
C
A
S
I |
Symbol/Exchange
Company Name
Industry Group |
PRICE |
CHANGE
(%Change) |
Day High |
Volume
(% DAV)
(% 50 day avg vol) |
52 Wk Hi
% From Hi |
Featured
Date |
Price
Featured |
Pivot Featured |
|
Max Buy |
MYE
-
NYSE
Myers Industries Inc
Containers/Packaging
|
$23.46
|
+0.26
1.12% |
$23.69
|
118,808
96.59% of 50 DAV
50 DAV is 123,000
|
$25.55
-8.18%
|
12/8/2022
|
$23.94
|
PP = $25.65
|
|
MB = $26.93
|
Most Recent Note - 12/9/2022 3:23:00 PM
Y - Pulling back today with below average volume. Highlighted in yellow with pivot point cited based on its 6/06/22 high plus 10 cents in the 12/08/22 mid-day report. It is -8.6% off its 52-week high and still on track for a 9th consecutive weekly gain. Subsequent gains above the pivot point backed by at least +40% above average volume may trigger a technical buy signal. The Sep '22 quarter showed +78% earnings on +14% sales revenues versus the year ago period. The past 4 quarterly comparisons were above the +25% minimum guideline (C criteria), however, its sales revenues growth rate has shown deceleration in sequential comparisons +45%, +29%, +24%, to +14%. Annual earnings (A criteria) history had a slight downturn in FY '19 but growth has been otherwise strong and steady. See the latest FSU analysis for more details and an annotated graph.
>>> FEATURED STOCK ARTICLE : Myers Industries on Track for 9th Straight Weekly Gain - 12/8/2022 |
View all notes |
Set NEW NOTE alert |
Company Profile |
SEC
News |
Chart |
Request a new note
C
A
S
I |
BOX
-
NYSE
Box Inc Cl A
Computer Sftwr-Database
|
$30.20
|
+2.09
7.44% |
$30.88
|
3,262,056
311.56% of 50 DAV
50 DAV is 1,047,000
|
$33.04
-8.60%
|
12/12/2022
|
$29.83
|
PP = $29.57
|
|
MB = $31.05
|
Most Recent Note - 12/12/2022 12:06:03 PM
Y - Color code is changed to yellow with pivot point cited based on its 11/01/22 high plus 10 cents. It has formed an orderly base and recently found support near its 50 and 200 DMA lines. Faces some additional resistance due to overhead supply up to the $33 level. Quarterly and annual earnings increases have been strong and steady.
>>> FEATURED STOCK ARTICLE : Volume Heavy Behind Breakout for Box Inc - 12/12/2022 |
View all notes |
Set NEW NOTE alert |
Company Profile |
SEC
News |
Chart |
Request a new note
C
A
S
I |
|
|
|
THESE ARE NOT BUY RECOMMENDATIONS!
Comments contained in the body of this report are technical
opinions only. The material herein has been obtained
from sources believed to be reliable and accurate, however,
its accuracy and completeness cannot be guaranteed.
This site is not an investment advisor, hence it does
not endorse or recommend any securities or other investments.
Any recommendation contained in this report may not
be suitable for all investors and it is not to be deemed
an offer or solicitation on our part with respect to
the purchase or sale of any securities. All trademarks,
service marks and trade names appearing in this report
are the property of their respective owners, and are
likewise used for identification purposes only.
This report is a service available
only to active Paid Premium Members.
You may opt-out of receiving report notifications
at any time. Questions or comments may be submitted
by writing to Premium Membership Services 665 S.E. 10 Street, Suite 201 Deerfield Beach, FL 33441-5634 or by calling 1-800-965-8307
or 954-785-1121.
|
|
|