You are not logged in.
This means you
CAN ONLY VIEW reports that were published prior to Monday, March 24, 2025.
You
MUST UPGRADE YOUR MEMBERSHIP if you want to see any current reports.
AFTER MARKET UPDATE - MONDAY, NOVEMBER 21ST, 2022
Previous After Market Report Next After Market Report >>>
|
|
|
|
DOW |
-45.41 |
33,700.28 |
-0.13% |
|
Volume |
812,723,100 |
-15% |
|
Volume |
3,905,459,400 |
-4% |
|
NASDAQ |
-121.55 |
11,024.51 |
-1.09% |
|
Advancers |
1,447 |
47% |
|
Advancers |
1,799 |
39% |
|
S&P 500 |
-15.40 |
3,949.94 |
-0.39% |
|
Decliners |
1,651 |
53% |
|
Decliners |
2,853 |
61% |
|
Russell 2000 |
-10.59 |
1,839.14 |
-0.57% |
|
52 Wk Highs |
53 |
|
|
52 Wk Highs |
99 |
|
|
S&P 600 |
-3.99 |
1,214.15 |
-0.33% |
|
52 Wk Lows |
59 |
|
|
52 Wk Lows |
278 |
|
|
 |
Major Indices Ended Slightly Lower
Kenneth J. Gruneisen - Passed the CAN SLIM® Master's Exam
The Dow lost 45 points, while the Nasdaq Composite shed 1.1%. The S&P 500 fell 0.4% amid weakness in Consumer Discretionary and Energy shares. The volume totals reported were mixed, higher than the prior session total on the NYSE and lighter on the Nasdaq exchange. Breadth was negative as decliners led advancers by an 8-7 margin on the NYSE and by a 3-2 margin on the Nasdaq exchange. There were 24 high-ranked companies from the Leaders List that hit new 52-week highs and were listed on the BreakOuts Page, matching the total of 24 on the prior session. New 52-week lows outnumbered new 52-week highs on the NYSE and on the Nasdaq exchange. The market is in a confirmed uptrend (M criteria). Healthy leadership (new 52-week highs totals) has continued to help the rally be productive. Only stocks meeting all key-criteria of the fact-based investment system should be considered as buy candidates.
Chart courtesy of www.stockcharts.com PICTURED: The S&P 500 Index remains below its 200-day moving average (DMA) line. Of the 3 major indices only the Dow is in "healthy shape" above its 200 DMA line.
U.S. equities finished lower in volatile trading Monday as Wall Street digested San Francisco Federal Reserve (Fed) President Mary Daly’s remarks. She expressed concern over the potential for overtightening, saying it could be "unnecessarily painful" for the economy. However, she reaffirmed the central bank will need to continue to raise rates to curb inflation. Also pressuring sentiment was a surge of COVID-19 cases and restrictions in China.
On the data front, the Chicago Fed’s economic activity index came in lower than expected in October to slip into negative territory, indicating below-trend growth. In corporate news, shares of Walt Disney Co (DIS +6.30%) rose after announcing former Chief Executive Officer (CEO) Bob Iger will be reappointed to the position, replacing Bob Chapek.
Treasuries were little changed, with the benchmark 10-year note climbing one basis points (0.01%) to 3.83%, while the 30-year bond dipped two basis points (0.02%) to 3.90%. The two-year note finished up two basis points (0.02%) to 4.55%. In commodities, West Texas Intermediate (WTI) crude fell 0.4% to $79.73/barrel amid ongoing global demand concerns due to China’s surge in COVID-19 cases. The benchmark pared losses after Saudi Arabia denied a report it is planning to discuss an increase in oil production at the December meeting of the Organization of Petroleum Exporting Countries and their allies (OPEC+). The U.S. Dollar Index climbed 0.8%, further pressuring commodity prices.
|
 Kenneth J. Gruneisen started out as a licensed stockbroker in August 1987, a couple of months prior to the historic stock market crash that took the Dow Jones Industrial Average down -22.6% in a single day. He has published daily fact-based fundamental and technical analysis on high-ranked stocks online for two decades. Through FACTBASEDINVESTING.COM, Kenneth provides educational articles, news, market commentary, and other information regarding proven investment systems that work in good times and bad.
Comments contained in the body of this report are technical opinions only and are not necessarily those of Gruneisen Growth Corp. The material herein has been obtained from sources believed to be reliable and accurate, however, its accuracy and completeness cannot be guaranteed. Our firm, employees, and customers may effect transactions, including transactions contrary to any recommendation herein, or have positions in the securities mentioned herein or options with respect thereto. Any recommendation contained in this report may not be suitable for all investors and it is not to be deemed an offer or solicitation on our part with respect to the purchase or sale of any securities. |
|
 |
Networking and Bank Indexes Eked Out Small Gains
Kenneth J. Gruneisen - Passed the CAN SLIM® Master's Exam
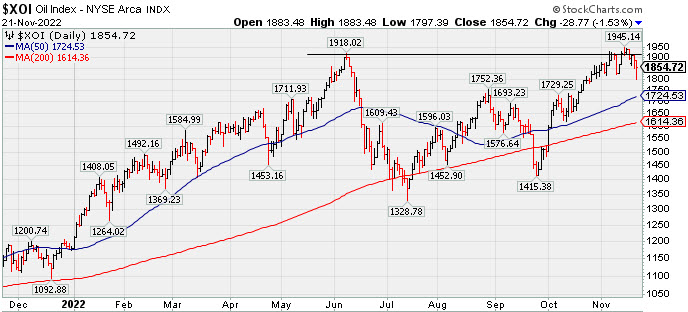
The Bank Index ($BKX +0.33%) eked out a small gain while the Broker/Dealer Index ($XBD -0.20%) and Retail Index ($RLX -0.47%) both lost ground. The Semiconductor Index ($SOX -1.77%) led the tech sector lower while the Biotech Index ($BTK -0.67%) suffered a smaller loss and the Networking Index ($NWX +0.22%) inched higher. The Oil Services Index ($OSX -2.29%) and Integrated Oil Index ($XOI -1.53%) both outpaced the Gold & Silver Index ($XAU -0.67%) to the downside.
PICTURED: The Integrated Oil Index ($XOI -1.53%) has been consolidating after briefly exceeding its June high.
| Oil Services |
$OSX |
83.06 |
-1.95 |
-2.29% |
+57.55% |
| Integrated Oil |
$XOI |
1,854.72 |
-28.77 |
-1.53% |
+57.42% |
| Semiconductor |
$SOX |
2,675.83 |
-48.20 |
-1.77% |
-32.19% |
| Networking |
$NWX |
812.58 |
+1.75 |
+0.22% |
-16.32% |
| Broker/Dealer |
$XBD |
468.08 |
-0.96 |
-0.20% |
-3.86% |
| Retail |
$RLX |
2,899.90 |
-13.79 |
-0.47% |
-31.39% |
| Gold & Silver |
$XAU |
113.04 |
-0.76 |
-0.67% |
-14.65% |
| Bank |
$BKX |
106.22 |
+0.35 |
+0.33% |
-19.67% |
| Biotech |
$BTK |
5,150.11 |
-34.86 |
-0.67% |
-6.67% |
|
|
|
 |
Perched Near High Still Awaiting Technical Breakout
Kenneth J. Gruneisen - Passed the CAN SLIM® Master's Exam
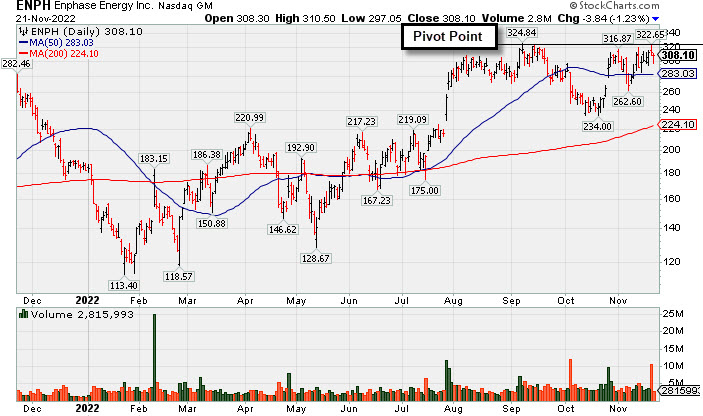
Enphase Energy Inc (ENPH -$3.84 or -1.23% to $308.10) recently has been challenging its 52-week high, still perched within striking distance of its pivot point. It faces no resistance due to overhead supply up to the $324 level. Disciplined investors might still be watching for a convincing technical breakout to confirm the presence of fresh institutional buying demand. Its 50-day moving average (DMA) line ($283) defines near-term support above the recent low ($262.60 on 11/07/22).
Fundamentals remain strong. It was last shown with an annotated graph on 10/28/22 under the headline, "Enphase Energy Rebound Above 50-Day Moving Average Helped Outlook". It has an Earnings Per Share Rating of 99. It reported Sep '22 quarterly earnings +108% on +81% sales revenues versus the year ago period, continuing its strong earnings history above the +25% minimum guideline (C criteria). It has a strong annual earnings (A criteria) history since FY '18 after years of losses.
The company hails from the Energy-Solar group which is currently ranked 2nd of the 197 Industry Groups (L criteria). The number of top-rated funds owning its shares rose from 1,068 in Dec '20 to 2,116 in Sep '22, a reassuring sign concerning the I criteria. Its current Up/Down Volume Ratio of 0.9 is an unbiased indication its shares have been under slight distributional pressure over the past 50 days.
|
|
|
Color Codes Explained :
Y - Better candidates highlighted by our
staff of experts.
G - Previously featured
in past reports as yellow but may no longer be buyable under the
guidelines.
***Last / Change / Volume data in this table is the closing quote data***
Symbol/Exchange
Company Name
Industry Group |
PRICE |
CHANGE
(%Change) |
Day High |
Volume
(% DAV)
(% 50 day avg vol) |
52 Wk Hi
% From Hi |
Featured
Date |
Price
Featured |
Pivot Featured |
|
Max Buy |
 ESQ
-
NASDAQ
ESQ
-
NASDAQ
Esquire Financial Hldgs
Finance-Commercial Loans
|
$45.18
|
+0.20
0.44% |
$45.48
|
11,638
40.13% of 50 DAV
50 DAV is 29,000
|
$48.13
-6.13%
|
10/18/2022
|
$40.02
|
PP = $39.95
|
|
MB = $41.95
|
Most Recent Note - 11/17/2022 12:35:07 PM
G - Volume totals have been average or lighter while consolidating. Well above prior highs in the $41 area which define support to watch along with its 50 DMA line ($40.60).
>>> FEATURED STOCK ARTICLE : New High With 6th Consecutive Volume-Driven Gain - 10/31/2022 |
View all notes |
Set NEW NOTE alert |
Company Profile |
SEC
News |
Chart |
Request a new note
C
A
S
I |
CCRN
-
NASDAQ
Cross Country Healthcare
DIVERSIFIED SERVICES - Staffing and Outsourcing Service
|
$34.47
|
-0.50
-1.43% |
$35.58
|
521,733
57.33% of 50 DAV
50 DAV is 910,000
|
$40.12
-14.08%
|
9/9/2022
|
$27.32
|
PP = $30.61
|
|
MB = $32.14
|
Most Recent Note - 11/18/2022 4:19:45 PM
Y - Posted a 5th consecutive gain today after a prompt rebound above the 50 DMA line ($32.28) helped its outlook improve. Prior highs in the $30.50 area define important near-term support to watch where more damaging losses would trigger a technical sell signal. Reported Sep '22 quarterly earnings +75% on +70% sales revenues versus the year ago period.
>>> FEATURED STOCK ARTICLE : Consolidating Above Prior Highs and Above 50-Day Moving Average - 11/8/2022 |
View all notes |
Set NEW NOTE alert |
Company Profile |
SEC
News |
Chart |
Request a new note
C
A
S
I |
CMC
-
NYSE
Commercial Metals Co
METALS and MINING - Steel and Iron
|
$47.42
|
-0.04
-0.08% |
$48.07
|
811,617
75.36% of 50 DAV
50 DAV is 1,077,000
|
$49.41
-4.03%
|
10/14/2022
|
$41.61
|
PP = $44.45
|
|
MB = $46.67
|
Most Recent Note - 11/17/2022 5:20:13 PM
G - Posted a gain today with light volume, hovering near its all-time high. Fundamentals remain strong. Prior high in the $44 area defines initial support to watch on pullbacks.
>>> FEATURED STOCK ARTICLE : Steel/Metal Products Firm Quietly Perched Near All Time High - 11/7/2022 |
View all notes |
Set NEW NOTE alert |
Company Profile |
SEC
News |
Chart |
Request a new note
C
A
S
I |
VRTX
-
NASDAQ
Vertex Pharmaceuticals
Medical-Biomed/Biotech
|
$316.20
|
+1.57
0.50% |
$318.00
|
1,147,439
78.16% of 50 DAV
50 DAV is 1,468,000
|
$318.38
-0.68%
|
10/24/2022
|
$308.47
|
PP = $306.05
|
|
MB = $321.35
|
Most Recent Note - 11/18/2022 4:23:00 PM
Y - Posted a 3rd consecutive gain today with light volume yet managed a best-ever close. Its 50 DMA line ($298) defines near-term support above recent intra-day lows in the $287-288 area. Recently reported Sep '22 quarterly earnings +14% on +18% sales revenues versus the year ago period, below the +25% minimum earnings guideline raising fundamental concerns (C criteria). Annual earnings (A criteria) history has been strong.
>>> FEATURED STOCK ARTICLE : Made Little Progress Following Breakout and Latest Earnings News - 11/16/2022 |
View all notes |
Set NEW NOTE alert |
Company Profile |
SEC
News |
Chart |
Request a new note
C
A
S
I |
GPK
-
NYSE
Graphic Packaging Hldg
CONSUMER NON-DURABLES - Packaging and Containers
|
$22.39
|
-0.14
-0.62% |
$22.47
|
3,165,150
106.97% of 50 DAV
50 DAV is 2,959,000
|
$24.07
-6.98%
|
10/25/2022
|
$22.75
|
PP = $24.17
|
|
MB = $25.38
|
Most Recent Note - 11/17/2022 5:15:29 PM
Y - Volume totals are cooling while consolidating above its 50 DMA line ($21.59). More damaging losses would raise concerns and trigger a technical sell signal. Subsequent gains above the pivot point backed by at least +40% above average volume may trigger a technical buy signal. Fundamentals remain strong. See the latest FSU analysis for more details and a new annotated graph.
>>> FEATURED STOCK ARTICLE : Consolidating Above 50-Day Moving Average Still Perched Near High - 11/17/2022 |
View all notes |
Set NEW NOTE alert |
Company Profile |
SEC
News |
Chart |
Request a new note
C
A
S
I |
Symbol/Exchange
Company Name
Industry Group |
PRICE |
CHANGE
(%Change) |
Day High |
Volume
(% DAV)
(% 50 day avg vol) |
52 Wk Hi
% From Hi |
Featured
Date |
Price
Featured |
Pivot Featured |
|
Max Buy |
CBZ
-
NYSE
C B I Z Inc
Comml Svcs-Consulting
|
$48.87
|
+0.12
0.25% |
$49.01
|
215,235
77.70% of 50 DAV
50 DAV is 277,000
|
$50.57
-3.36%
|
10/26/2022
|
$47.83
|
PP = $48.57
|
|
MB = $51.00
|
Most Recent Note - 11/18/2022 4:21:08 PM
Y - Gapped up today for a small gain with light volume yet rebounded above its pivot point. Its 50 DMA line ($45.85) and recent low define important near-term support. Recently reported Sep '22 quarterly earnings +24% on +28% sales revenues versus the year ago period.
>>> FEATURED STOCK ARTICLE : Gapped Up and Rebounded Above Pivot Point - 11/18/2022 |
View all notes |
Set NEW NOTE alert |
Company Profile |
SEC
News |
Chart |
Request a new note
C
A
S
I |
ENPH
-
NASDAQ
Enphase Energy Inc
Energy-Solar
|
$308.10
|
-3.84
-1.23% |
$310.50
|
2,780,217
67.46% of 50 DAV
50 DAV is 4,121,000
|
$324.84
-5.15%
|
10/26/2022
|
$301.55
|
PP = $324.94
|
|
MB = $341.19
|
 Most Recent Note - 11/21/2022 6:48:45 PM
Y - Remains perched within striking distance of its pivot point. Faces no resistance due to overhead supply up to the $324 level. Its 50 DMA line ($283) defines near-term support above the recent low ($262.60 on 11/07/22). Fundamentals remain strong. See the latest FSU analysis for more details and a new annotated graph.
>>> FEATURED STOCK ARTICLE : Perched Near High Still Awaiting Technical Breakout - 11/21/2022 |
View all notes |
Set NEW NOTE alert |
Company Profile |
SEC
News |
Chart |
Request a new note
C
A
S
I |
HRMY
-
NASDAQ
Harmony Biosciences Holdings
Medical-Biomed/Biotech
|
$57.28
|
+0.27
0.47% |
$57.63
|
249,233
46.94% of 50 DAV
50 DAV is 531,000
|
$61.55
-6.94%
|
11/1/2022
|
$55.31
|
PP = $57.23
|
|
MB = $60.09
|
Most Recent Note - 11/18/2022 12:59:28 PM
Y - Managed a "positive reversal" on the prior session after early weakness. Recently testing near prior highs in the $57 area that define initial support to watch above its 50 DMA line ($50.10).
>>> FEATURED STOCK ARTICLE : Volume Heavy Behind Technical Breakout After Earnings - 11/1/2022 |
View all notes |
Set NEW NOTE alert |
Company Profile |
SEC
News |
Chart |
Request a new note
C
A
S
I |
CLH
-
NYSE
Clean Harbors Inc
Pollution Control
|
$118.03
|
+1.03
0.88% |
$118.25
|
224,450
49.55% of 50 DAV
50 DAV is 453,000
|
$124.49
-5.19%
|
11/2/2022
|
$121.59
|
PP = $124.59
|
|
MB = $130.82
|
Most Recent Note - 11/21/2022 6:53:29 PM
Y - Color code is changed to yellow after rebounding above its 50 DMA line ($115.70) while a streak of 5 consecutive gains has helped its outlook to improve. Fundamentals remain strong after reporting Sep '22 quarterly earnings +113% on +43% sales revenues versus the year ago period.
>>> FEATURED STOCK ARTICLE : Testing 50 Day Moving Average Line After Forming New Base - 11/2/2022 |
View all notes |
Set NEW NOTE alert |
Company Profile |
SEC
News |
Chart |
Request a new note
C
A
S
I |
NPO
-
NYSE
Enpro Industries Inc
Machinery-Gen Industrial
|
$118.29
|
-0.20
-0.17% |
$118.94
|
173,143
171.43% of 50 DAV
50 DAV is 101,000
|
$127.67
-7.35%
|
11/4/2022
|
$119.06
|
PP = $117.73
|
|
MB = $123.62
|
Most Recent Note - 11/21/2022 6:51:28 PM
Y - Ended lower with higher volume today for a 4th consecutive small loss, still remaining above its pivot point. Reported Sep '22 quarterly earnings +65% on +34% sales revenues versus the year ago period, its 3rd strong quarterly comparison above the +25% minimum earnings guideline (C criteria), helping it better match the winning models of the fact-based investment system. Annual earnings growth has been steady even through the pandemic.
>>> FEATURED STOCK ARTICLE : Finished Strong After Highlighted in Friday Mid-Day Report - 11/4/2022 |
View all notes |
Set NEW NOTE alert |
Company Profile |
SEC
News |
Chart |
Request a new note
C
A
S
I |
Symbol/Exchange
Company Name
Industry Group |
PRICE |
CHANGE
(%Change) |
Day High |
Volume
(% DAV)
(% 50 day avg vol) |
52 Wk Hi
% From Hi |
Featured
Date |
Price
Featured |
Pivot Featured |
|
Max Buy |
DGII
-
NASDAQ
Digi International Inc
COMPUTER HARDWARE - Networking and Communication Dev
|
$41.74
|
+0.21
0.51% |
$43.36
|
604,695
146.06% of 50 DAV
50 DAV is 414,000
|
$42.04
-0.71%
|
11/10/2022
|
$41.82
|
PP = $40.96
|
|
MB = $43.01
|
Most Recent Note - 11/21/2022 12:34:55 PM
Y - Hitting another new high with today's gain. Recently wedged above the pivot point cited based on its 10/31/22 high plus 10 cents after forming an advanced "ascending base" pattern. Subsequent gains above the pivot point backed by at least +40% above average volume are needed to confirm a proper technical buy signal. Reported Sep '22 quarterly earnings +80% versus the year ago period, its 3rd strong quarterly comparison well above the +25% minimum earnings guideline (C criteria), helping it better match the fact-based investment system's winning models. Annual earnings (A criteria) history has been strong after a downturn in FY '17-18.
>>> FEATURED STOCK ARTICLE : Finish Below Pivot Point Leaves Disciplined Investors Waiting - 11/10/2022 |
View all notes |
Set NEW NOTE alert |
Company Profile |
SEC
News |
Chart |
Request a new note
C
A
S
I |
GFF
-
NYSE
Griffon Corporation
MATERIALS and CONSTRUCTION - General Building Materials
|
$35.28
|
-0.88
-2.43% |
$36.37
|
507,055
141.24% of 50 DAV
50 DAV is 359,000
|
$36.17
-2.46%
|
11/10/2022
|
$34.13
|
PP = $35.02
|
|
MB = $36.77
|
Most Recent Note - 11/21/2022 12:40:45 PM
Y - Perched at its 52-weeek high today after rallying above the pivot point with a big volume-driven gain on the prior session. A gain and strong close above the pivot point backed by +220% above average volume triggered a technical buy signal. Last week it briefly undercut its 50 DMA line ($31.53) which defines important near-term support. Reported Sep '22 quarterly earnings +230% on +24% sales revenues versus the year ago period.
>>> FEATURED STOCK ARTICLE : Griffon Perched Near 52-Week High After 9-Week Base - 11/11/2022 |
View all notes |
Set NEW NOTE alert |
Company Profile |
SEC
News |
Chart |
Request a new note
C
A
S
I |
ANET
-
NYSE
Arista Networks Inc
Computer-Networking
|
$134.61
|
-0.87
-0.64% |
$136.95
|
1,259,867
50.62% of 50 DAV
50 DAV is 2,489,000
|
$148.57
-9.40%
|
11/14/2022
|
$132.05
|
PP = $133.70
|
|
MB = $140.39
|
Most Recent Note - 11/18/2022 4:26:30 PM
Y - Posted a gain with light volume for its best close since April 5th, wedging higher after a cup-with-handle base. Subsequent gains and a close above the pivot point backed by at least +40% above average volume are needed to trigger a proper technical buy signal. Faces some resistance due to overhead supply up to the $148 level. Fundamentals are strong.
>>> FEATURED STOCK ARTICLE : Finished in Middle of Intra-Day Range After Challenging Pivot Point - 11/14/2022 |
View all notes |
Set NEW NOTE alert |
Company Profile |
SEC
News |
Chart |
Request a new note
C
A
S
I |
|
|
|
THESE ARE NOT BUY RECOMMENDATIONS!
Comments contained in the body of this report are technical
opinions only. The material herein has been obtained
from sources believed to be reliable and accurate, however,
its accuracy and completeness cannot be guaranteed.
This site is not an investment advisor, hence it does
not endorse or recommend any securities or other investments.
Any recommendation contained in this report may not
be suitable for all investors and it is not to be deemed
an offer or solicitation on our part with respect to
the purchase or sale of any securities. All trademarks,
service marks and trade names appearing in this report
are the property of their respective owners, and are
likewise used for identification purposes only.
This report is a service available
only to active Paid Premium Members.
You may opt-out of receiving report notifications
at any time. Questions or comments may be submitted
by writing to Premium Membership Services 665 S.E. 10 Street, Suite 201 Deerfield Beach, FL 33441-5634 or by calling 1-800-965-8307
or 954-785-1121.
|
|
|