You are not logged in.
This means you
CAN ONLY VIEW reports that were published prior to Monday, March 24, 2025.
You
MUST UPGRADE YOUR MEMBERSHIP if you want to see any current reports.
AFTER MARKET UPDATE - MONDAY, NOVEMBER 28TH, 2022
Previous After Market Report Next After Market Report >>>
|
|
|
|
DOW |
-497.57 |
33,849.46 |
-1.45% |
|
Volume |
824,330,046 |
+131% |
|
Volume |
4,208,736,000 |
+97% |
|
NASDAQ |
-176.86 |
11,049.50 |
-1.58% |
|
Advancers |
663 |
22% |
|
Advancers |
1,239 |
27% |
|
S&P 500 |
-62.18 |
3,963.94 |
-1.54% |
|
Decliners |
2,392 |
78% |
|
Decliners |
3,420 |
73% |
|
Russell 2000 |
-38.23 |
1,830.96 |
-2.05% |
|
52 Wk Highs |
47 |
|
|
52 Wk Highs |
118 |
|
|
S&P 600 |
-23.61 |
1,208.83 |
-1.92% |
|
52 Wk Lows |
59 |
|
|
52 Wk Lows |
189 |
|
|
 |
Breadth Negative as Major Indices Fell With Higher Volume
Kenneth J. Gruneisen - Passed the CAN SLIM® Master's Exam
The Dow lost 497 points, while the Nasdaq Composite shed 1.6%. The S&P 500 fell 1.5% with all sectors ending in negative territory. Volume totals were higher than the prior shortened session on the NYSE and on the Nasdaq exchange. Breadth was negative as decliners led advancers by more than a 3-1 margin on the NYSE and nearly 3-1 on the Nasdaq exchange. There were 16 high-ranked companies from the Leaders List that hit new 52-week highs and were listed on the BreakOuts Page, versus the total of 32 on the prior session. New 52-week lows outnumbered new 52-week highs on the NYSE and on the Nasdaq exchange. The market is in a confirmed uptrend (M criteria). Healthy leadership (new 52-week highs totals) has continued to help the rally be productive. Only stocks meeting all key-criteria of the fact-based investment system should be considered as buy candidates.
Chart courtesy of www.stockcharts.com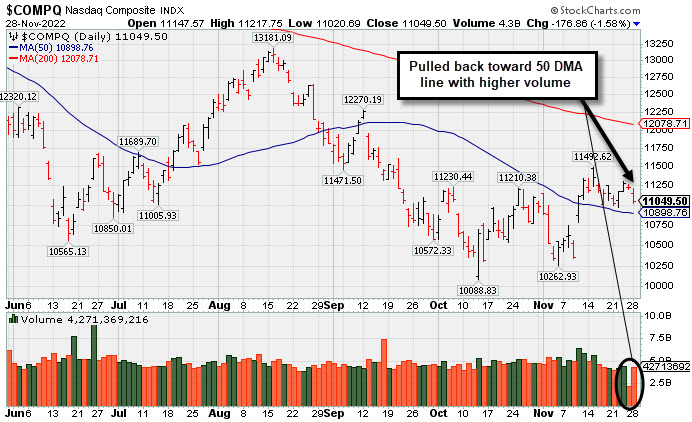 PICTURED: The Nasdaq Composite Index pulled back toward its 50-day moving average (DMA) line with a loss on higher volume. Of the 3 major indices only the Dow is in "healthy shape" above its 200 DMA line.
U.S. equities finished lower Monday as unrest stemming from China’s COVID-19 restrictions weighed on investor sentiment. Market participants are also looking ahead to Federal Reserve (Fed) Chairman Jerome Powell’s remarks on Wednesday and the November jobs report scheduled to be released on Friday. Investors will parse through the jobs data for any indication of a softening labor market.
In the central bank space, comments from St. Louis Fed President James Bullard and New York Fed President John Williams also pressured sentiment. Bullard noted markets are not accommodating for the possibility of higher rates, while Williams reiterated the need to continue to raise rates to curb inflation. On the data front, the Dallas Fed Manufacturing Activity index came in at -14.4 in November, better than the expected -21 print.
Treasuries were little changed, with the yield on the benchmark 10-year note dipping one basis point (0.01%) to 3.68%, while the 30-year bond yield shed two basis points (0.02%) to 3.73%. The yield on the more policy-sensitive two-year note fell two basis point (0.02%) to 4.45%. In commodities, West Texas Intermediate (WTI) crude is reversed earlier losses to climb 0.8% to $76.85/barrel. The domestic benchmark rebounded amid reports the Organization of Petroleum Exporting Countries and their allies (OPEC+) is considering another cut to oil production to balance markets. The U.S. Dollar Index added 0.7% as investors flocked to the perceived safe-haven asset.
|
 Kenneth J. Gruneisen started out as a licensed stockbroker in August 1987, a couple of months prior to the historic stock market crash that took the Dow Jones Industrial Average down -22.6% in a single day. He has published daily fact-based fundamental and technical analysis on high-ranked stocks online for two decades. Through FACTBASEDINVESTING.COM, Kenneth provides educational articles, news, market commentary, and other information regarding proven investment systems that work in good times and bad.
Comments contained in the body of this report are technical opinions only and are not necessarily those of Gruneisen Growth Corp. The material herein has been obtained from sources believed to be reliable and accurate, however, its accuracy and completeness cannot be guaranteed. Our firm, employees, and customers may effect transactions, including transactions contrary to any recommendation herein, or have positions in the securities mentioned herein or options with respect thereto. Any recommendation contained in this report may not be suitable for all investors and it is not to be deemed an offer or solicitation on our part with respect to the purchase or sale of any securities. |
|
 |
Commodity-Linked Groups, Tech, and Financials Fell
Kenneth J. Gruneisen - Passed the CAN SLIM® Master's Exam
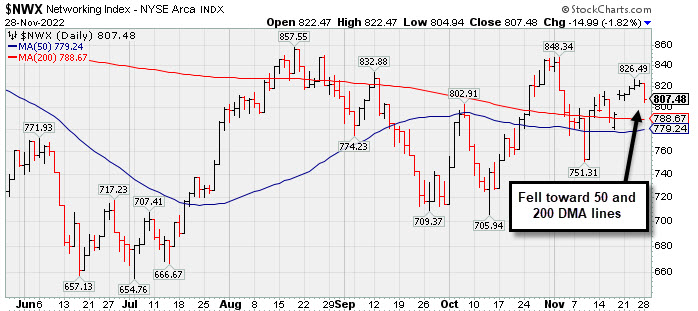
The Bank Index ($BKX -2.27%) and Broker/Dealer Index ($XBD -1.52%) both lost ground and the Retail Index ($RLX -0.42%) edged lower. The Semiconductor Index ($SOX -2.63%) led the tech sector lower while the Networking Index ($NWX -1.82%) and Biotech Index ($BTK -0.71%) also lost ground. Commodity-linked groups were weak as the Gold & Silver Index ($XAU -4.15%) outpaced the Oil Services Index ($OSX -2.90%) and Integrated Oil Index ($XOI -2.68%) to the downside.
PICTURED: The Networking Index ($NWX -1.82%) pulled back toward its 50-day and 200-day moving average (DMA) lines.
| Oil Services |
$OSX |
80.53 |
-2.41 |
-2.90% |
+52.76% |
| Integrated Oil |
$XOI |
1,840.30 |
-50.68 |
-2.68% |
+56.20% |
| Semiconductor |
$SOX |
2,678.78 |
-72.49 |
-2.63% |
-32.12% |
| Networking |
$NWX |
807.48 |
-14.99 |
-1.82% |
-16.85% |
| Broker/Dealer |
$XBD |
469.08 |
-7.24 |
-1.52% |
-3.65% |
| Retail |
$RLX |
2,932.14 |
-12.42 |
-0.42% |
-30.62% |
| Gold & Silver |
$XAU |
113.36 |
-4.90 |
-4.15% |
-14.42% |
| Bank |
$BKX |
105.54 |
-2.45 |
-2.27% |
-20.18% |
| Biotech |
$BTK |
5,180.94 |
-37.24 |
-0.71% |
-6.12% |
|
|
|
 |
Harmony Still Hovering Near All-Time High
Kenneth J. Gruneisen - Passed the CAN SLIM® Master's Exam
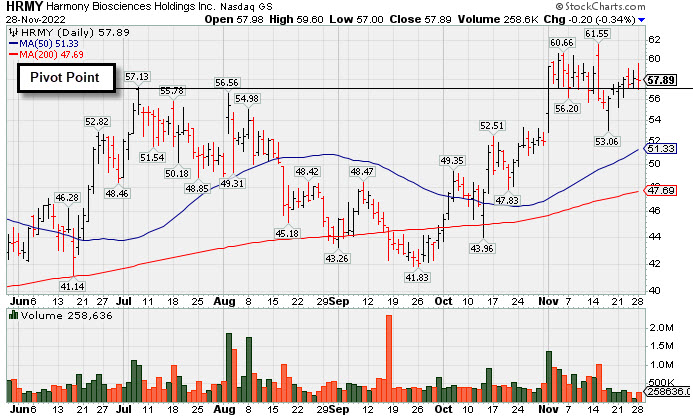
Harmony Biosciences Hldg (HRMY -$0.20 or -0.34% to $57.89) pulled back today after wedging higher with recent gains lacking great volume conviction. The 11/17/22 low ($53.06) defines initial support to watch above its 50-day moving average DMA line ($51.33).
HRMY was highlighted in yellow with new pivot point cited based on its 7/07/22 high plus 10 cents in the 11/01/22 mid-day report (read here) . Bullish action came after it reported Sep '22 quarterly earnings +132% on +45% sales revenues versus the year ago period. It powered to a new 52-week high with a considerable gain and strong close above the pivot point backed by at least +200% above average volume triggering a technical buy signal. It was last shown in this FSU section on 11/01/22 with detailed analysis and an annotated graph under the headline, "Volume Heavy Behind Technical Breakout After Earnings".
Prior quarterly comparisons were strong, well above the +25% minimum earnings guideline (C criteria), and it has an 80 Earnings Per Share Rating. It hails from the Medical-Biomed/Biotech industry group, currently ranked 22nd on the 197 Industry Groups list (L criteria). Its annual earnings history (A criteria) is limited.
HRMY completed its $24 IPO on 8/19/20. Its small supply of only 23.1 million shares (S criteria) in the public float can contribute to greater price volatility in the event of institutional buying or selling. The number of top-rated funds owning its shares rose from 208 in Sep '21 to 446 in Sep '22, a reassuring sign concerning the I criteria. Its current Up/Down Volume Ratio of 1.0 is an unbiased indication its shares have been neutral concerning accumulation/distribution over the past 50 days.
|
|
|
Color Codes Explained :
Y - Better candidates highlighted by our
staff of experts.
G - Previously featured
in past reports as yellow but may no longer be buyable under the
guidelines.
***Last / Change / Volume data in this table is the closing quote data***
Symbol/Exchange
Company Name
Industry Group |
PRICE |
CHANGE
(%Change) |
Day High |
Volume
(% DAV)
(% 50 day avg vol) |
52 Wk Hi
% From Hi |
Featured
Date |
Price
Featured |
Pivot Featured |
|
Max Buy |
 ESQ
-
NASDAQ
ESQ
-
NASDAQ
Esquire Financial Hldgs
Finance-Commercial Loans
|
$43.53
|
-1.57
-3.48% |
$45.10
|
14,713
50.73% of 50 DAV
50 DAV is 29,000
|
$48.13
-9.56%
|
10/18/2022
|
$40.02
|
PP = $39.95
|
|
MB = $41.95
|
 Most Recent Note - 11/28/2022 9:04:27 PM
G - Suffered a 3rd consecutive loss today after a "negative reversal" on 11/23/22 with above average volume. Prior highs and its 50 DMA line coincide in the $41 area defining important near-term support to watch on pullbacks.
>>> FEATURED STOCK ARTICLE : Pulled Back Following "Negative Reversal" at All-Time High - 11/25/2022 |
View all notes |
Set NEW NOTE alert |
Company Profile |
SEC
News |
Chart |
Request a new note
C
A
S
I |
CCRN
-
NASDAQ
Cross Country Healthcare
DIVERSIFIED SERVICES - Staffing and Outsourcing Service
|
$35.56
|
+0.24
0.68% |
$36.56
|
475,128
56.56% of 50 DAV
50 DAV is 840,000
|
$40.12
-11.37%
|
9/9/2022
|
$27.32
|
PP = $30.61
|
|
MB = $32.14
|
Most Recent Note - 11/28/2022 9:08:35 PM
Y - Posted another small gain today with light volume, consolidating above its 50 DMA line ($32.99). Reported Sep '22 quarterly earnings +75% on +70% sales revenues versus the year ago period.
>>> FEATURED STOCK ARTICLE : Consolidating Above Prior Highs and Above 50-Day Moving Average - 11/8/2022 |
View all notes |
Set NEW NOTE alert |
Company Profile |
SEC
News |
Chart |
Request a new note
C
A
S
I |
CMC
-
NYSE
Commercial Metals Co
METALS and MINING - Steel and Iron
|
$47.71
|
-0.26
-0.54% |
$48.14
|
499,122
48.46% of 50 DAV
50 DAV is 1,030,000
|
$49.41
-3.44%
|
10/14/2022
|
$41.61
|
PP = $44.45
|
|
MB = $46.67
|
Most Recent Note - 11/28/2022 9:10:16 PM
G - Pulled back for a 3rd consecutive small loss today with below average volume. Fundamentals remain strong. Prior high in the $44 area defines initial support to watch above its 50 DMA line ($42.67).
>>> FEATURED STOCK ARTICLE : Steel/Metal Products Firm Quietly Perched Near All Time High - 11/7/2022 |
View all notes |
Set NEW NOTE alert |
Company Profile |
SEC
News |
Chart |
Request a new note
C
A
S
I |
VRTX
-
NASDAQ
Vertex Pharmaceuticals
Medical-Biomed/Biotech
|
$315.30
|
+2.32
0.74% |
$320.93
|
1,111,950
77.17% of 50 DAV
50 DAV is 1,441,000
|
$323.61
-2.57%
|
10/24/2022
|
$308.47
|
PP = $306.05
|
|
MB = $321.35
|
Most Recent Note - 11/25/2022 2:55:05 PM
Y - Pulled back for a 2nd consecutive loss today with lighter volume. Its 50 DMA line ($300.44) defines near-term support above recent intra-day lows in the $287-288 area. Recently reported Sep '22 quarterly earnings +14% on +18% sales revenues versus the year ago period, below the +25% minimum earnings guideline raising fundamental concerns (C criteria). Annual earnings (A criteria) history has been strong.
>>> FEATURED STOCK ARTICLE : Made Little Progress Following Breakout and Latest Earnings News - 11/16/2022 |
View all notes |
Set NEW NOTE alert |
Company Profile |
SEC
News |
Chart |
Request a new note
C
A
S
I |
GPK
-
NYSE
Graphic Packaging Hldg
CONSUMER NON-DURABLES - Packaging and Containers
|
$22.34
|
-0.44
-1.93% |
$22.69
|
1,756,517
58.92% of 50 DAV
50 DAV is 2,981,000
|
$24.07
-7.19%
|
10/25/2022
|
$22.75
|
PP = $24.17
|
|
MB = $25.38
|
Most Recent Note - 11/28/2022 9:07:39 PM
Y - Pulled back for a quiet loss today. Volume totals are cooling while consolidating above its 50 DMA line ($21.56). More damaging losses would raise concerns and trigger a technical sell signal. Subsequent gains above the pivot point backed by at least +40% above average volume may trigger a technical buy signal. Fundamentals remain strong.
>>> FEATURED STOCK ARTICLE : Consolidating Above 50-Day Moving Average Still Perched Near High - 11/17/2022 |
View all notes |
Set NEW NOTE alert |
Company Profile |
SEC
News |
Chart |
Request a new note
C
A
S
I |
Symbol/Exchange
Company Name
Industry Group |
PRICE |
CHANGE
(%Change) |
Day High |
Volume
(% DAV)
(% 50 day avg vol) |
52 Wk Hi
% From Hi |
Featured
Date |
Price
Featured |
Pivot Featured |
|
Max Buy |
CBZ
-
NYSE
C B I Z Inc
Comml Svcs-Consulting
|
$49.13
|
-0.69
-1.38% |
$49.80
|
121,000
43.84% of 50 DAV
50 DAV is 276,000
|
$50.57
-2.85%
|
10/26/2022
|
$47.83
|
PP = $48.57
|
|
MB = $51.00
|
Most Recent Note - 11/25/2022 2:49:22 PM
Y - Posted a small gain with light volume today as it inched further above its pivot point and challenged its 52-week high. Its 50 DMA line ($46.27) and recent low define important near-term support. Recently reported Sep '22 quarterly earnings +24% on +28% sales revenues versus the year ago period.
>>> FEATURED STOCK ARTICLE : Gapped Up and Rebounded Above Pivot Point - 11/18/2022 |
View all notes |
Set NEW NOTE alert |
Company Profile |
SEC
News |
Chart |
Request a new note
C
A
S
I |
ENPH
-
NASDAQ
Enphase Energy Inc
Energy-Solar
|
$312.21
|
-7.21
-2.26% |
$323.79
|
2,661,319
66.58% of 50 DAV
50 DAV is 3,997,000
|
$324.84
-3.89%
|
10/26/2022
|
$301.55
|
PP = $324.94
|
|
MB = $341.19
|
Most Recent Note - 11/28/2022 9:03:18 PM
Y - Pulled back today with below average volume, yet still perched within close striking distance of its pivot point. Faces no resistance due to overhead supply. Its 50 DMA line ($283) defines near-term support above the recent low ($262.60 on 11/07/22). Fundamentals remain strong.
>>> FEATURED STOCK ARTICLE : Perched Near High Still Awaiting Technical Breakout - 11/21/2022 |
View all notes |
Set NEW NOTE alert |
Company Profile |
SEC
News |
Chart |
Request a new note
C
A
S
I |
HRMY
-
NASDAQ
Harmony Biosciences Holdings
Medical-Biomed/Biotech
|
$57.89
|
-0.20
-0.34% |
$59.60
|
258,636
50.70% of 50 DAV
50 DAV is 510,100
|
$61.55
-5.95%
|
11/1/2022
|
$55.31
|
PP = $57.23
|
|
MB = $60.09
|
Most Recent Note - 11/28/2022 8:58:37 PM
Y - Still hovering near its all-time high. The 11/17/22 low ($53.06) defines initial support to watch above its 50 DMA line ($51.33). See the latest FSU analysis for more details and a new annotated graph.
>>> FEATURED STOCK ARTICLE : Harmony Still Hovering Near All-Time High - 11/28/2022 |
View all notes |
Set NEW NOTE alert |
Company Profile |
SEC
News |
Chart |
Request a new note
C
A
S
I |
CLH
-
NYSE
Clean Harbors Inc
Pollution Control
|
$119.63
|
-3.74
-3.03% |
$123.22
|
601,642
139.27% of 50 DAV
50 DAV is 432,000
|
$124.49
-3.90%
|
11/2/2022
|
$121.59
|
PP = $124.59
|
|
MB = $130.82
|
Most Recent Note - 11/28/2022 9:00:10 PM
Y - Pulled back today with above average volume breaking a streak of 8 consecutive gains approaching its prior highs and pivot point. Fundamentals remain strong after reporting Sep '22 quarterly earnings +113% on +43% sales revenues versus the year ago period.
>>> FEATURED STOCK ARTICLE : Testing 50 Day Moving Average Line After Forming New Base - 11/2/2022 |
View all notes |
Set NEW NOTE alert |
Company Profile |
SEC
News |
Chart |
Request a new note
C
A
S
I |
NPO
-
NYSE
Enpro Industries Inc
Machinery-Gen Industrial
|
$116.22
|
-3.33
-2.79% |
$119.00
|
50,317
49.33% of 50 DAV
50 DAV is 102,000
|
$127.67
-8.97%
|
11/4/2022
|
$119.06
|
PP = $117.73
|
|
MB = $123.62
|
Most Recent Note - 11/25/2022 2:53:48 PM
Y - Volume totals have been cooling while stubbornly holding its ground above the pivot point cited. Fundamentals remain strong.
>>> FEATURED STOCK ARTICLE : Finished Strong After Highlighted in Friday Mid-Day Report - 11/4/2022 |
View all notes |
Set NEW NOTE alert |
Company Profile |
SEC
News |
Chart |
Request a new note
C
A
S
I |
Symbol/Exchange
Company Name
Industry Group |
PRICE |
CHANGE
(%Change) |
Day High |
Volume
(% DAV)
(% 50 day avg vol) |
52 Wk Hi
% From Hi |
Featured
Date |
Price
Featured |
Pivot Featured |
|
Max Buy |
DGII
-
NASDAQ
Digi International Inc
COMPUTER HARDWARE - Networking and Communication Dev
|
$41.01
|
-1.38
-3.26% |
$42.19
|
230,941
56.60% of 50 DAV
50 DAV is 408,000
|
$43.68
-6.11%
|
11/10/2022
|
$41.82
|
PP = $40.96
|
|
MB = $43.01
|
Most Recent Note - 11/25/2022 2:57:40 PM
Y - Volume totals have been cooling while stubbornly holding its ground at its all-time high. Recently wedged above the pivot point cited based on its 10/31/22 high plus 10 cents after forming an advanced "ascending base" pattern. Subsequent gains above the pivot point backed by at least +40% above average volume are needed to confirm a proper technical buy signal. Fundamentals remain strong.
>>> FEATURED STOCK ARTICLE : Finish Below Pivot Point Leaves Disciplined Investors Waiting - 11/10/2022 |
View all notes |
Set NEW NOTE alert |
Company Profile |
SEC
News |
Chart |
Request a new note
C
A
S
I |
GFF
-
NYSE
Griffon Corporation
MATERIALS and CONSTRUCTION - General Building Materials
|
$35.00
|
-1.49
-4.08% |
$36.15
|
530,567
144.96% of 50 DAV
50 DAV is 366,000
|
$36.75
-4.76%
|
11/10/2022
|
$34.13
|
PP = $35.02
|
|
MB = $36.77
|
Most Recent Note - 11/28/2022 9:06:25 PM
Y - Pulled back from its 52-week high with today's loss backed by above average volume. Prior highs in the $34 area define initial support to watch above its 50 DMA line ($31.81). Reported Sep '22 quarterly earnings +230% on +24% sales revenues versus the year ago period.
>>> FEATURED STOCK ARTICLE : Griffon Perched Near 52-Week High After 9-Week Base - 11/11/2022 |
View all notes |
Set NEW NOTE alert |
Company Profile |
SEC
News |
Chart |
Request a new note
C
A
S
I |
ANET
-
NYSE
Arista Networks Inc
Computer-Networking
|
$133.70
|
-2.06
-1.52% |
$135.93
|
1,373,605
56.18% of 50 DAV
50 DAV is 2,445,000
|
$148.57
-10.01%
|
11/14/2022
|
$132.05
|
PP = $133.70
|
|
MB = $140.39
|
Most Recent Note - 11/25/2022 2:47:36 PM
Y - Held its ground stubbornly as it wedged higher after a cup-with-handle base. Subsequent gains and a close above the pivot point backed by at least +40% above average volume are needed to trigger a proper technical buy signal. Faces some resistance due to overhead supply up to the $148 level. Fundamentals are strong.
>>> FEATURED STOCK ARTICLE : Finished in Middle of Intra-Day Range After Challenging Pivot Point - 11/14/2022 |
View all notes |
Set NEW NOTE alert |
Company Profile |
SEC
News |
Chart |
Request a new note
C
A
S
I |
CPRX
-
NASDAQ
Catalyst Pharma Inc
Medical-Biomed/Biotech
|
$16.49
|
-0.48
-2.83% |
$18.39
|
3,871,914
159.73% of 50 DAV
50 DAV is 2,424,000
|
$17.76
-7.15%
|
11/22/2022
|
$17.38
|
PP = $16.66
|
|
MB = $17.49
|
Most Recent Note - 11/28/2022 12:25:30 PM
Y - Perched at its all-time high today. Rallied from a 9-week cup-with-handle base with a big gain backed above average volume noted. Reported Sep '22 quarterly earnings +86% on +59% sales revenues versus the year ago period. Disciplined investors avoid chasing stocks that are extended more than +5% above prior highs or the "max buy" level.
>>> FEATURED STOCK ARTICLE : Breakout From Cup-With-Handle With 90% Above Average Volume - 11/22/2022 |
View all notes |
Set NEW NOTE alert |
Company Profile |
SEC
News |
Chart |
Request a new note
C
A
S
I |
CLFD
-
NASDAQ
Clearfield Inc
TELECOMMUNICATIONS - Cables / Satalite Equipment
|
$121.22
|
-9.60
-7.34% |
$131.95
|
484,512
170.00% of 50 DAV
50 DAV is 285,000
|
$134.90
-10.14%
|
11/23/2022
|
$131.27
|
PP = $130.11
|
|
MB = $136.62
|
Most Recent Note - 11/28/2022 9:02:11 PM
Y - Pulled back today with higher volume, retreating from its 52-week high after 6 consecutive gains. Color code was changed to yellow with pivot point cited based on its 8/25/22 high plus 10 cents. A gain and close above the pivot point backed by at least +40% above average volume may trigger a new technical buy signal. Gapped up on 11/18/22 for a considerable gain, rebounding from below its 50 DMA line ($103.54). It found support above its 200 DMA line and showed resilience after dropped from the Featured Stocks list on 11/08/22. Reported Sep '22 quarterly earnings +130% on +110% sales revenues versus the year ago period.
>>> FEATURED STOCK ARTICLE : Hit New High But Encountered Distributional Pressure - 11/23/2022 |
View all notes |
Set NEW NOTE alert |
Company Profile |
SEC
News |
Chart |
Request a new note
C
A
S
I |
Symbol/Exchange
Company Name
Industry Group |
PRICE |
CHANGE
(%Change) |
Day High |
Volume
(% DAV)
(% 50 day avg vol) |
52 Wk Hi
% From Hi |
Featured
Date |
Price
Featured |
Pivot Featured |
|
Max Buy |
|
|
|
THESE ARE NOT BUY RECOMMENDATIONS!
Comments contained in the body of this report are technical
opinions only. The material herein has been obtained
from sources believed to be reliable and accurate, however,
its accuracy and completeness cannot be guaranteed.
This site is not an investment advisor, hence it does
not endorse or recommend any securities or other investments.
Any recommendation contained in this report may not
be suitable for all investors and it is not to be deemed
an offer or solicitation on our part with respect to
the purchase or sale of any securities. All trademarks,
service marks and trade names appearing in this report
are the property of their respective owners, and are
likewise used for identification purposes only.
This report is a service available
only to active Paid Premium Members.
You may opt-out of receiving report notifications
at any time. Questions or comments may be submitted
by writing to Premium Membership Services 665 S.E. 10 Street, Suite 201 Deerfield Beach, FL 33441-5634 or by calling 1-800-965-8307
or 954-785-1121.
|
|
|