You are not logged in.
This means you
CAN ONLY VIEW reports that were published prior to Tuesday, March 25, 2025.
You
MUST UPGRADE YOUR MEMBERSHIP if you want to see any current reports.
AFTER MARKET UPDATE - FRIDAY, DECEMBER 2ND, 2022
Previous After Market Report Next After Market Report >>>
|
|
|
|
DOW |
+34.87 |
34,429.88 |
+0.10% |
|
Volume |
826,553,795 |
-13% |
|
Volume |
4,481,565,000 |
-12% |
|
NASDAQ |
-20.95 |
11,461.50 |
-0.18% |
|
Advancers |
1,636 |
54% |
|
Advancers |
2,565 |
56% |
|
S&P 500 |
-4.87 |
4,071.70 |
-0.12% |
|
Decliners |
1,385 |
46% |
|
Decliners |
1,997 |
44% |
|
Russell 2000 |
+11.16 |
1,892.84 |
+0.59% |
|
52 Wk Highs |
89 |
|
|
52 Wk Highs |
98 |
|
|
S&P 600 |
+4.94 |
1,245.36 |
+0.40% |
|
52 Wk Lows |
44 |
|
|
52 Wk Lows |
128 |
|
|
 |
Major Averages Finished Quietly With Weekly Gains
Kenneth J. Gruneisen - Passed the CAN SLIM® Master's Exam
The Dow added 34 points, while the Nasdaq Composite fell 0.2%. The S&P 500 slid 0.1%. All three major averages notched weekly gains. Volume totals were lighter than the prior session on the NYSE and on the Nasdaq exchange. Breadth was slightly positive as advancers led decliners by an 8-7 margin on the NYSE and by a 5-4 margin on the Nasdaq exchange. There were 41 high-ranked companies from the Leaders List that hit new 52-week highs and were listed on the BreakOuts Page, versus the total of 58 on the prior session. New 52-week highs outnumbered new 52-week lows on the NYSE but new lows outnumbered new highs on the Nasdaq exchange. The market is in a confirmed uptrend (M criteria). Healthy leadership (new 52-week highs totals) has continued helping the rally be productive. Only stocks meeting all key-criteria of the fact-based investment system should be considered as buy candidates.
Chart courtesy of www.stockcharts.com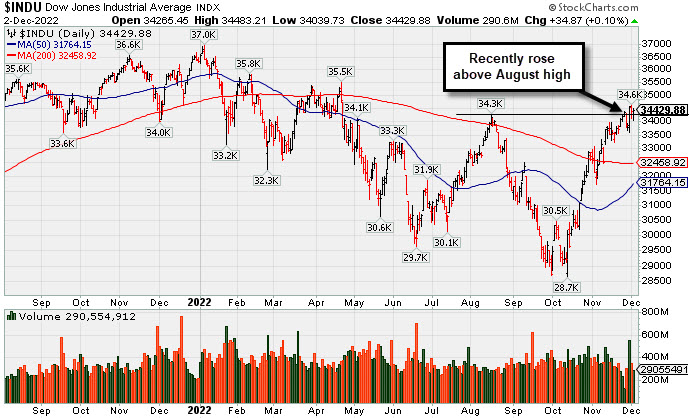 PICTURED: The Dow Jones Industrial Average recently rose above its August high.
U.S. equities finished mixed Friday as investors digested the hotter-than-expected November jobs report. Nonfarm payrolls showed 263,000 payrolls were added in November, far exceeding the expected 200,000 print. Meanwhile, November’s unemployment rate remained unchanged at 3.7%. Average hourly earnings unexpectedly grew 5.1% year-over-year after notching a 4.9% annual gain in October. The report garnered attention as it provides insights into the future course of interest rate hikes by the Federal Reserve (Fed). While investors expect a downshift in rate hikes at the Fed’s December meeting, the latest data has left analysts expecting a higher terminal rate than previously forecasted.
Treasuries were mixed, with the yield on the benchmark 10-year note dipping two basis points (0.02%) to 3.48%, while the 30-year bond yield shed seven basis points (0.07%) to 3.53%. The yield on the two-year note settled two basis points (0.02%) higher at 4.26% after touching a session-high of 4.44%. Treasuries rallied for the week amid hopes for a shift to more accommodative monetary policy. In commodities, West Texas Intermediate (WTI) crude declined 1.3% to $80.16/barrel ahead of next week’s Organization of Petroleum Exporting Countries and their allies (OPEC+) meeting and the impending European Union ban on Russian oil. Despite today’s moves, the domestic benchmark has snapped a three-week losing streak. The U.S. Dollar Index finished 0.2% lower but notched a 1.3% weekly decline.
|
 Kenneth J. Gruneisen started out as a licensed stockbroker in August 1987, a couple of months prior to the historic stock market crash that took the Dow Jones Industrial Average down -22.6% in a single day. He has published daily fact-based fundamental and technical analysis on high-ranked stocks online for two decades. Through FACTBASEDINVESTING.COM, Kenneth provides educational articles, news, market commentary, and other information regarding proven investment systems that work in good times and bad.
Comments contained in the body of this report are technical opinions only and are not necessarily those of Gruneisen Growth Corp. The material herein has been obtained from sources believed to be reliable and accurate, however, its accuracy and completeness cannot be guaranteed. Our firm, employees, and customers may effect transactions, including transactions contrary to any recommendation herein, or have positions in the securities mentioned herein or options with respect thereto. Any recommendation contained in this report may not be suitable for all investors and it is not to be deemed an offer or solicitation on our part with respect to the purchase or sale of any securities. |
|
 |
Broker/Dealer, Biotech, and Oil Services Indexes Rose
Kenneth J. Gruneisen - Passed the CAN SLIM® Master's Exam
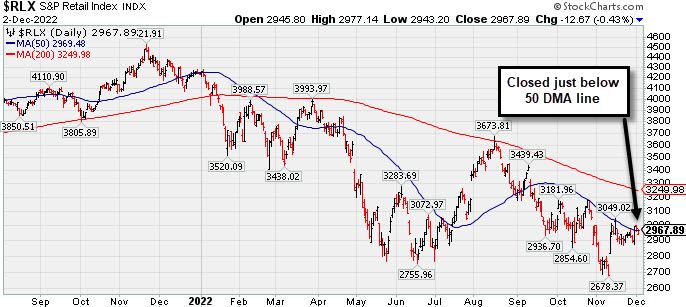
The Broker/Dealer Index ($XBD +0.71%) posted a gain while the Bank Index ($BKX -0.99%) and the Retail Index ($RLX -0.43%) both lost ground. The Biotech Index ($BTK +1.47%) led the tech sector while the Semiconductor Index ($SOX -1.19%) lost ground and the Networking Index ($NWX -0.25%) also edged lower. The Oil Services Index ($OSX +1.42%) posted a gain while the Integrated Oil Index ($XOI -0.86%) lost ground and the Gold & Silver Index ($XAU +0.02%) finished flat.
PICTURED: The Retail Index ($RLX -0.43%) lost ground and closed back below its 50-day moving average (DMA) line.
| Oil Services |
$OSX |
84.71 |
+1.19 |
+1.42% |
+60.67% |
| Integrated Oil |
$XOI |
1,842.55 |
-15.95 |
-0.86% |
+56.39% |
| Semiconductor |
$SOX |
2,771.24 |
-33.46 |
-1.19% |
-29.77% |
| Networking |
$NWX |
834.79 |
-2.10 |
-0.25% |
-14.03% |
| Broker/Dealer |
$XBD |
487.41 |
+3.42 |
+0.71% |
+0.11% |
| Retail |
$RLX |
2,967.89 |
-12.67 |
-0.43% |
-29.78% |
| Gold & Silver |
$XAU |
124.40 |
+0.03 |
+0.02% |
-6.08% |
| Bank |
$BKX |
106.40 |
-1.06 |
-0.99% |
-19.53% |
| Biotech |
$BTK |
5,434.06 |
+78.69 |
+1.47% |
-1.53% |
|
|
|
 |
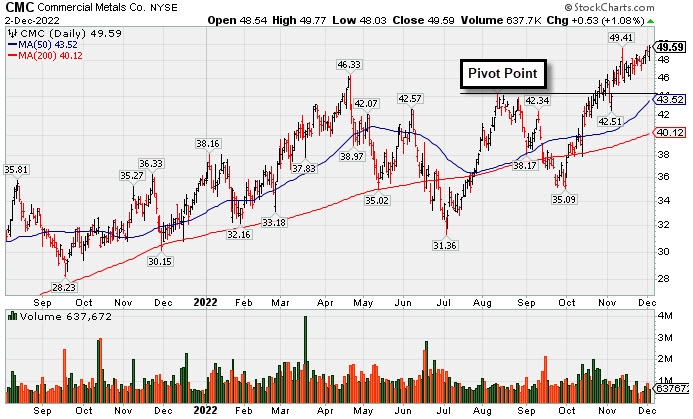
Wedging Higher With Recent Gains Lacking Great Volume
Kenneth J. Gruneisen - Passed the CAN SLIM® Master's Exam
Commercial Metals Co (CMC +$0.53 or +1.08% to $49.59) quietly wedged to another new high today with below average volume. Fundamentals remain strong. Prior highs in the $46-44 area define initial support to watch above its 50-day moving average (DMA) line ($43.59). Recent gains have lacked the volume necessary to provide a very reassuring sign of fresh institutional buying demand. However, it has posted 9 consecutive weekly gains, which suggests it has been attracting persistent buying interest.
Recently CMC reported Aug '22 quarterly earnings +94% on +19% sales revenues versus the year ago period and prior quarterly comparisons were well above the +25% minimum earnings guideline (C criteria) of the fact-based investment system. Annual earnings growth has been strong. It hails from the Metal Proc & Fabrication group which is currently ranked 32nd on the 197 Industry Groups list (L criteria).
The company has 117.3 million shares outstanding (S criteria). The number of top-rated funds owning its shares rose from 586 in Dec '21 to 630 in Sep '22. Its current Up/Down Volume Ratio of 1.7 is an unbiased indication its shares have been under accumulation over the past 50 days. It has a Timeliness Rating of A and a Sponsorship Rating of B.
|
|
|
Color Codes Explained :
Y - Better candidates highlighted by our
staff of experts.
G - Previously featured
in past reports as yellow but may no longer be buyable under the
guidelines.
***Last / Change / Volume data in this table is the closing quote data***
Symbol/Exchange
Company Name
Industry Group |
PRICE |
CHANGE
(%Change) |
Day High |
Volume
(% DAV)
(% 50 day avg vol) |
52 Wk Hi
% From Hi |
Featured
Date |
Price
Featured |
Pivot Featured |
|
Max Buy |
 ESQ
-
NASDAQ
ESQ
-
NASDAQ
Esquire Financial Hldgs
Finance-Commercial Loans
|
$43.70
|
-1.05
-2.35% |
$44.35
|
17,388
62.10% of 50 DAV
50 DAV is 28,000
|
$48.13
-9.20%
|
10/18/2022
|
$40.02
|
PP = $39.95
|
|
MB = $41.95
|
 Most Recent Note - 12/2/2022 5:41:15 PM
G - Pulled back today with below average volume for a 6th loss in the span of 7 sessions. Prior highs and its 50 DMA line ($41.82) coincide in the $41 area defining important near-term support to watch on pullbacks.
>>> FEATURED STOCK ARTICLE : Pulled Back Following "Negative Reversal" at All-Time High - 11/25/2022 |
View all notes |
Set NEW NOTE alert |
Company Profile |
SEC
News |
Chart |
Request a new note
C
A
S
I |
CCRN
-
NASDAQ
Cross Country Healthcare
DIVERSIFIED SERVICES - Staffing and Outsourcing Service
|
$36.64
|
+1.29
3.65% |
$36.90
|
554,468
67.45% of 50 DAV
50 DAV is 822,000
|
$40.12
-8.67%
|
9/9/2022
|
$27.32
|
PP = $30.61
|
|
MB = $32.14
|
Most Recent Note - 12/2/2022 5:30:33 PM
G - Posted a gain today with below average volume, still consolidating above its 50 DMA line ($33.54). Reported Sep '22 quarterly earnings +75% on +70% sales revenues versus the year ago period.
>>> FEATURED STOCK ARTICLE : Consolidating Above Prior Highs and Above 50-Day Moving Average - 11/8/2022 |
View all notes |
Set NEW NOTE alert |
Company Profile |
SEC
News |
Chart |
Request a new note
C
A
S
I |
CMC
-
NYSE
Commercial Metals Co
METALS and MINING - Steel and Iron
|
$49.59
|
+0.53
1.08% |
$49.77
|
637,672
64.54% of 50 DAV
50 DAV is 988,000
|
$49.69
-0.20%
|
10/14/2022
|
$41.61
|
PP = $44.45
|
|
MB = $46.67
|
Most Recent Note - 12/2/2022 5:25:00 PM
G - Wedged to another new high today with below average volume. It has posted 9 consecutive weekly gains. Fundamentals remain strong. Prior high in the $44 area defines initial support to watch above its 50 DMA line ($43.59). See the latest FSU analysis for more details and a new annotated graph.
>>> FEATURED STOCK ARTICLE : Wedging Higher With Recent Gains Lacking Great Volume - 12/2/2022 |
View all notes |
Set NEW NOTE alert |
Company Profile |
SEC
News |
Chart |
Request a new note
C
A
S
I |
VRTX
-
NASDAQ
Vertex Pharmaceuticals
Medical-Biomed/Biotech
|
$321.37
|
+0.61
0.19% |
$322.45
|
1,094,404
71.39% of 50 DAV
50 DAV is 1,533,000
|
$323.61
-0.69%
|
10/24/2022
|
$308.47
|
PP = $306.05
|
|
MB = $321.35
|
Most Recent Note - 11/30/2022 5:37:34 PM
Y - Churned +322% above average volume today but only posted a small gain after briefly trading above its "max buy" level and ended in the lower half of its intra-day range, action indicative of distributional pressure. Its 50 DMA line ($302) defines near-term support above recent intra-day lows in the $287-288 area. Recently reported Sep '22 quarterly earnings +14% on +18% sales revenues versus the year ago period, below the +25% minimum earnings guideline raising fundamental concerns (C criteria). Annual earnings (A criteria) history has been strong.
>>> FEATURED STOCK ARTICLE : Made Little Progress Following Breakout and Latest Earnings News - 11/16/2022 |
View all notes |
Set NEW NOTE alert |
Company Profile |
SEC
News |
Chart |
Request a new note
C
A
S
I |
GPK
-
NYSE
Graphic Packaging Hldg
CONSUMER NON-DURABLES - Packaging and Containers
|
$22.97
|
+0.04
0.17% |
$23.05
|
3,278,308
112.85% of 50 DAV
50 DAV is 2,905,000
|
$24.07
-4.57%
|
10/25/2022
|
$22.75
|
PP = $24.17
|
|
MB = $25.38
|
Most Recent Note - 12/1/2022 4:24:09 PM
Y - Still consolidating above its 50 DMA line ($21.65), perched within striking distance of its 52-week high and pivot point. More damaging losses would raise concerns and trigger a technical sell signal. Subsequent gains above the pivot point backed by at least +40% above average volume may trigger a technical buy signal. Fundamentals remain strong.
>>> FEATURED STOCK ARTICLE : Consolidating Above 50-Day Moving Average Still Perched Near High - 11/17/2022 |
View all notes |
Set NEW NOTE alert |
Company Profile |
SEC
News |
Chart |
Request a new note
C
A
S
I |
Symbol/Exchange
Company Name
Industry Group |
PRICE |
CHANGE
(%Change) |
Day High |
Volume
(% DAV)
(% 50 day avg vol) |
52 Wk Hi
% From Hi |
Featured
Date |
Price
Featured |
Pivot Featured |
|
Max Buy |
CBZ
-
NYSE
C B I Z Inc
Comml Svcs-Consulting
|
$50.16
|
+0.45
0.91% |
$50.39
|
162,868
61.69% of 50 DAV
50 DAV is 264,000
|
$50.57
-0.81%
|
10/26/2022
|
$47.83
|
PP = $48.57
|
|
MB = $51.00
|
Most Recent Note - 12/2/2022 5:28:32 PM
Y - Posted a 3rd consecutive gain with below average volume today as it managed a best-ever close and challenged its 52-week high. Its 50 DMA line ($46.73) and recent low define important near-term support. Recently reported Sep '22 quarterly earnings +24% on +28% sales revenues versus the year ago period.
>>> FEATURED STOCK ARTICLE : Gapped Up and Rebounded Above Pivot Point - 11/18/2022 |
View all notes |
Set NEW NOTE alert |
Company Profile |
SEC
News |
Chart |
Request a new note
C
A
S
I |
ENPH
-
NASDAQ
Enphase Energy Inc
Energy-Solar
|
$336.00
|
+22.00
7.01% |
$338.16
|
5,531,710
140.76% of 50 DAV
50 DAV is 3,930,000
|
$324.84
3.44%
|
10/26/2022
|
$301.55
|
PP = $324.94
|
|
MB = $341.19
|
Most Recent Note - 12/2/2022 12:21:50 PM
Y - Hitting a new all-time high with today's volume-driven gain above its pivot point. Faces no resistance due to overhead supply. Its 50 DMA line ($284.50) defines near-term support above the recent low ($262.60 on 11/07/22). Fundamentals remain strong.
>>> FEATURED STOCK ARTICLE : Perched Near High Still Awaiting Technical Breakout - 11/21/2022 |
View all notes |
Set NEW NOTE alert |
Company Profile |
SEC
News |
Chart |
Request a new note
C
A
S
I |
HRMY
-
NASDAQ
Harmony Biosciences Holdings
Medical-Biomed/Biotech
|
$60.48
|
+0.48
0.80% |
$60.81
|
470,180
100.27% of 50 DAV
50 DAV is 468,900
|
$61.55
-1.74%
|
11/1/2022
|
$55.31
|
PP = $57.23
|
|
MB = $60.09
|
Most Recent Note - 11/30/2022 5:41:50 PM
Y - Posted a solid gain today with average volume for its second best ever close, finishing perched near its all-time high. The 11/17/22 low ($53.06) defines initial support to watch above its 50 DMA line ($51.93).
>>> FEATURED STOCK ARTICLE : Harmony Still Hovering Near All-Time High - 11/28/2022 |
View all notes |
Set NEW NOTE alert |
Company Profile |
SEC
News |
Chart |
Request a new note
C
A
S
I |
CLH
-
NYSE
Clean Harbors Inc
Pollution Control
|
$124.02
|
+3.32
2.75% |
$125.41
|
380,487
87.67% of 50 DAV
50 DAV is 434,000
|
$124.49
-0.38%
|
11/2/2022
|
$121.59
|
PP = $124.59
|
|
MB = $130.82
|
Most Recent Note - 12/2/2022 5:36:49 PM
Y - Hit a new all-time high with today's 3rd consecutive gain backed by below average volume while it closed the session in the upper third of its intra-day range but below the pivot point cited. Its 50 DMA line ($116) and recent low define important near-term support to watch. Fundamentals remain strong.
>>> FEATURED STOCK ARTICLE : Volume-Driven Losses Undercut 50-Day Moving Average - 11/29/2022 |
View all notes |
Set NEW NOTE alert |
Company Profile |
SEC
News |
Chart |
Request a new note
C
A
S
I |
NPO
-
NYSE
Enpro Industries Inc
Machinery-Gen Industrial
|
$119.83
|
+1.00
0.84% |
$120.23
|
62,355
62.98% of 50 DAV
50 DAV is 99,000
|
$127.67
-6.14%
|
11/4/2022
|
$119.06
|
PP = $117.73
|
|
MB = $123.62
|
Most Recent Note - 12/1/2022 5:33:44 PM
Y - Posted a small gain today with light volume. Volume was +25% above average on the prior session as it managed a "positive reversal" and rebounded back above the pivot point cited. Fundamentals remain strong. See the latest FSU analysis for more details and a new annotated graph.
>>> FEATURED STOCK ARTICLE : Consolidating Near Old Highs Following Recent Breakout - 12/1/2022 |
View all notes |
Set NEW NOTE alert |
Company Profile |
SEC
News |
Chart |
Request a new note
C
A
S
I |
Symbol/Exchange
Company Name
Industry Group |
PRICE |
CHANGE
(%Change) |
Day High |
Volume
(% DAV)
(% 50 day avg vol) |
52 Wk Hi
% From Hi |
Featured
Date |
Price
Featured |
Pivot Featured |
|
Max Buy |
DGII
-
NASDAQ
Digi International Inc
COMPUTER HARDWARE - Networking and Communication Dev
|
$41.07
|
-0.06
-0.15% |
$42.56
|
271,346
68.52% of 50 DAV
50 DAV is 396,000
|
$43.68
-5.98%
|
11/10/2022
|
$41.82
|
PP = $40.96
|
|
MB = $43.01
|
Most Recent Note - 12/1/2022 5:37:40 PM
Y - Pulled back today with lighter volume after a big gain on the prior session with average volume finishing one cent below its best ever close. Recently wedged above the pivot point cited based on its 10/31/22 high plus 10 cents after forming an advanced "ascending base" pattern. Subsequent gains above the pivot point backed by at least +40% above average volume are needed to confirm a proper technical buy signal. Fundamentals remain strong.
>>> FEATURED STOCK ARTICLE : Finish Below Pivot Point Leaves Disciplined Investors Waiting - 11/10/2022 |
View all notes |
Set NEW NOTE alert |
Company Profile |
SEC
News |
Chart |
Request a new note
C
A
S
I |
GFF
-
NYSE
Griffon Corporation
MATERIALS and CONSTRUCTION - General Building Materials
|
$36.04
|
+0.55
1.55% |
$36.29
|
243,936
65.57% of 50 DAV
50 DAV is 372,000
|
$36.75
-1.93%
|
11/10/2022
|
$34.13
|
PP = $35.02
|
|
MB = $36.77
|
Most Recent Note - 12/1/2022 4:19:37 PM
Y - Posted a 3rd consecutive gain today, perched near its 52-week high. Prior highs in the $34 area define initial support to watch above its 50 DMA line ($32.02). Reported Sep '22 quarterly earnings +230% on +24% sales revenues versus the year ago period.
>>> FEATURED STOCK ARTICLE : Griffon Perched Near 52-Week High After 9-Week Base - 11/11/2022 |
View all notes |
Set NEW NOTE alert |
Company Profile |
SEC
News |
Chart |
Request a new note
C
A
S
I |
ANET
-
NYSE
Arista Networks Inc
Computer-Networking
|
$135.04
|
-4.74
-3.39% |
$137.30
|
2,008,557
85.95% of 50 DAV
50 DAV is 2,337,000
|
$148.57
-9.11%
|
11/14/2022
|
$132.05
|
PP = $133.70
|
|
MB = $140.39
|
Most Recent Note - 12/2/2022 5:26:50 PM
Y - Pulled back today with below average volume after recently wedging higher. Subsequent gains and a close above the pivot point must be backed by at least +40% above average volume to trigger a proper technical buy signal. Faces some resistance due to overhead supply up to the $148 level. Fundamentals are strong.
>>> FEATURED STOCK ARTICLE : Finished in Middle of Intra-Day Range After Challenging Pivot Point - 11/14/2022 |
View all notes |
Set NEW NOTE alert |
Company Profile |
SEC
News |
Chart |
Request a new note
C
A
S
I |
CPRX
-
NASDAQ
Catalyst Pharma Inc
Medical-Biomed/Biotech
|
$17.27
|
+0.64
3.85% |
$17.55
|
3,375,264
146.12% of 50 DAV
50 DAV is 2,310,000
|
$18.39
-6.09%
|
11/22/2022
|
$17.38
|
PP = $16.66
|
|
MB = $17.49
|
Most Recent Note - 12/2/2022 12:18:23 PM
Y - Posting a solid gain today. Disciplined investors avoid chasing stocks that are extended more than +5% above prior highs or the "max buy" level. Rallied from a 9-week cup-with-handle base with a big gain backed above average volume noted. Reported Sep '22 quarterly earnings +86% on +59% sales revenues versus the year ago period.
>>> FEATURED STOCK ARTICLE : Breakout From Cup-With-Handle With 90% Above Average Volume - 11/22/2022 |
View all notes |
Set NEW NOTE alert |
Company Profile |
SEC
News |
Chart |
Request a new note
C
A
S
I |
CLFD
-
NASDAQ
Clearfield Inc
TELECOMMUNICATIONS - Cables / Satalite Equipment
|
$121.82
|
-4.07
-3.23% |
$129.30
|
341,958
118.32% of 50 DAV
50 DAV is 289,000
|
$134.90
-9.70%
|
11/23/2022
|
$131.27
|
PP = $130.11
|
|
MB = $136.62
|
Most Recent Note - 12/2/2022 5:33:05 PM
Y - Pulled back today with slightly higher volume, action indicative of some distributional pressure soon after triggering a new technical buy signal. Disciplined investors always limit losses by selling any stock that falls more than 7-8% from their purchase price.
>>> FEATURED STOCK ARTICLE : Hit New High But Encountered Distributional Pressure - 11/23/2022 |
View all notes |
Set NEW NOTE alert |
Company Profile |
SEC
News |
Chart |
Request a new note
C
A
S
I |
Symbol/Exchange
Company Name
Industry Group |
PRICE |
CHANGE
(%Change) |
Day High |
Volume
(% DAV)
(% 50 day avg vol) |
52 Wk Hi
% From Hi |
Featured
Date |
Price
Featured |
Pivot Featured |
|
Max Buy |
TITN
-
NASDAQ
Titan Machinery Inc
SPECIALTY RETAIL
|
$42.45
|
-0.01
-0.02% |
$42.82
|
335,436
197.32% of 50 DAV
50 DAV is 170,000
|
$44.35
-4.28%
|
11/30/2022
|
$40.10
|
PP = $38.68
|
|
MB = $40.61
|
Most Recent Note - 12/2/2022 12:39:45 PM
G - Consolidating after a technical breakout noted on 11/30/22. Finished strong after highlighted in yellow with pivot point cited based on its 11/23/21 high plus 10 cents. Quickly got extended more than +5% above the prior high and its color code was changed to green. Prior high in the $38 area defines initial support to watch. Fundamentals remain strong after reporting Oct '22 quarterly earnings +91% on +47% sales revenues.
>>> FEATURED STOCK ARTICLE : Gap Up and Big Volume-Driven Breakout Gain - 11/30/2022 |
View all notes |
Set NEW NOTE alert |
Company Profile |
SEC
News |
Chart |
Request a new note
C
A
S
I |
|
|
|
THESE ARE NOT BUY RECOMMENDATIONS!
Comments contained in the body of this report are technical
opinions only. The material herein has been obtained
from sources believed to be reliable and accurate, however,
its accuracy and completeness cannot be guaranteed.
This site is not an investment advisor, hence it does
not endorse or recommend any securities or other investments.
Any recommendation contained in this report may not
be suitable for all investors and it is not to be deemed
an offer or solicitation on our part with respect to
the purchase or sale of any securities. All trademarks,
service marks and trade names appearing in this report
are the property of their respective owners, and are
likewise used for identification purposes only.
This report is a service available
only to active Paid Premium Members.
You may opt-out of receiving report notifications
at any time. Questions or comments may be submitted
by writing to Premium Membership Services 665 S.E. 10 Street, Suite 201 Deerfield Beach, FL 33441-5634 or by calling 1-800-965-8307
or 954-785-1121.
|
|
|