You are not logged in.
This means you
CAN ONLY VIEW reports that were published prior to Monday, March 24, 2025.
You
MUST UPGRADE YOUR MEMBERSHIP if you want to see any current reports.
AFTER MARKET UPDATE - TUESDAY, NOVEMBER 22ND, 2022
Previous After Market Report Next After Market Report >>>
|
|
|
|
DOW |
+397.82 |
34,098.10 |
+1.18% |
|
Volume |
832,421,289 |
+2% |
|
Volume |
4,134,042,200 |
+6% |
|
NASDAQ |
+149.90 |
11,174.41 |
+1.36% |
|
Advancers |
2,269 |
75% |
|
Advancers |
2,774 |
60% |
|
S&P 500 |
+53.64 |
4,003.58 |
+1.36% |
|
Decliners |
775 |
25% |
|
Decliners |
1,848 |
40% |
|
Russell 2000 |
+21.30 |
1,860.44 |
+1.16% |
|
52 Wk Highs |
76 |
|
|
52 Wk Highs |
139 |
|
|
S&P 600 |
+14.31 |
1,228.46 |
+1.18% |
|
52 Wk Lows |
68 |
|
|
52 Wk Lows |
263 |
|
|
 |
Major Averages Rose With Greater Leadership and Higher Volume
Kenneth J. Gruneisen - Passed the CAN SLIM® Master's Exam
The Dow added 397 points, while the Nasdaq Composite climbed 1.4%. The S&P 500 advanced 1.4%. The volume totals reported were higher than the prior session on the NYSE and on the Nasdaq exchange, indicative of increasing institutional buying demand. Breadth was positive as advancers led decliners by a 3-1 margin on the NYSE and by a 3-2 margin on the Nasdaq exchange. There were 39 high-ranked companies from the Leaders List that hit new 52-week highs and were listed on the BreakOuts Page, up from the total of 24 on the prior session. New 52-week highs outnumbered new 52-week lows on the NYSE but new lows still outnumbered new highs on the Nasdaq exchange. The market is in a confirmed uptrend (M criteria). Healthy leadership (new 52-week highs totals) has continued to help the rally be productive. Only stocks meeting all key-criteria of the fact-based investment system should be considered as buy candidates.
Chart courtesy of www.stockcharts.com PICTURED: The Nasdaq Composite Index has seen volume totals cooling while consolidating above its 50-day moving average (DMA) line. Of the 3 major indices only the Dow is in "healthy shape" above its 200 DMA line.
U.S. equities finished higher Tuesday as investors digested the latest commentary from Federal Reserve (Fed) officials and the latest earnings reports. Cleveland Fed President Loretta Mester indicated she would support a slower pace of interest rate hikes going forward, while San Francisco Fed President Mary Daly noted she was concerned about the possibility of overtightening and said central bank officials needed to pay attention to the lags in policy impact. All sectors of the S&P 500 finished in positive territory, with Energy pacing gains.
On the data front, the Richmond Fed Manufacturing Index came in lower than expected in November and the prices paid and wages components eased, adding support to the peak inflation narrative. In corporate news, shares of Best Buy Co Inc (BBY +12.78%) jumped after reporting better-than-expected quarterly earnings and raising its full-year outlook.
Treasuries rallied, with the yield on the benchmark 10-year note falling seven basis points (0.07%) to 3.76%, while the 30-year bond yield shed seven basis points (0.07%) to 3.83%. The yield on the two-year note, which is more sensitive to changes in monetary policy, dipped two basis points (0.02%) to 4.53%. In commodities, West Texas Intermediate (WTI) crude added 1.4% to $81.18/barrel amid reports Saudi Arabia will continue to cut production and may take further steps to balance the market. The U.S. Dollar Index fell 0.6% as a perceived risk-on mood took hold.
|
 Kenneth J. Gruneisen started out as a licensed stockbroker in August 1987, a couple of months prior to the historic stock market crash that took the Dow Jones Industrial Average down -22.6% in a single day. He has published daily fact-based fundamental and technical analysis on high-ranked stocks online for two decades. Through FACTBASEDINVESTING.COM, Kenneth provides educational articles, news, market commentary, and other information regarding proven investment systems that work in good times and bad.
Comments contained in the body of this report are technical opinions only and are not necessarily those of Gruneisen Growth Corp. The material herein has been obtained from sources believed to be reliable and accurate, however, its accuracy and completeness cannot be guaranteed. Our firm, employees, and customers may effect transactions, including transactions contrary to any recommendation herein, or have positions in the securities mentioned herein or options with respect thereto. Any recommendation contained in this report may not be suitable for all investors and it is not to be deemed an offer or solicitation on our part with respect to the purchase or sale of any securities. |
|
 |
Commodity-Linked Groups Led Tech, Retail, and Financials Higher
Kenneth J. Gruneisen - Passed the CAN SLIM® Master's Exam
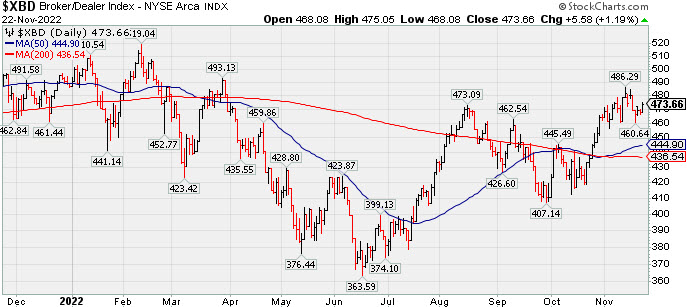
Commodity-linked groups were standout gainers as the Gold & Silver Index ($XAU +4.54%) outpaced the Oil Services Index ($OSX +3.26%) and Integrated Oil Index ($XOI +3.26%). The Semiconductor Index ($SOX +3.03%) led the tech sector while the Networking Index ($NWX +0.65%) and Biotech Index ($BTK +0.97%) also notched gains. The Retail Index ($RLX +1.21%), Broker/Dealer Index ($XBD +1.19%), and Bank Index ($BKX +0.98%) rounded out the session with gains that helped underpin the major averages' rally.
PICTURED: The Broker/Dealer Index ($XBD +1.19%) has been consolidating above its 50-day and 200-day moving average (DMA) lines after recently trading above its August high.
| Oil Services |
$OSX |
85.77 |
+2.71 |
+3.26% |
+62.69% |
| Integrated Oil |
$XOI |
1,915.25 |
+60.54 |
+3.26% |
+62.56% |
| Semiconductor |
$SOX |
2,756.82 |
+80.99 |
+3.03% |
-30.14% |
| Networking |
$NWX |
817.89 |
+5.31 |
+0.65% |
-15.78% |
| Broker/Dealer |
$XBD |
473.66 |
+5.58 |
+1.19% |
-2.71% |
| Retail |
$RLX |
2,935.07 |
+35.17 |
+1.21% |
-30.55% |
| Gold & Silver |
$XAU |
118.17 |
+5.13 |
+4.54% |
-10.78% |
| Bank |
$BKX |
107.26 |
+1.04 |
+0.98% |
-18.88% |
| Biotech |
$BTK |
5,199.99 |
+50.17 |
+0.97% |
-5.77% |
|
|
|
 |
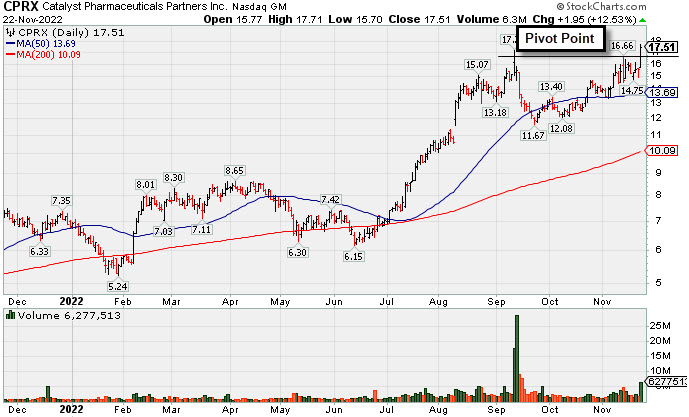
Breakout From Cup-With-Handle With 90% Above Average Volume
Kenneth J. Gruneisen - Passed the CAN SLIM® Master's Exam
Catalyst Pharma Inc (CPRX +$1.95 or +12.53% to $17.51) finished strong after highlighted in yellow with new pivot point cited based on its 11/11/22 high in then earlier mid-day report (read here). It rallied from a 9-week cup-with-handle consolidation for a new 52-week high with a big gain today backed by +90% above average volume triggering a technical buy signal. The volume-driven gain provided a fresh reassurance that institutional buying demand is still lurking.
It has an Earnings Per Share rating of 99. Recently it reported Sep '22 quarterly earnings +86% on +59% sales revenues versus the year ago period, its 4th consecutive quarterly comparison above the +25% minimum earnings guideline (C criteria). Annual earnings (A criteria) growth has been strong since turning profitable in FY '19.
The Medical-Biomed/Biotech industry group is currently ranked 18th on the 197 Industry Groups list, a reassuring sign concerning the L criteria. It has only 87.4 million shares in the public float. The number of top-rated funds owning its shares rose from 311 in Sep '21 to 370 in Sep '22, a reassuring sign concerning the I criteria. Its current Up/Down Volume Ratio of 1.5 is an unbiased indication its shares have been under accumulation over the past 50 days.
|
|
|
Color Codes Explained :
Y - Better candidates highlighted by our
staff of experts.
G - Previously featured
in past reports as yellow but may no longer be buyable under the
guidelines.
***Last / Change / Volume data in this table is the closing quote data***
Symbol/Exchange
Company Name
Industry Group |
PRICE |
CHANGE
(%Change) |
Day High |
Volume
(% DAV)
(% 50 day avg vol) |
52 Wk Hi
% From Hi |
Featured
Date |
Price
Featured |
Pivot Featured |
|
Max Buy |
 ESQ
-
NASDAQ
ESQ
-
NASDAQ
Esquire Financial Hldgs
Finance-Commercial Loans
|
$46.20
|
+1.02
2.26% |
$46.46
|
14,096
48.61% of 50 DAV
50 DAV is 29,000
|
$48.13
-4.01%
|
10/18/2022
|
$40.02
|
PP = $39.95
|
|
MB = $41.95
|
 Most Recent Note - 11/22/2022 6:16:43 PM
G - Posted a 3rd consecutive gain today with below average volume for its second-best ever close. Prior highs and its 50 DMA line coincide in the $41 area defining important near-term support to watch on pullbacks.
>>> FEATURED STOCK ARTICLE : New High With 6th Consecutive Volume-Driven Gain - 10/31/2022 |
View all notes |
Set NEW NOTE alert |
Company Profile |
SEC
News |
Chart |
Request a new note
C
A
S
I |
CCRN
-
NASDAQ
Cross Country Healthcare
DIVERSIFIED SERVICES - Staffing and Outsourcing Service
|
$35.99
|
+1.52
4.41% |
$36.35
|
630,390
69.89% of 50 DAV
50 DAV is 902,000
|
$40.12
-10.29%
|
9/9/2022
|
$27.32
|
PP = $30.61
|
|
MB = $32.14
|
Most Recent Note - 11/22/2022 6:18:52 PM
Y - Posted a gain today, consolidating above its 50 DMA line ($32.62). Reported Sep '22 quarterly earnings +75% on +70% sales revenues versus the year ago period.
>>> FEATURED STOCK ARTICLE : Consolidating Above Prior Highs and Above 50-Day Moving Average - 11/8/2022 |
View all notes |
Set NEW NOTE alert |
Company Profile |
SEC
News |
Chart |
Request a new note
C
A
S
I |
CMC
-
NYSE
Commercial Metals Co
METALS and MINING - Steel and Iron
|
$48.58
|
+1.16
2.45% |
$48.71
|
936,650
87.29% of 50 DAV
50 DAV is 1,073,000
|
$49.41
-1.68%
|
10/14/2022
|
$41.61
|
PP = $44.45
|
|
MB = $46.67
|
Most Recent Note - 11/22/2022 6:13:29 PM
G - Posted a gain today with below average for a best-ever close. Fundamentals remain strong. Prior high in the $44 area defines initial support to watch on pullbacks.
>>> FEATURED STOCK ARTICLE : Steel/Metal Products Firm Quietly Perched Near All Time High - 11/7/2022 |
View all notes |
Set NEW NOTE alert |
Company Profile |
SEC
News |
Chart |
Request a new note
C
A
S
I |
VRTX
-
NASDAQ
Vertex Pharmaceuticals
Medical-Biomed/Biotech
|
$321.48
|
+5.28
1.67% |
$322.26
|
1,460,934
100.27% of 50 DAV
50 DAV is 1,457,000
|
$318.38
0.97%
|
10/24/2022
|
$308.47
|
PP = $306.05
|
|
MB = $321.35
|
Most Recent Note - 11/18/2022 4:23:00 PM
Y - Posted a 3rd consecutive gain today with light volume yet managed a best-ever close. Its 50 DMA line ($298) defines near-term support above recent intra-day lows in the $287-288 area. Recently reported Sep '22 quarterly earnings +14% on +18% sales revenues versus the year ago period, below the +25% minimum earnings guideline raising fundamental concerns (C criteria). Annual earnings (A criteria) history has been strong.
>>> FEATURED STOCK ARTICLE : Made Little Progress Following Breakout and Latest Earnings News - 11/16/2022 |
View all notes |
Set NEW NOTE alert |
Company Profile |
SEC
News |
Chart |
Request a new note
C
A
S
I |
GPK
-
NYSE
Graphic Packaging Hldg
CONSUMER NON-DURABLES - Packaging and Containers
|
$22.56
|
+0.17
0.76% |
$22.72
|
2,996,559
100.69% of 50 DAV
50 DAV is 2,976,000
|
$24.07
-6.27%
|
10/25/2022
|
$22.75
|
PP = $24.17
|
|
MB = $25.38
|
Most Recent Note - 11/17/2022 5:15:29 PM
Y - Volume totals are cooling while consolidating above its 50 DMA line ($21.59). More damaging losses would raise concerns and trigger a technical sell signal. Subsequent gains above the pivot point backed by at least +40% above average volume may trigger a technical buy signal. Fundamentals remain strong. See the latest FSU analysis for more details and a new annotated graph.
>>> FEATURED STOCK ARTICLE : Consolidating Above 50-Day Moving Average Still Perched Near High - 11/17/2022 |
View all notes |
Set NEW NOTE alert |
Company Profile |
SEC
News |
Chart |
Request a new note
C
A
S
I |
Symbol/Exchange
Company Name
Industry Group |
PRICE |
CHANGE
(%Change) |
Day High |
Volume
(% DAV)
(% 50 day avg vol) |
52 Wk Hi
% From Hi |
Featured
Date |
Price
Featured |
Pivot Featured |
|
Max Buy |
CBZ
-
NYSE
C B I Z Inc
Comml Svcs-Consulting
|
$49.62
|
+0.75
1.53% |
$49.67
|
217,526
78.25% of 50 DAV
50 DAV is 278,000
|
$50.57
-1.88%
|
10/26/2022
|
$47.83
|
PP = $48.57
|
|
MB = $51.00
|
Most Recent Note - 11/18/2022 4:21:08 PM
Y - Gapped up today for a small gain with light volume yet rebounded above its pivot point. Its 50 DMA line ($45.85) and recent low define important near-term support. Recently reported Sep '22 quarterly earnings +24% on +28% sales revenues versus the year ago period.
>>> FEATURED STOCK ARTICLE : Gapped Up and Rebounded Above Pivot Point - 11/18/2022 |
View all notes |
Set NEW NOTE alert |
Company Profile |
SEC
News |
Chart |
Request a new note
C
A
S
I |
ENPH
-
NASDAQ
Enphase Energy Inc
Energy-Solar
|
$320.44
|
+12.34
4.01% |
$321.09
|
2,839,513
69.14% of 50 DAV
50 DAV is 4,107,000
|
$324.84
-1.35%
|
10/26/2022
|
$301.55
|
PP = $324.94
|
|
MB = $341.19
|
Most Recent Note - 11/22/2022 6:22:53 PM
Y - Posted a big gain today with below average volume and closed at the session high, perched within close striking distance of its pivot point. Faces no resistance due to overhead supply. Its 50 DMA line ($283) defines near-term support above the recent low ($262.60 on 11/07/22). Fundamentals remain strong.
>>> FEATURED STOCK ARTICLE : Perched Near High Still Awaiting Technical Breakout - 11/21/2022 |
View all notes |
Set NEW NOTE alert |
Company Profile |
SEC
News |
Chart |
Request a new note
C
A
S
I |
HRMY
-
NASDAQ
Harmony Biosciences Holdings
Medical-Biomed/Biotech
|
$57.95
|
+0.67
1.17% |
$58.17
|
307,875
58.12% of 50 DAV
50 DAV is 529,700
|
$61.55
-5.85%
|
11/1/2022
|
$55.31
|
PP = $57.23
|
|
MB = $60.09
|
Most Recent Note - 11/18/2022 12:59:28 PM
Y - Managed a "positive reversal" on the prior session after early weakness. Recently testing near prior highs in the $57 area that define initial support to watch above its 50 DMA line ($50.10).
>>> FEATURED STOCK ARTICLE : Volume Heavy Behind Technical Breakout After Earnings - 11/1/2022 |
View all notes |
Set NEW NOTE alert |
Company Profile |
SEC
News |
Chart |
Request a new note
C
A
S
I |
CLH
-
NYSE
Clean Harbors Inc
Pollution Control
|
$120.72
|
+2.69
2.28% |
$120.92
|
297,655
66.29% of 50 DAV
50 DAV is 449,000
|
$124.49
-3.03%
|
11/2/2022
|
$121.59
|
PP = $124.59
|
|
MB = $130.82
|
Most Recent Note - 11/22/2022 6:20:32 PM
Y - Posted a 6th consecutive gain today with lighter than average volume, approaching its prior highs and pivot point. Fundamentals remain strong after reporting Sep '22 quarterly earnings +113% on +43% sales revenues versus the year ago period.
>>> FEATURED STOCK ARTICLE : Testing 50 Day Moving Average Line After Forming New Base - 11/2/2022 |
View all notes |
Set NEW NOTE alert |
Company Profile |
SEC
News |
Chart |
Request a new note
C
A
S
I |
NPO
-
NYSE
Enpro Industries Inc
Machinery-Gen Industrial
|
$118.60
|
+0.31
0.26% |
$119.47
|
127,999
123.08% of 50 DAV
50 DAV is 104,000
|
$127.67
-7.10%
|
11/4/2022
|
$119.06
|
PP = $117.73
|
|
MB = $123.62
|
Most Recent Note - 11/21/2022 6:51:28 PM
Y - Ended lower with higher volume today for a 4th consecutive small loss, still remaining above its pivot point. Reported Sep '22 quarterly earnings +65% on +34% sales revenues versus the year ago period, its 3rd strong quarterly comparison above the +25% minimum earnings guideline (C criteria), helping it better match the winning models of the fact-based investment system. Annual earnings growth has been steady even through the pandemic.
>>> FEATURED STOCK ARTICLE : Finished Strong After Highlighted in Friday Mid-Day Report - 11/4/2022 |
View all notes |
Set NEW NOTE alert |
Company Profile |
SEC
News |
Chart |
Request a new note
C
A
S
I |
Symbol/Exchange
Company Name
Industry Group |
PRICE |
CHANGE
(%Change) |
Day High |
Volume
(% DAV)
(% 50 day avg vol) |
52 Wk Hi
% From Hi |
Featured
Date |
Price
Featured |
Pivot Featured |
|
Max Buy |
DGII
-
NASDAQ
Digi International Inc
COMPUTER HARDWARE - Networking and Communication Dev
|
$42.48
|
+0.74
1.77% |
$42.61
|
320,123
77.51% of 50 DAV
50 DAV is 413,000
|
$43.36
-2.03%
|
11/10/2022
|
$41.82
|
PP = $40.96
|
|
MB = $43.01
|
Most Recent Note - 11/21/2022 12:34:55 PM
Y - Hitting another new high with today's gain. Recently wedged above the pivot point cited based on its 10/31/22 high plus 10 cents after forming an advanced "ascending base" pattern. Subsequent gains above the pivot point backed by at least +40% above average volume are needed to confirm a proper technical buy signal. Reported Sep '22 quarterly earnings +80% versus the year ago period, its 3rd strong quarterly comparison well above the +25% minimum earnings guideline (C criteria), helping it better match the fact-based investment system's winning models. Annual earnings (A criteria) history has been strong after a downturn in FY '17-18.
>>> FEATURED STOCK ARTICLE : Finish Below Pivot Point Leaves Disciplined Investors Waiting - 11/10/2022 |
View all notes |
Set NEW NOTE alert |
Company Profile |
SEC
News |
Chart |
Request a new note
C
A
S
I |
GFF
-
NYSE
Griffon Corporation
MATERIALS and CONSTRUCTION - General Building Materials
|
$36.08
|
+0.80
2.27% |
$36.42
|
526,902
144.75% of 50 DAV
50 DAV is 364,000
|
$36.37
-0.80%
|
11/10/2022
|
$34.13
|
PP = $35.02
|
|
MB = $36.77
|
Most Recent Note - 11/22/2022 1:03:26 PM
Y - Perched at its 52-weeek high today. Rallied above the pivot point with a big volume-driven gain on 11/18/22 backed by +220% above average volume triggering a technical buy signal. Last week it briefly undercut its 50 DMA line ($31.53) which defines important near-term support. Reported Sep '22 quarterly earnings +230% on +24% sales revenues versus the year ago period.
>>> FEATURED STOCK ARTICLE : Griffon Perched Near 52-Week High After 9-Week Base - 11/11/2022 |
View all notes |
Set NEW NOTE alert |
Company Profile |
SEC
News |
Chart |
Request a new note
C
A
S
I |
ANET
-
NYSE
Arista Networks Inc
Computer-Networking
|
$136.04
|
+1.43
1.06% |
$136.26
|
1,676,191
67.40% of 50 DAV
50 DAV is 2,487,000
|
$148.57
-8.43%
|
11/14/2022
|
$132.05
|
PP = $133.70
|
|
MB = $140.39
|
Most Recent Note - 11/18/2022 4:26:30 PM
Y - Posted a gain with light volume for its best close since April 5th, wedging higher after a cup-with-handle base. Subsequent gains and a close above the pivot point backed by at least +40% above average volume are needed to trigger a proper technical buy signal. Faces some resistance due to overhead supply up to the $148 level. Fundamentals are strong.
>>> FEATURED STOCK ARTICLE : Finished in Middle of Intra-Day Range After Challenging Pivot Point - 11/14/2022 |
View all notes |
Set NEW NOTE alert |
Company Profile |
SEC
News |
Chart |
Request a new note
C
A
S
I |
CPRX
-
NASDAQ
Catalyst Pharma Inc
Medical-Biomed/Biotech
|
$17.51
|
+1.95
12.53% |
$17.71
|
6,275,293
190.10% of 50 DAV
50 DAV is 3,301,000
|
$17.22
1.68%
|
11/22/2022
|
$17.38
|
PP = $16.66
|
|
MB = $17.49
|
Most Recent Note - 11/22/2022 6:11:51 PM
Y - Finished strong today after highlighted in yellow with new pivot point cited based on its 11/11/22 high in the earlier mid-day report. Rallied from a 9-week cup-with-handle base for a new 52-week high with a big gain backed by +90% above average volume. Reported Sep '22 quarterly earnings +86% on +59% sales revenues versus the year ago period. Showed resilience since dropped from the Featured Stocks list on 9/23/22. See the latest FSU analysis for more details and a new annotated graph.
>>> FEATURED STOCK ARTICLE : Breakout From Cup-With-Handle With 90% Above Average Volume - 11/22/2022 |
View all notes |
Set NEW NOTE alert |
Company Profile |
SEC
News |
Chart |
Request a new note
C
A
S
I |
|
|
|
THESE ARE NOT BUY RECOMMENDATIONS!
Comments contained in the body of this report are technical
opinions only. The material herein has been obtained
from sources believed to be reliable and accurate, however,
its accuracy and completeness cannot be guaranteed.
This site is not an investment advisor, hence it does
not endorse or recommend any securities or other investments.
Any recommendation contained in this report may not
be suitable for all investors and it is not to be deemed
an offer or solicitation on our part with respect to
the purchase or sale of any securities. All trademarks,
service marks and trade names appearing in this report
are the property of their respective owners, and are
likewise used for identification purposes only.
This report is a service available
only to active Paid Premium Members.
You may opt-out of receiving report notifications
at any time. Questions or comments may be submitted
by writing to Premium Membership Services 665 S.E. 10 Street, Suite 201 Deerfield Beach, FL 33441-5634 or by calling 1-800-965-8307
or 954-785-1121.
|
|
|