You are not logged in.
This means you
CAN ONLY VIEW reports that were published prior to Tuesday, February 25, 2025.
You
MUST UPGRADE YOUR MEMBERSHIP if you want to see any current reports.
AFTER MARKET UPDATE - FRIDAY, DECEMBER 16TH, 2022
Previous After Market Report Next After Market Report >>>
|
|
|
|
DOW |
-281.76 |
32,920.46 |
-0.85% |
|
Volume |
3,245,619,600 |
+212% |
|
Volume |
8,002,942,200 |
+44% |
|
NASDAQ |
-105.11 |
10,705.41 |
-0.97% |
|
Advancers |
931 |
32% |
|
Advancers |
1,720 |
38% |
|
S&P 500 |
-43.39 |
3,852.36 |
-1.11% |
|
Decliners |
2,002 |
68% |
|
Decliners |
2,825 |
62% |
|
Russell 2000 |
-11.19 |
1,763.42 |
-0.63% |
|
52 Wk Highs |
31 |
|
|
52 Wk Highs |
67 |
|
|
S&P 600 |
-10.50 |
1,154.54 |
-0.90% |
|
52 Wk Lows |
178 |
|
|
52 Wk Lows |
463 |
|
|
The major indices have slumped while leadership has thinned. The uptrend is clearly under pressure and threatening a more serious markeyt correction. Caution and proper discipline remain paramount.
|
 |
Market Slumped With Higher Volume on Options Expirations
Kenneth J. Gruneisen - Passed the CAN SLIM® Master's Exam
The Dow shed 281 points, while the Nasdaq Composite fell 1%. The S&P 500 declined 1.1%, with all sectors finishing in negative territory. All three major averages declined for the week. The Dow notched a 1.7% weekly decline, while the Nasdaq Composite and S&P 500 fell 2.7% and 2.1%, respectively. Volume totals were higher than the prior session on the NYSE and on the Nasdaq exchange, inflated by options expirations. Breadth was negative as decliners led advancers by than a 2-1 margin on the NYSE and 3-2 on the Nasdaq exchange. There were only 4 high-ranked companies from the Leaders List that hit new 52-week highs and were listed on the BreakOuts Page, versus the total of 10 on the prior session. New 52-week lows totals expanded and solidly outnumbered shrinking new 52-week highs on the NYSE and on the Nasdaq exchange. The market is in an uptrend under pressure (M criteria) after the latter part of the week showed the threatening look of a more serious market correction. Healthy leadership (new 52-week highs totals) must continue for the rally be productive, but new highs totals have recently contracted. Only stocks meeting all key-criteria of the fact-based investment system should be considered as buy candidates.
Chart courtesy of www.stockcharts.com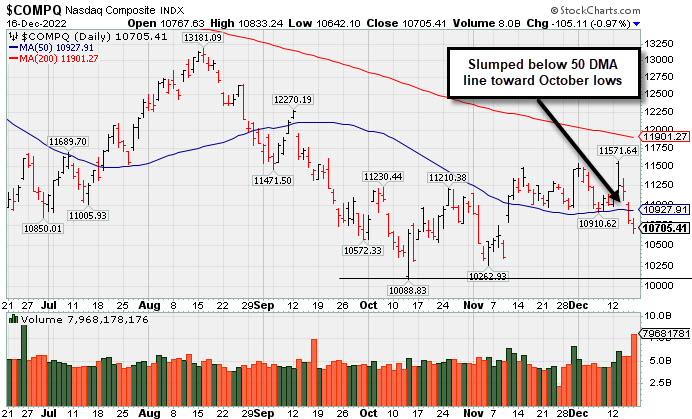 PICTURED: The Nasdaq Composite Index fell back below its 50-day moving average (DMA) line slumping toward its October low. Higher volume on the loss was attributed to options expirations.
U.S. equities finished lower amid amplified recession concerns following the Federal Reserve’s (Fed) latest interest rate hike. In Fed Chairman Jerome Powell’s post-meeting press conference, he stated the central bank will raise rates higher and maintain them for some time.
On the data front, the S&P Global U.S. Manufacturing Purchasing Managers’ Index (PMI) slipped further into contractionary territory, down to 46.2 in December from 47.7 in November. The Services PMI also unexpectedly fell to 44.4 from 46.2. In the central bank space, San Francisco Fed President Mary Daly said the recent inflation news was a sign of hope, but is still far from the central bank’s 2% target.
Treasuries were mixed, with the yield on the benchmark 10-year note climbing three basis points (0.03%) to 3.48%, while the 30-year bond yield advanced five basis points (0.05%) to 3.55%. The yield on the more Fed-sensitive two-year note shed five basis points (0.05%) to 4.19%. In commodities, West Texas Intermediate (WTI) crude fell 2.4% to $74.31/barrel amid recessionary fears. Despite today’s move, the domestic benchmark climbed for the week. Meanwhile, it was reported the U.S. will refill the Strategic Petroleum Reserve (SPR) starting in February.
|
 Kenneth J. Gruneisen started out as a licensed stockbroker in August 1987, a couple of months prior to the historic stock market crash that took the Dow Jones Industrial Average down -22.6% in a single day. He has published daily fact-based fundamental and technical analysis on high-ranked stocks online for two decades. Through FACTBASEDINVESTING.COM, Kenneth provides educational articles, news, market commentary, and other information regarding proven investment systems that work in good times and bad.
Comments contained in the body of this report are technical opinions only and are not necessarily those of Gruneisen Growth Corp. The material herein has been obtained from sources believed to be reliable and accurate, however, its accuracy and completeness cannot be guaranteed. Our firm, employees, and customers may effect transactions, including transactions contrary to any recommendation herein, or have positions in the securities mentioned herein or options with respect thereto. Any recommendation contained in this report may not be suitable for all investors and it is not to be deemed an offer or solicitation on our part with respect to the purchase or sale of any securities. |
|
 |
Gold & Silver Index Edged Higher on Widely Negative Session
Kenneth J. Gruneisen - Passed the CAN SLIM® Master's Exam
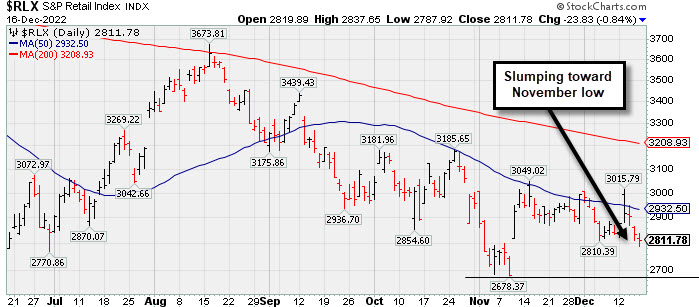
The Retail Index ($RLX -0.84%), Bank Index ($BKX -0.77%), and Broker/Dealer Index ($XBD -0.40%) lost ground. The Networking Index ($NWX -1.45%) and Semiconductor Index ($SOX -0.95%) led the tech sector lower while the Biotech Index ($BTK +0.02%) finished flat. The Gold & Silver Index ($XAU +0.59%) edged higher making it a standout gainer, meanwhile the Oil Services Index ($OSX -1.58%) and Integrated Oil Index ($XOI -1.43%) both lost ground.
PICTURED: The Retail Index ($RLX -0.84%) is slumping toward its November low after meeting resistance near its 50-day moving average (DMA) line.
| Oil Services |
$OSX |
78.46 |
-1.26 |
-1.58% |
+48.82% |
| Integrated Oil |
$XOI |
1,706.45 |
-24.73 |
-1.43% |
+44.84% |
| Semiconductor |
$SOX |
2,636.10 |
-25.31 |
-0.95% |
-33.20% |
| Networking |
$NWX |
785.75 |
-11.60 |
-1.45% |
-19.08% |
| Broker/Dealer |
$XBD |
445.47 |
-1.80 |
-0.40% |
-8.50% |
| Retail |
$RLX |
2,811.78 |
-23.83 |
-0.84% |
-33.47% |
| Gold & Silver |
$XAU |
117.58 |
+0.69 |
+0.59% |
-11.23% |
| Bank |
$BKX |
97.68 |
-0.75 |
-0.77% |
-26.12% |
| Biotech |
$BTK |
5,326.41 |
+0.89 |
+0.02% |
-3.48% |
|
|
|
 |
Featured Stocks
Kenneth J. Gruneisen - Passed the CAN SLIM® Master's Exam
|
|
|
Color Codes Explained :
Y - Better candidates highlighted by our
staff of experts.
G - Previously featured
in past reports as yellow but may no longer be buyable under the
guidelines.
***Last / Change / Volume data in this table is the closing quote data***
Symbol/Exchange
Company Name
Industry Group |
PRICE |
CHANGE
(%Change) |
Day High |
Volume
(% DAV)
(% 50 day avg vol) |
52 Wk Hi
% From Hi |
Featured
Date |
Price
Featured |
Pivot Featured |
|
Max Buy |
 ESQ
-
NASDAQ
ESQ
-
NASDAQ
Esquire Financial Hldgs
Finance-Commercial Loans
|
$42.25
|
+1.03
2.50% |
$42.37
|
74,957
277.62% of 50 DAV
50 DAV is 27,000
|
$48.13
-12.22%
|
10/18/2022
|
$40.02
|
PP = $39.95
|
|
MB = $41.95
|
 Most Recent Note - 12/16/2022 6:36:34 PM
G - Managed a positive "reversal today" finding support near prior highs in the $41 area and rebounding toward its 50 DMA line ($42.74). Gains above the 50 DMA line are needed for its outlook to improve.
>>> FEATURED STOCK ARTICLE : Pulled Back Following "Negative Reversal" at All-Time High - 11/25/2022 |
View all notes |
Set NEW NOTE alert |
Company Profile |
SEC
News |
Chart |
Request a new note
C
A
S
I |
CMC
-
NYSE
Commercial Metals Co
METALS and MINING - Steel and Iron
|
$48.15
|
+0.69
1.45% |
$48.53
|
3,764,715
375.72% of 50 DAV
50 DAV is 1,002,000
|
$50.83
-5.27%
|
10/14/2022
|
$41.61
|
PP = $44.45
|
|
MB = $46.67
|
Most Recent Note - 12/15/2022 4:30:42 PM
G - Gapped down today for a loss with below average volume, pulling back toward its 50 DMA line ($45.74) and prior highs in the $46 area defining important near-term support to watch. Fundamentals remain strong.
>>> FEATURED STOCK ARTICLE : Wedging Higher With Recent Gains Lacking Great Volume - 12/2/2022 |
View all notes |
Set NEW NOTE alert |
Company Profile |
SEC
News |
Chart |
Request a new note
C
A
S
I |
VRTX
-
NASDAQ
Vertex Pharmaceuticals
Medical-Biomed/Biotech
|
$304.80
|
-3.60
-1.17% |
$307.66
|
3,089,624
211.33% of 50 DAV
50 DAV is 1,462,000
|
$324.75
-6.14%
|
10/24/2022
|
$308.47
|
PP = $306.05
|
|
MB = $321.35
|
Most Recent Note - 12/15/2022 4:58:25 PM
Y - Pulled back today with below average volume after wedging to new highs with light volume, testing support near its 50 DMA line ($307.71) and prior pivot point. Recently reported Sep '22 quarterly earnings +14% on +18% sales revenues versus the year ago period, below the +25% minimum earnings guideline raising fundamental concerns (C criteria).
>>> FEATURED STOCK ARTICLE : Testing Support Near 50-Day Moving Average Line and Prior Pivot - 12/13/2022 |
View all notes |
Set NEW NOTE alert |
Company Profile |
SEC
News |
Chart |
Request a new note
C
A
S
I |
GPK
-
NYSE
Graphic Packaging Hldg
CONSUMER NON-DURABLES - Packaging and Containers
|
$21.33
|
-0.42
-1.93% |
$21.66
|
3,666,881
124.85% of 50 DAV
50 DAV is 2,937,000
|
$24.07
-11.38%
|
10/25/2022
|
$22.75
|
PP = $24.17
|
|
MB = $25.38
|
Most Recent Note - 12/15/2022 5:31:26 PM
G - Pulled back below its 50-day moving average (DMA) line ($22.09) with today's loss on near average volume raising concerns and triggering a technical sell signal. Color code is changed to green. A prompt rebound above the 50 DMA line is needed for its outlook to improve Fundamentals remain strong. See the latest FSU analysis for more details and a new annotated graph.
>>> FEATURED STOCK ARTICLE : Violated 50-Day Moving Average After Recently Failing to Break Out - 12/15/2022 |
View all notes |
Set NEW NOTE alert |
Company Profile |
SEC
News |
Chart |
Request a new note
C
A
S
I |
CBZ
-
NYSE
C B I Z Inc
Comml Svcs-Consulting
|
$48.07
|
-0.64
-1.31% |
$48.52
|
480,107
183.95% of 50 DAV
50 DAV is 261,000
|
$51.67
-6.97%
|
10/26/2022
|
$47.83
|
PP = $48.57
|
|
MB = $51.00
|
Most Recent Note - 12/15/2022 4:23:26 PM
Y - Pulled back from its 52-week high today with a 2nd loss on below average volume. Its 50 DMA line ($47.71) and recent low define important near-term support. It has formed an orderly new 6-week flat base but a new pivot point was not cited because it has made little headway from the prior base and remains below the "max buy" level. Recently reported Sep '22 quarterly earnings +24% on +28% sales revenues versus the year ago period.
>>> FEATURED STOCK ARTICLE : Gapped Up and Rebounded Above Pivot Point - 11/18/2022 |
View all notes |
Set NEW NOTE alert |
Company Profile |
SEC
News |
Chart |
Request a new note
C
A
S
I |
Symbol/Exchange
Company Name
Industry Group |
PRICE |
CHANGE
(%Change) |
Day High |
Volume
(% DAV)
(% 50 day avg vol) |
52 Wk Hi
% From Hi |
Featured
Date |
Price
Featured |
Pivot Featured |
|
Max Buy |
ENPH
-
NASDAQ
Enphase Energy Inc
Energy-Solar
|
$303.39
|
-10.67
-3.40% |
$313.00
|
4,634,213
123.68% of 50 DAV
50 DAV is 3,747,000
|
$339.92
-10.75%
|
10/26/2022
|
$301.55
|
PP = $324.94
|
|
MB = $341.19
|
Most Recent Note - 12/16/2022 6:32:32 PM
Y - Pulled back today with above average volume while slumping back below its pivot point. Stalled after hitting a new all-time high on 12/02/22 with a volume-driven gain above its pivot point. Its 50 DMA line ($292) defines near-term support to watch on pullbacks. Fundamentals remain strong.
>>> FEATURED STOCK ARTICLE : Perched Near High Still Awaiting Technical Breakout - 11/21/2022 |
View all notes |
Set NEW NOTE alert |
Company Profile |
SEC
News |
Chart |
Request a new note
C
A
S
I |
HRMY
-
NASDAQ
Harmony Biosciences Holdings
Medical-Biomed/Biotech
|
$55.68
|
-0.45
-0.80% |
$55.83
|
933,549
198.67% of 50 DAV
50 DAV is 469,900
|
$62.09
-10.32%
|
11/1/2022
|
$55.31
|
PP = $57.23
|
|
MB = $60.09
|
Most Recent Note - 12/15/2022 4:49:29 PM
Y - Suffered a 3rd consecutive loss today slumping below its pivot point raising concerns. Its 50 DMA line ($55.29) and 11/17/22 low ($53.06) define important near-term support to watch.
>>> FEATURED STOCK ARTICLE : Harmony Still Hovering Near All-Time High - 11/28/2022 |
View all notes |
Set NEW NOTE alert |
Company Profile |
SEC
News |
Chart |
Request a new note
C
A
S
I |
CLH
-
NYSE
Clean Harbors Inc
Pollution Control
|
$115.00
|
-1.50
-1.29% |
$116.47
|
994,016
250.38% of 50 DAV
50 DAV is 397,000
|
$125.41
-8.30%
|
11/2/2022
|
$121.59
|
PP = $124.59
|
|
MB = $130.82
|
Most Recent Note - 12/15/2022 4:25:31 PM
Y - Still consolidating below its pivot point and today's loss on light volume undercut its 50 DMA line ($117.33) nearly testing the recent low ($114.86 on 11/29/22) which defines important near-term support to watch. Fundamentals remain strong.
>>> FEATURED STOCK ARTICLE : Volume-Driven Losses Undercut 50-Day Moving Average - 11/29/2022 |
View all notes |
Set NEW NOTE alert |
Company Profile |
SEC
News |
Chart |
Request a new note
C
A
S
I |
NPO
-
NYSE
Enpro Industries Inc
Machinery-Gen Industrial
|
$105.68
|
-0.47
-0.44% |
$106.14
|
895,729
878.17% of 50 DAV
50 DAV is 102,000
|
$127.67
-17.22%
|
11/4/2022
|
$119.06
|
PP = $117.73
|
|
MB = $123.62
|
Most Recent Note - 12/16/2022 6:43:50 PM
Violated its 50 DMA line ($109.23) with damaging losses this week triggering a technical sell signal. A rebound above the 50 DMA line is needed for its outlook to improve. Fundamentals remain strong. It will be dropped from the Featured Stocks list tonight.
>>> FEATURED STOCK ARTICLE : Consolidating Near Old Highs Following Recent Breakout - 12/1/2022 |
View all notes |
Set NEW NOTE alert |
Company Profile |
SEC
News |
Chart |
Request a new note
C
A
S
I |
DGII
-
NASDAQ
Digi International Inc
COMPUTER HARDWARE - Networking and Communication Dev
|
$37.44
|
-1.72
-4.39% |
$39.00
|
1,248,229
354.61% of 50 DAV
50 DAV is 352,000
|
$43.68
-14.29%
|
11/10/2022
|
$41.82
|
PP = $40.96
|
|
MB = $43.01
|
Most Recent Note - 12/16/2022 6:31:23 PM
G - Violated its 50 DMA line ($38.86) this week with 3 damaging losses backed by ever increasing volume triggering a technical sell signal and its color code is changed to green. Only a prompt rebound above the 50 DMA line would help its outlook improve. Fundamentals remain strong.
>>> FEATURED STOCK ARTICLE : Sputtering After Recently Wedging to New Highs - 12/6/2022 |
View all notes |
Set NEW NOTE alert |
Company Profile |
SEC
News |
Chart |
Request a new note
C
A
S
I |
Symbol/Exchange
Company Name
Industry Group |
PRICE |
CHANGE
(%Change) |
Day High |
Volume
(% DAV)
(% 50 day avg vol) |
52 Wk Hi
% From Hi |
Featured
Date |
Price
Featured |
Pivot Featured |
|
Max Buy |
GFF
-
NYSE
Griffon Corporation
MATERIALS and CONSTRUCTION - General Building Materials
|
$34.95
|
+0.12
0.34% |
$35.10
|
2,087,309
573.44% of 50 DAV
50 DAV is 364,000
|
$37.69
-7.27%
|
11/10/2022
|
$34.13
|
PP = $35.02
|
|
MB = $36.77
|
Most Recent Note - 12/16/2022 6:38:10 PM
Y - Managed a "positive reversal" today after slumping near prior highs in the $34 area which define initial support to watch above its 50 DMA line ($33.19). Reported Sep '22 quarterly earnings +230% on +24% sales revenues versus the year ago period.
>>> FEATURED STOCK ARTICLE : No Meaningful Progress After Breakout 3 Weeks Ago - 12/7/2022 |
View all notes |
Set NEW NOTE alert |
Company Profile |
SEC
News |
Chart |
Request a new note
C
A
S
I |
ANET
-
NYSE
Arista Networks Inc
Computer-Networking
|
$123.66
|
-1.92
-1.53% |
$124.52
|
3,419,875
138.96% of 50 DAV
50 DAV is 2,461,000
|
$148.57
-16.77%
|
11/14/2022
|
$132.05
|
PP = $133.70
|
|
MB = $140.39
|
Most Recent Note - 12/16/2022 6:46:44 PM
G - Color code is changed to green as today's 3rd consecutive loss with increasing volume undercut the prior low and tested its 50-day moving average (DMA) line ($123.74). Faces some resistance due to overhead supply up to the $148 level. Fundamentals are strong.
>>> FEATURED STOCK ARTICLE : Sputtered Back Below Prior High Hurting Outlook - 12/9/2022 |
View all notes |
Set NEW NOTE alert |
Company Profile |
SEC
News |
Chart |
Request a new note
C
A
S
I |
CPRX
-
NASDAQ
Catalyst Pharma Inc
Medical-Biomed/Biotech
|
$16.00
|
-0.84
-4.99% |
$16.96
|
4,299,826
193.77% of 50 DAV
50 DAV is 2,219,000
|
$18.39
-13.00%
|
11/22/2022
|
$17.38
|
PP = $16.66
|
|
MB = $17.49
|
Most Recent Note - 12/16/2022 6:28:16 PM
Y - Pulled back today for a 3rd big loss with higher volume slumping back below its pivot point raising some concerns. Recently consolidating near the prior high and well above its 50 DMA line ($15.05).
>>> FEATURED STOCK ARTICLE : Breakout From Cup-With-Handle With 90% Above Average Volume - 11/22/2022 |
View all notes |
Set NEW NOTE alert |
Company Profile |
SEC
News |
Chart |
Request a new note
C
A
S
I |
TITN
-
NASDAQ
Titan Machinery Inc
SPECIALTY RETAIL
|
$39.08
|
+0.54
1.40% |
$39.41
|
415,303
214.07% of 50 DAV
50 DAV is 194,000
|
$44.35
-11.88%
|
11/30/2022
|
$40.10
|
PP = $38.68
|
|
MB = $40.61
|
Most Recent Note - 12/15/2022 4:56:40 PM
Y - Suffered a big loss today consolidating near the prior high in the $38 area which defines initial support to watch. Fundamentals remain strong after reporting Oct '22 quarterly earnings +91% on +47% sales revenues.
>>> FEATURED STOCK ARTICLE : Gap Up and Big Volume-Driven Breakout Gain - 11/30/2022 |
View all notes |
Set NEW NOTE alert |
Company Profile |
SEC
News |
Chart |
Request a new note
C
A
S
I |
MYE
-
NYSE
Myers Industries Inc
Containers/Packaging
|
$22.48
|
-0.33
-1.45% |
$22.67
|
1,121,399
836.86% of 50 DAV
50 DAV is 134,000
|
$25.55
-12.02%
|
12/8/2022
|
$23.94
|
PP = $25.65
|
|
MB = $26.93
|
Most Recent Note - 12/16/2022 6:41:18 PM
Y - Pulled back today for a 3rd consecutive loss with above average volume. Disciplined investors will note that it has failed thus far to produce the gains above the pivot point backed by at least +40% above average volume necessary to trigger a technical buy signal. The Sep '22 quarter showed +78% earnings on +14% sales revenues versus the year ago period. The past 4 quarterly comparisons were above the +25% minimum guideline (C criteria), however, its sales revenues growth rate has shown deceleration in sequential comparisons +45%, +29%, +24%, to +14%. Annual earnings (A criteria) history had a slight downturn in FY '19 but growth has been otherwise strong and steady.
>>> FEATURED STOCK ARTICLE : Myers Industries on Track for 9th Straight Weekly Gain - 12/8/2022 |
View all notes |
Set NEW NOTE alert |
Company Profile |
SEC
News |
Chart |
Request a new note
C
A
S
I |
Symbol/Exchange
Company Name
Industry Group |
PRICE |
CHANGE
(%Change) |
Day High |
Volume
(% DAV)
(% 50 day avg vol) |
52 Wk Hi
% From Hi |
Featured
Date |
Price
Featured |
Pivot Featured |
|
Max Buy |
BOX
-
NYSE
Box Inc Cl A
Computer Sftwr-Database
|
$31.24
|
+0.18
0.58% |
$31.46
|
2,910,663
261.05% of 50 DAV
50 DAV is 1,115,000
|
$33.04
-5.45%
|
12/12/2022
|
$29.83
|
PP = $29.57
|
|
MB = $31.05
|
Most Recent Note - 12/15/2022 4:20:55 PM
G - Pulled back today following 3 consecutive volume-driven gains, consolidating near its "max buy" level. Faces some additional resistance due to overhead supply up to the $33 level. Quarterly and annual earnings increases have been strong and steady.
>>> FEATURED STOCK ARTICLE : Volume Heavy Behind Breakout for Box Inc - 12/12/2022 |
View all notes |
Set NEW NOTE alert |
Company Profile |
SEC
News |
Chart |
Request a new note
C
A
S
I |
STRL
-
NASDAQ
Sterling Infrastructure
MATERIALS and; CONSTRUCTION - Heavy Construction
|
$31.01
|
-0.02
-0.06% |
$31.03
|
392,498
215.66% of 50 DAV
50 DAV is 182,000
|
$33.62
-7.76%
|
12/14/2022
|
$32.41
|
PP = $33.72
|
|
MB = $35.41
|
Most Recent Note - 12/15/2022 4:55:05 PM
Y - Pulled back today for a 2nd loss with lighter volume. Highlighted in yellow with pivot point cited based on its 11/08/22 high plus 10 cents in the 12/14/22 mid-day report. Consolidating for about 5 weeks in a tight range near its all-time high with volume totals cooling. Faces very little resistance due to overhead supply. Subsequent gains above the pivot point backed by at least +40% above average volume are needed to trigger a proper technical buy signal. Reported Sep '22 quarterly earnings +35% on +20% sales revenues versus the year ago period, its 5th quarterly comparison at or above the +25% minimum earnings guideline (C criteria). After years of losses it has shown improving annual earnings (A criteria) since FY '17.
>>> FEATURED STOCK ARTICLE : Sterling Infrastructure Forming Orderly Base Pattern - 12/14/2022 |
View all notes |
Set NEW NOTE alert |
Company Profile |
SEC
News |
Chart |
Request a new note
C
A
S
I |
|
|
|
THESE ARE NOT BUY RECOMMENDATIONS!
Comments contained in the body of this report are technical
opinions only. The material herein has been obtained
from sources believed to be reliable and accurate, however,
its accuracy and completeness cannot be guaranteed.
This site is not an investment advisor, hence it does
not endorse or recommend any securities or other investments.
Any recommendation contained in this report may not
be suitable for all investors and it is not to be deemed
an offer or solicitation on our part with respect to
the purchase or sale of any securities. All trademarks,
service marks and trade names appearing in this report
are the property of their respective owners, and are
likewise used for identification purposes only.
This report is a service available
only to active Paid Premium Members.
You may opt-out of receiving report notifications
at any time. Questions or comments may be submitted
by writing to Premium Membership Services 665 S.E. 10 Street, Suite 201 Deerfield Beach, FL 33441-5634 or by calling 1-800-965-8307
or 954-785-1121.
|
|
|