You are not logged in.
This means you
CAN ONLY VIEW reports that were published prior to Tuesday, March 25, 2025.
You
MUST UPGRADE YOUR MEMBERSHIP if you want to see any current reports.
AFTER MARKET UPDATE - TUESDAY, DECEMBER 6TH, 2022
Previous After Market Report Next After Market Report >>>
|
|
|
|
DOW |
-350.76 |
33,596.34 |
-1.03% |
|
Volume |
979,777,136 |
+7% |
|
Volume |
4,674,119,900 |
+5% |
|
NASDAQ |
-225.05 |
11,014.89 |
-2.00% |
|
Advancers |
868 |
29% |
|
Advancers |
1,383 |
30% |
|
S&P 500 |
-57.58 |
3,941.26 |
-1.44% |
|
Decliners |
2,147 |
71% |
|
Decliners |
3,202 |
70% |
|
Russell 2000 |
-27.65 |
1,812.58 |
-1.50% |
|
52 Wk Highs |
37 |
|
|
52 Wk Highs |
68 |
|
|
S&P 600 |
-11.33 |
1,199.54 |
-0.94% |
|
52 Wk Lows |
114 |
|
|
52 Wk Lows |
312 |
|
|
 |
Leadership Wanes as Major Indices Encounter Distributional Pressure
Kenneth J. Gruneisen - Passed the CAN SLIM® Master's Exam
The Dow shed 350 points, while the Nasdaq Composite fell 2% amid a sell-off in large-cap Technology companies. The S&P 500 declined 1.4%. Volume totals were higher than the prior session on the NYSE and on the Nasdaq exchange, action indicative of distributional pressure or an increase in institutional selling. Breadth was negative as decliners led advancers by more than a 2-1 margin on the NYSE and on the Nasdaq exchange. There were only 7 high-ranked companies from the Leaders List that hit new 52-week highs and were listed on the BreakOuts Page, down from the total of 27 on the prior session. New 52-week lows totals expanded and outnumbered shrinking new 52-week highs on the NYSE and on the Nasdaq exchange. The market uptrend (M criteria) has encountered new pressure. Healthy leadership (new 52-week highs totals) must continue for the rally be productive, but new highs totals have been waning. Only stocks meeting all key-criteria of the fact-based investment system should be considered as buy candidates.
Chart courtesy of www.stockcharts.com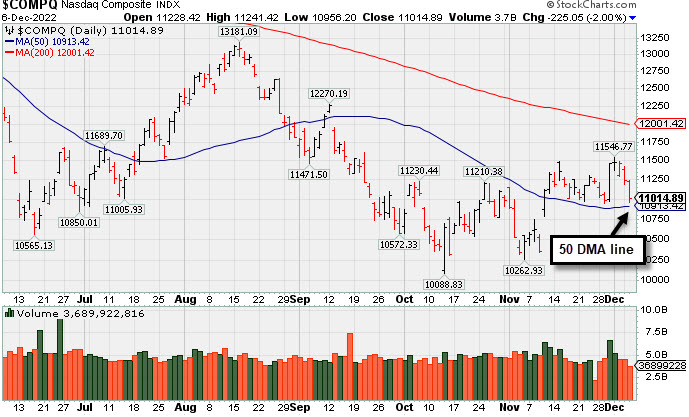 PICTURED: The Nasdaq Composite Index has slumped back near its 50-day moving average (DMA) line with 3 consecutive losses. Recent rallies have not come close to the 200 DMA line, however, for any index to be considered in truly "healthy" shape it must be trading above its 200 DMA line. Improvement is needed. Meanwhile, any deterioration below the 50 DMA toward prior lows would be a worrisome sign.
US. equities finished lower Tuesday to extend Monday’s rout. Heightened worries over the future course of interest rate hikes and growing recessionary fears weighed on investor sentiment and sent stocks tumbling. Ten of 11 sectors in the S&P 500 finished in negative territory, with Utilities the sole gainer.
On the data front, the U.S. trade balance showed the trade deficit widened in October amid a surge in imports and a decline in exports. Meanwhile, Georgia’s Senate run-off election is occurring today. Voters will choose between Democratic incumbent Raphael Warnock or Republican Herschel Walker.
Treasuries rallied despite uncertainty over the Federal Reserve’s (Fed) monetary policy path. The yield on the benchmark 10-year note shed seven basis points (0.07%) to 3.52%, while the yield on the 30-year bond declined seven basis points (0.07%) to 3.53%. The yield on the two-year note, which is more sensitive to changes in Fed policy, fell five basis points (0.05%) to 4.35%. In commodities, West Texas Intermediate (WTI) crude dropped 3.3% to $74.41/barrel after touching its lowest level since December 2021 during the session. Concerns over the global demand outlook have overshadowed reports China is easing their COVID-19 restrictions and the price cap on Russian crude products. The U.S. Dollar index climbed 0.2% against a basket of major currencies as investors flocked to the perceived safe-haven asset.
|
 Kenneth J. Gruneisen started out as a licensed stockbroker in August 1987, a couple of months prior to the historic stock market crash that took the Dow Jones Industrial Average down -22.6% in a single day. He has published daily fact-based fundamental and technical analysis on high-ranked stocks online for two decades. Through FACTBASEDINVESTING.COM, Kenneth provides educational articles, news, market commentary, and other information regarding proven investment systems that work in good times and bad.
Comments contained in the body of this report are technical opinions only and are not necessarily those of Gruneisen Growth Corp. The material herein has been obtained from sources believed to be reliable and accurate, however, its accuracy and completeness cannot be guaranteed. Our firm, employees, and customers may effect transactions, including transactions contrary to any recommendation herein, or have positions in the securities mentioned herein or options with respect thereto. Any recommendation contained in this report may not be suitable for all investors and it is not to be deemed an offer or solicitation on our part with respect to the purchase or sale of any securities. |
|
 |
Retail, Financial, Tech, and Commodity-Linked Groups Fell
Kenneth J. Gruneisen - Passed the CAN SLIM® Master's Exam
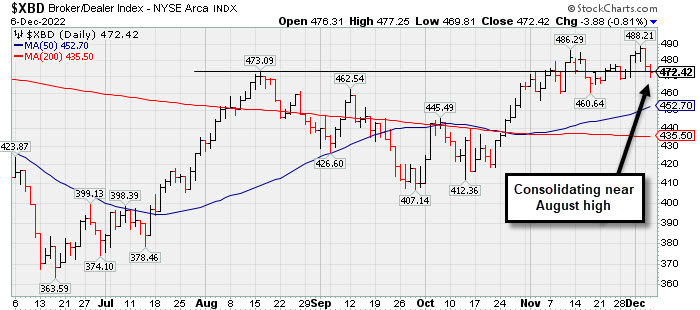
The Retail Index ($RLX -1.94%), Bank Index ($BKX -1.63%) and Broker/Dealer Index ($XBD -0.81%) each lost ground. The tech sector had a negative bias as the Semiconductor Index ($SOX -2.36%), Networking Index ($NWX -1.96%), and Biotech Index ($BTK -1.76%) suffered unanimous losses. The Oil Services Index ($OSX -1.83%) and Integrated Oil Index ($XOI -2.63%) both lost ground and the Gold & Silver Index ($XAU -0.65%) also edged lower.
PICTURED: The Broker/Dealer Index ($XBD -0.81%) lost ground and slumped near its August high.
| Oil Services |
$OSX |
79.81 |
-1.49 |
-1.83% |
+51.38% |
| Integrated Oil |
$XOI |
1,739.71 |
-46.99 |
-2.63% |
+47.66% |
| Semiconductor |
$SOX |
2,673.53 |
-64.52 |
-2.36% |
-32.25% |
| Networking |
$NWX |
803.83 |
-16.04 |
-1.96% |
-17.22% |
| Broker/Dealer |
$XBD |
472.42 |
-3.88 |
-0.81% |
-2.97% |
| Retail |
$RLX |
2,829.79 |
-55.96 |
-1.94% |
-33.05% |
| Gold & Silver |
$XAU |
119.41 |
-0.78 |
-0.65% |
-9.85% |
| Bank |
$BKX |
100.07 |
-1.66 |
-1.63% |
-24.32% |
| Biotech |
$BTK |
5,233.24 |
-93.72 |
-1.76% |
-5.17% |
|
|
|
 |
Sputtering After Recently Wedging to New Highs
Kenneth J. Gruneisen - Passed the CAN SLIM® Master's Exam
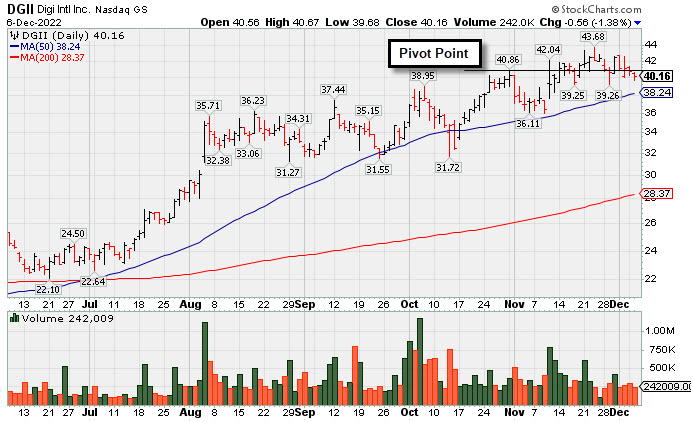
Digi International Inc (DGII -$0.56 or -1.38% to $40.16) pulled back today for a 4th consecutive small loss with lighter volume. Recently it wedged above the pivot point cited based on its 10/31/22 high plus 10 cents after forming an advanced "ascending base" pattern. Subsequent gains above the pivot point backed by at least +40% above average volume are needed to confirm a proper technical buy signal. Fundamentals remain strong.
DGII has a highest possible 99 Earnings Per Share Rating. It reported Sep '22 quarterly earnings +80% on +34% sales revenues versus the year ago period, its 3rd strong quarterly comparison well above the +25% minimum earnings guideline (C criteria), helping it better match the fact-based investment system's winning models. Annual earnings (A criteria) history has been strong after a downturn in FY '17-18.
The company hails from the Computer - Networking group which is currently ranked 3rd on the 197 Industry Groups list (L criteria). The small supply of only 35.6 million shares outstanding can contribute to greater price volatility in the event of institutional buying or selling. The number of top-rated funds owning its shares rose from 308 in Dec '21 to 376 in Sep '22, a reassuring sign concerning the I criteria. It has an Accumulation/Distribution Rating of A, a Timeliness Rating of A, and a Sponsorship Rating of B.
|
|
|
Color Codes Explained :
Y - Better candidates highlighted by our
staff of experts.
G - Previously featured
in past reports as yellow but may no longer be buyable under the
guidelines.
***Last / Change / Volume data in this table is the closing quote data***
Symbol/Exchange
Company Name
Industry Group |
PRICE |
CHANGE
(%Change) |
Day High |
Volume
(% DAV)
(% 50 day avg vol) |
52 Wk Hi
% From Hi |
Featured
Date |
Price
Featured |
Pivot Featured |
|
Max Buy |
 ESQ
-
NASDAQ
ESQ
-
NASDAQ
Esquire Financial Hldgs
Finance-Commercial Loans
|
$42.89
|
-0.16
-0.37% |
$43.30
|
14,860
53.07% of 50 DAV
50 DAV is 28,000
|
$48.13
-10.89%
|
10/18/2022
|
$40.02
|
PP = $39.95
|
|
MB = $41.95
|
Most Recent Note - 12/2/2022 5:41:15 PM
G - Pulled back today with below average volume for a 6th loss in the span of 7 sessions. Prior highs and its 50 DMA line ($41.82) coincide in the $41 area defining important near-term support to watch on pullbacks.
>>> FEATURED STOCK ARTICLE : Pulled Back Following "Negative Reversal" at All-Time High - 11/25/2022 |
View all notes |
Set NEW NOTE alert |
Company Profile |
SEC
News |
Chart |
Request a new note
C
A
S
I |
CCRN
-
NASDAQ
Cross Country Healthcare
DIVERSIFIED SERVICES - Staffing and Outsourcing Service
|
$33.52
|
-1.40
-4.01% |
$35.45
|
593,327
73.07% of 50 DAV
50 DAV is 812,000
|
$40.12
-16.45%
|
9/9/2022
|
$27.32
|
PP = $30.61
|
|
MB = $32.14
|
 Most Recent Note - 12/6/2022 5:31:09 PM
G - Suffered a 2nd consecutive loss with below average volume today, but slumped and closed below its 50 DMA line ($33.81) raising concerns. More damaging losses may trigger a worrisome technical sell signal. It recently reported Sep '22 quarterly earnings +75% on +70% sales revenues versus the year ago period.
>>> FEATURED STOCK ARTICLE : Big Loss Testing Support at 50-Day Moving Average - 12/5/2022 |
View all notes |
Set NEW NOTE alert |
Company Profile |
SEC
News |
Chart |
Request a new note
C
A
S
I |
CMC
-
NYSE
Commercial Metals Co
METALS and MINING - Steel and Iron
|
$49.74
|
+0.53
1.08% |
$49.80
|
871,894
88.34% of 50 DAV
50 DAV is 987,000
|
$49.77
-0.06%
|
10/14/2022
|
$41.61
|
PP = $44.45
|
|
MB = $46.67
|
Most Recent Note - 12/2/2022 5:25:00 PM
G - Wedged to another new high today with below average volume. It has posted 9 consecutive weekly gains. Fundamentals remain strong. Prior high in the $44 area defines initial support to watch above its 50 DMA line ($43.59). See the latest FSU analysis for more details and a new annotated graph.
>>> FEATURED STOCK ARTICLE : Wedging Higher With Recent Gains Lacking Great Volume - 12/2/2022 |
View all notes |
Set NEW NOTE alert |
Company Profile |
SEC
News |
Chart |
Request a new note
C
A
S
I |
VRTX
-
NASDAQ
Vertex Pharmaceuticals
Medical-Biomed/Biotech
|
$311.81
|
-5.79
-1.82% |
$317.28
|
1,064,354
70.21% of 50 DAV
50 DAV is 1,516,000
|
$323.61
-3.65%
|
10/24/2022
|
$308.47
|
PP = $306.05
|
|
MB = $321.35
|
Most Recent Note - 12/5/2022 5:26:46 PM
Y - Pulled back today with light volume breaking a streak of 5 consecutive gains. Its 50 DMA line ($304.35) defines near-term support above recent intra-day lows in the $287-288 area. Recently reported Sep '22 quarterly earnings +14% on +18% sales revenues versus the year ago period, below the +25% minimum earnings guideline raising fundamental concerns (C criteria). Annual earnings (A criteria) history has been strong.
>>> FEATURED STOCK ARTICLE : Made Little Progress Following Breakout and Latest Earnings News - 11/16/2022 |
View all notes |
Set NEW NOTE alert |
Company Profile |
SEC
News |
Chart |
Request a new note
C
A
S
I |
GPK
-
NYSE
Graphic Packaging Hldg
CONSUMER NON-DURABLES - Packaging and Containers
|
$22.76
|
+0.29
1.29% |
$22.77
|
2,239,092
77.26% of 50 DAV
50 DAV is 2,898,000
|
$24.07
-5.44%
|
10/25/2022
|
$22.75
|
PP = $24.17
|
|
MB = $25.38
|
Most Recent Note - 12/6/2022 5:36:47 PM
Y - Volume totals have been cooling while still consolidating above its 50 DMA line ($21.80), perched within striking distance of its 52-week high and pivot point. More damaging losses would raise concerns and trigger a technical sell signal. Subsequent gains above the pivot point backed by at least +40% above average volume may trigger a technical buy signal. Fundamentals remain strong.
>>> FEATURED STOCK ARTICLE : Consolidating Above 50-Day Moving Average Still Perched Near High - 11/17/2022 |
View all notes |
Set NEW NOTE alert |
Company Profile |
SEC
News |
Chart |
Request a new note
C
A
S
I |
Symbol/Exchange
Company Name
Industry Group |
PRICE |
CHANGE
(%Change) |
Day High |
Volume
(% DAV)
(% 50 day avg vol) |
52 Wk Hi
% From Hi |
Featured
Date |
Price
Featured |
Pivot Featured |
|
Max Buy |
CBZ
-
NYSE
C B I Z Inc
Comml Svcs-Consulting
|
$48.72
|
-0.39
-0.79% |
$49.20
|
169,675
64.27% of 50 DAV
50 DAV is 264,000
|
$50.57
-3.66%
|
10/26/2022
|
$47.83
|
PP = $48.57
|
|
MB = $51.00
|
Most Recent Note - 12/2/2022 5:28:32 PM
Y - Posted a 3rd consecutive gain with below average volume today as it managed a best-ever close and challenged its 52-week high. Its 50 DMA line ($46.73) and recent low define important near-term support. Recently reported Sep '22 quarterly earnings +24% on +28% sales revenues versus the year ago period.
>>> FEATURED STOCK ARTICLE : Gapped Up and Rebounded Above Pivot Point - 11/18/2022 |
View all notes |
Set NEW NOTE alert |
Company Profile |
SEC
News |
Chart |
Request a new note
C
A
S
I |
ENPH
-
NASDAQ
Enphase Energy Inc
Energy-Solar
|
$309.73
|
-26.09
-7.77% |
$335.00
|
5,595,663
141.77% of 50 DAV
50 DAV is 3,947,000
|
$339.92
-8.88%
|
10/26/2022
|
$301.55
|
PP = $324.94
|
|
MB = $341.19
|
Most Recent Note - 12/6/2022 12:10:04 PM
Y - Pulling back today with volume-running at an above average pace. Stalled after hitting a new all-time high on 12/02/22 with a volume-driven gain above its pivot point. Faces no resistance due to overhead supply. Its 50 DMA line ($286.46) defines near-term support above the recent low ($262.60 on 11/07/22). Fundamentals remain strong.
>>> FEATURED STOCK ARTICLE : Perched Near High Still Awaiting Technical Breakout - 11/21/2022 |
View all notes |
Set NEW NOTE alert |
Company Profile |
SEC
News |
Chart |
Request a new note
C
A
S
I |
HRMY
-
NASDAQ
Harmony Biosciences Holdings
Medical-Biomed/Biotech
|
$59.65
|
-1.26
-2.07% |
$60.67
|
451,466
94.23% of 50 DAV
50 DAV is 479,100
|
$62.09
-3.93%
|
11/1/2022
|
$55.31
|
PP = $57.23
|
|
MB = $60.09
|
Most Recent Note - 12/5/2022 1:06:57 PM
G - Color code is changed to green while hitting a new all-time high and trading near its "max buy" level with today's 4th consecutive small gain marked by near average volume. The 11/17/22 low ($53.06) defines important support to watch coinciding with its 50 DMA line ($53).
>>> FEATURED STOCK ARTICLE : Harmony Still Hovering Near All-Time High - 11/28/2022 |
View all notes |
Set NEW NOTE alert |
Company Profile |
SEC
News |
Chart |
Request a new note
C
A
S
I |
CLH
-
NYSE
Clean Harbors Inc
Pollution Control
|
$117.13
|
-0.47
-0.40% |
$118.62
|
336,118
79.09% of 50 DAV
50 DAV is 425,000
|
$125.41
-6.60%
|
11/2/2022
|
$121.59
|
PP = $124.59
|
|
MB = $130.82
|
Most Recent Note - 12/5/2022 5:20:54 PM
Y - Abruptly reversed from its new all-time high with today's big loss backed by below average volume as it slumped back below the pivot point cited. Its 50 DMA line ($116.40) and recent low ($114.86 on 11/29/22) define important near-term support to watch. Fundamentals remain strong.
>>> FEATURED STOCK ARTICLE : Volume-Driven Losses Undercut 50-Day Moving Average - 11/29/2022 |
View all notes |
Set NEW NOTE alert |
Company Profile |
SEC
News |
Chart |
Request a new note
C
A
S
I |
NPO
-
NYSE
Enpro Industries Inc
Machinery-Gen Industrial
|
$115.24
|
-0.61
-0.53% |
$115.94
|
86,866
87.74% of 50 DAV
50 DAV is 99,000
|
$127.67
-9.74%
|
11/4/2022
|
$119.06
|
PP = $117.73
|
|
MB = $123.62
|
Most Recent Note - 12/5/2022 5:24:41 PM
Y - Pulled back today with higher (near average) volume, sputtering back below its pivot point raising concerns. Fundamentals remain strong.
>>> FEATURED STOCK ARTICLE : Consolidating Near Old Highs Following Recent Breakout - 12/1/2022 |
View all notes |
Set NEW NOTE alert |
Company Profile |
SEC
News |
Chart |
Request a new note
C
A
S
I |
Symbol/Exchange
Company Name
Industry Group |
PRICE |
CHANGE
(%Change) |
Day High |
Volume
(% DAV)
(% 50 day avg vol) |
52 Wk Hi
% From Hi |
Featured
Date |
Price
Featured |
Pivot Featured |
|
Max Buy |
DGII
-
NASDAQ
Digi International Inc
COMPUTER HARDWARE - Networking and Communication Dev
|
$40.16
|
-0.56
-1.38% |
$40.67
|
242,009
60.81% of 50 DAV
50 DAV is 398,000
|
$43.68
-8.06%
|
11/10/2022
|
$41.82
|
PP = $40.96
|
|
MB = $43.01
|
Most Recent Note - 12/6/2022 5:27:37 PM
Y - Pulled back today with lighter volume for a 4th consecutive small loss. Recently wedged above the pivot point cited based on its 10/31/22 high plus 10 cents after forming an advanced "ascending base" pattern. Subsequent gains above the pivot point backed by at least +40% above average volume are needed to confirm a proper technical buy signal. Fundamentals remain strong. See the latest FSU analysis for more details and a new annotated graph.
>>> FEATURED STOCK ARTICLE : Sputtering After Recently Wedging to New Highs - 12/6/2022 |
View all notes |
Set NEW NOTE alert |
Company Profile |
SEC
News |
Chart |
Request a new note
C
A
S
I |
GFF
-
NYSE
Griffon Corporation
MATERIALS and CONSTRUCTION - General Building Materials
|
$35.18
|
+0.48
1.38% |
$35.35
|
300,812
82.19% of 50 DAV
50 DAV is 366,000
|
$36.75
-4.27%
|
11/10/2022
|
$34.13
|
PP = $35.02
|
|
MB = $36.77
|
Most Recent Note - 12/5/2022 5:23:00 PM
Y - Pulled back today with higher (near average) volume following 4 consecutive gains, retreating from near its 52-week high. Prior highs in the $34 area define initial support to watch above its 50 DMA line ($32.26). Reported Sep '22 quarterly earnings +230% on +24% sales revenues versus the year ago period.
>>> FEATURED STOCK ARTICLE : Griffon Perched Near 52-Week High After 9-Week Base - 11/11/2022 |
View all notes |
Set NEW NOTE alert |
Company Profile |
SEC
News |
Chart |
Request a new note
C
A
S
I |
ANET
-
NYSE
Arista Networks Inc
Computer-Networking
|
$129.04
|
-3.79
-2.85% |
$133.76
|
2,067,599
88.89% of 50 DAV
50 DAV is 2,326,000
|
$148.57
-13.15%
|
11/14/2022
|
$132.05
|
PP = $133.70
|
|
MB = $140.39
|
Most Recent Note - 12/6/2022 5:28:41 PM
Y - Pulled back today with near average volume for a 3rd consecutive loss after recently wedging higher. Subsequent gains and a close above the pivot point must be backed by at least +40% above average volume to trigger a proper technical buy signal. Faces some resistance due to overhead supply up to the $148 level. Fundamentals are strong.
>>> FEATURED STOCK ARTICLE : Finished in Middle of Intra-Day Range After Challenging Pivot Point - 11/14/2022 |
View all notes |
Set NEW NOTE alert |
Company Profile |
SEC
News |
Chart |
Request a new note
C
A
S
I |
CPRX
-
NASDAQ
Catalyst Pharma Inc
Medical-Biomed/Biotech
|
$16.46
|
-0.52
-3.06% |
$17.09
|
2,295,563
99.98% of 50 DAV
50 DAV is 2,296,000
|
$18.39
-10.49%
|
11/22/2022
|
$17.38
|
PP = $16.66
|
|
MB = $17.49
|
Most Recent Note - 12/6/2022 5:35:23 PM
Y - Pulled back today for a 2nd consecutive loss with near average volume, but slumped below its pivot point raising some concerns. Still consolidating well above its 50 DMA line ($14.37).
>>> FEATURED STOCK ARTICLE : Breakout From Cup-With-Handle With 90% Above Average Volume - 11/22/2022 |
View all notes |
Set NEW NOTE alert |
Company Profile |
SEC
News |
Chart |
Request a new note
C
A
S
I |
CLFD
-
NASDAQ
Clearfield Inc
TELECOMMUNICATIONS - Cables / Satalite Equipment
|
$110.37
|
-1.64
-1.46% |
$114.54
|
256,770
87.34% of 50 DAV
50 DAV is 294,000
|
$134.90
-18.18%
|
11/23/2022
|
$131.27
|
PP = $130.11
|
|
MB = $136.62
|
Most Recent Note - 12/5/2022 5:17:08 PM
G - Suffered a 3rd consecutive big loss today with higher above average volume, action indicative of more damaging distributional pressure soon after triggering a new technical buy signal, and its color code is changed to green. Disciplined investors always limit losses by selling any stock that falls more than 7-8% from their purchase price.
>>> FEATURED STOCK ARTICLE : Hit New High But Encountered Distributional Pressure - 11/23/2022 |
View all notes |
Set NEW NOTE alert |
Company Profile |
SEC
News |
Chart |
Request a new note
C
A
S
I |
Symbol/Exchange
Company Name
Industry Group |
PRICE |
CHANGE
(%Change) |
Day High |
Volume
(% DAV)
(% 50 day avg vol) |
52 Wk Hi
% From Hi |
Featured
Date |
Price
Featured |
Pivot Featured |
|
Max Buy |
TITN
-
NASDAQ
Titan Machinery Inc
SPECIALTY RETAIL
|
$39.30
|
-2.70
-6.43% |
$42.79
|
596,137
336.80% of 50 DAV
50 DAV is 177,000
|
$44.35
-11.39%
|
11/30/2022
|
$40.10
|
PP = $38.68
|
|
MB = $40.61
|
Most Recent Note - 12/6/2022 12:28:19 PM
Y - Pulling back below its "max buy" level today and its color code is changed to yellow, on track for a 4th consecutive loss with above average volume, consolidating after a technical breakout noted on 11/30/22. Prior high in the $38 area defines initial support to watch. Fundamentals remain strong after reporting Oct '22 quarterly earnings +91% on +47% sales revenues.
>>> FEATURED STOCK ARTICLE : Gap Up and Big Volume-Driven Breakout Gain - 11/30/2022 |
View all notes |
Set NEW NOTE alert |
Company Profile |
SEC
News |
Chart |
Request a new note
C
A
S
I |
|
|
|
THESE ARE NOT BUY RECOMMENDATIONS!
Comments contained in the body of this report are technical
opinions only. The material herein has been obtained
from sources believed to be reliable and accurate, however,
its accuracy and completeness cannot be guaranteed.
This site is not an investment advisor, hence it does
not endorse or recommend any securities or other investments.
Any recommendation contained in this report may not
be suitable for all investors and it is not to be deemed
an offer or solicitation on our part with respect to
the purchase or sale of any securities. All trademarks,
service marks and trade names appearing in this report
are the property of their respective owners, and are
likewise used for identification purposes only.
This report is a service available
only to active Paid Premium Members.
You may opt-out of receiving report notifications
at any time. Questions or comments may be submitted
by writing to Premium Membership Services 665 S.E. 10 Street, Suite 201 Deerfield Beach, FL 33441-5634 or by calling 1-800-965-8307
or 954-785-1121.
|
|
|