You are not logged in.
This means you
CAN ONLY VIEW reports that were published prior to Monday, March 24, 2025.
You
MUST UPGRADE YOUR MEMBERSHIP if you want to see any current reports.
AFTER MARKET UPDATE - FRIDAY, NOVEMBER 18TH, 2022
Previous After Market Report Next After Market Report >>>
|
|
|
|
DOW |
+199.37 |
33,745.69 |
+0.59% |
|
Volume |
961,771,711 |
+15% |
|
Volume |
4,066,188,700 |
-5% |
|
NASDAQ |
+1.10 |
11,146.06 |
+0.01% |
|
Advancers |
1,809 |
60% |
|
Advancers |
2,442 |
53% |
|
S&P 500 |
+18.78 |
3,965.34 |
+0.48% |
|
Decliners |
1,222 |
40% |
|
Decliners |
2,150 |
47% |
|
Russell 2000 |
+10.61 |
1,849.73 |
+0.58% |
|
52 Wk Highs |
70 |
|
|
52 Wk Highs |
73 |
|
|
S&P 600 |
+7.78 |
1,218.14 |
+0.64% |
|
52 Wk Lows |
42 |
|
|
52 Wk Lows |
186 |
|
|
 |
Major Indices Finished Week With Better Leadership
Kenneth J. Gruneisen - Passed the CAN SLIM® Master's Exam
The Dow added 199 points, though finished the week little changed. The Nasdaq Composite traded just above the flat line and shed 1.6% for the week. The S&P 500 added 0.5%, but notched a 0.7% weekly decline. The volume totals reported were mixed, higher than the prior session total on the NYSE and lighter on the Nasdaq exchange. Breadth was positive as advancers led decliners by a 3-2 margin on the NYSE and by a narrower margin on the Nasdaq exchange. There were 24 high-ranked companies from the Leaders List that hit new 52-week highs and were listed on the BreakOuts Page, versus the total of 8 on the prior session. New 52-week highs outnumbered new 52-week lows on the NYSE but new lows still outnumbered new highs on the Nasdaq exchange. The market is in a confirmed uptrend (M criteria). Healthy leadership (new 52-week highs totals) has continued to help the rally be productive. Only stocks meeting all key-criteria of the fact-based investment system should be considered as buy candidates.
Chart courtesy of www.stockcharts.com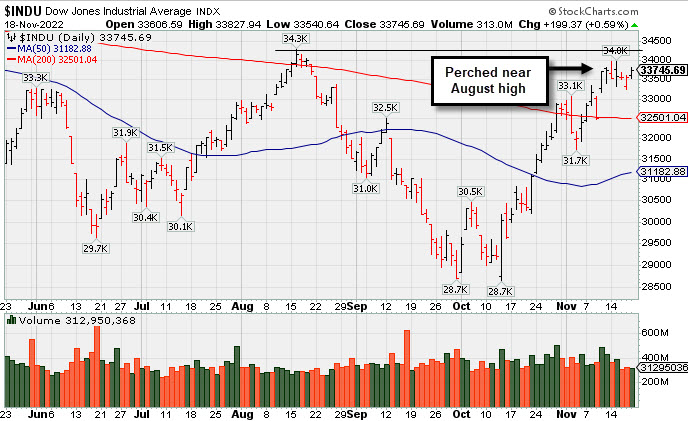 PICTURED: The Dow Jones Industrial Average posted a gain while perched near its August high. Of the 3 major indices only the Dow is in "healthy shape" above its 200 DMA line.
U.S. equities finished higher Friday, but ended lower for the week, as investors digested this week’s mixed retail earnings reports and a slew of commentary from Federal Reserve (Fed) officials. Today, Boston Fed President Susan Collins said she believed the central bank could curb inflation without hurting the economy too much. Nine of 11 S&P 500 sectors finished today in positive territory, with Utilities pacing gains.
On the data front today, existing home sales fell 5.9% in October, its ninth-straight month of declines, as high mortgage rates weigh on demand. Elsewhere, the Conference Board Leading Economic Index (a metric used to forecast future economic activity based on ten key variables) fell more than expected in October, signaling a potential recession.
Treasuries weakened following the hawkish commentary from Fed officials. The yield on the benchmark 10-year note climbed six basis points (0.06%) to 3.82%, while the 30-year bond yield advanced five basis points (0.05%) to 3.92%. The Fed-sensitive two-year note yield increased eight basis points (0.08%) to 4.53%. In commodities, West Texas Intermediate (WTI) crude fell 1.7% to $80.27/barrel amid continued concerns over global demand and uncertainty over the future course of interest rate hikes by the Fed. The domestic benchmark shed 9.9% this week to notch its second-straight week of declines. |
 Kenneth J. Gruneisen started out as a licensed stockbroker in August 1987, a couple of months prior to the historic stock market crash that took the Dow Jones Industrial Average down -22.6% in a single day. He has published daily fact-based fundamental and technical analysis on high-ranked stocks online for two decades. Through FACTBASEDINVESTING.COM, Kenneth provides educational articles, news, market commentary, and other information regarding proven investment systems that work in good times and bad.
Comments contained in the body of this report are technical opinions only and are not necessarily those of Gruneisen Growth Corp. The material herein has been obtained from sources believed to be reliable and accurate, however, its accuracy and completeness cannot be guaranteed. Our firm, employees, and customers may effect transactions, including transactions contrary to any recommendation herein, or have positions in the securities mentioned herein or options with respect thereto. Any recommendation contained in this report may not be suitable for all investors and it is not to be deemed an offer or solicitation on our part with respect to the purchase or sale of any securities. |
|
 |
Financial, Networking, and Gold & Silver Indexes Rose
Kenneth J. Gruneisen - Passed the CAN SLIM® Master's Exam
The Bank Index ($BKX +0.79%) and Broker/Dealer Index ($XBD +0.59%) both edged higher. The Networking Index ($NWX +2.22%) led the tech sector higher while the Biotech Index ($BTK +0.45%) and Semiconductor Index ($SOX +0.18%) posted smaller gains. Commodity-linked groups were mixed as the Oil Services Index ($OSX -0.79%) and Integrated Oil Index ($XOI -1.23%) both lost ground while the Gold & Silver Index ($XAU +0.88%) posted a modest gain.
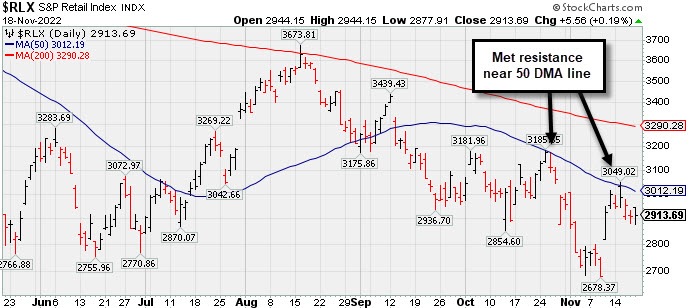
PICTURED: The Retail Index ($RLX +0.19%) remains below its 50-day moving average (DMA) line which has recently acted as resistance.
| Oil Services |
$OSX |
85.01 |
-0.68 |
-0.79% |
+61.25% |
| Integrated Oil |
$XOI |
1,883.48 |
-23.45 |
-1.23% |
+59.86% |
| Semiconductor |
$SOX |
2,724.03 |
+4.93 |
+0.18% |
-30.97% |
| Networking |
$NWX |
810.83 |
+17.63 |
+2.22% |
-16.50% |
| Broker/Dealer |
$XBD |
469.03 |
+2.76 |
+0.59% |
-3.66% |
| Retail |
$RLX |
2,913.69 |
+5.56 |
+0.19% |
-31.06% |
| Gold & Silver |
$XAU |
113.80 |
+0.99 |
+0.88% |
-14.08% |
| Bank |
$BKX |
105.86 |
+0.83 |
+0.79% |
-19.94% |
| Biotech |
$BTK |
5,184.97 |
+23.16 |
+0.45% |
-6.04% |
|
|
|
 |
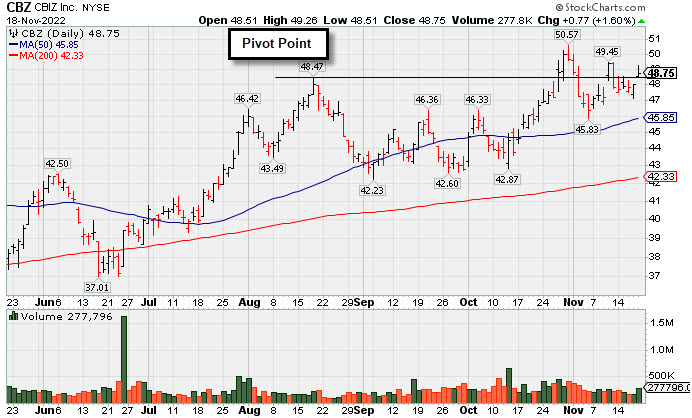
Gapped Up and Rebounded Above Pivot Point
Kenneth J. Gruneisen - Passed the CAN SLIM® Master's Exam
C B I Z Inc (CBZ +$0.76 or +1.58% to $48.74) gapped up today for a small gain with light volume yet rebounded above its pivot point. Its 50-day moving average (DMA) line ($45.85) and recent low define important near-term support. Recently reported Sep '22 quarterly earnings +24% on +28% sales revenues versus the year ago period.
CBZ was highlighted in yellow in the 1`0/26/22 mid-day report and last shown in greater detail that evening with an annotated graph under the headline, "Earnings Report Due for Commercial Services and Consulting Firm." The company has a 95 Earnings Per Share Rating. It reported earnings +26% on +30% sales revenues for the Jun '22 quarter versus the year ago period, its 2nd strong quarter above the +25% minimum earnings guideline (C criteria). Annual earnings (A criteria) history has been strong.
The number of top-rated funds owning its shares rose from 361 in Dec '21 to 376 in Sep '22. Its current Up/Down Volume Ratio of 0.8 is an unbiased indication its shares have been under slight distributional pressure over the past 50 days. There are only 50.8 million shares outstanding (S criteria) which can contribute to greater volatility in the event of institutional buying or selling. It has an A Timeliness Rating and a B Sponsorship Rating.
|
|
|
Color Codes Explained :
Y - Better candidates highlighted by our
staff of experts.
G - Previously featured
in past reports as yellow but may no longer be buyable under the
guidelines.
***Last / Change / Volume data in this table is the closing quote data***
Symbol/Exchange
Company Name
Industry Group |
PRICE |
CHANGE
(%Change) |
Day High |
Volume
(% DAV)
(% 50 day avg vol) |
52 Wk Hi
% From Hi |
Featured
Date |
Price
Featured |
Pivot Featured |
|
Max Buy |
 ESQ
-
NASDAQ
ESQ
-
NASDAQ
Esquire Financial Hldgs
Finance-Commercial Loans
|
$44.98
|
+0.64
1.44% |
$45.53
|
13,994
48.26% of 50 DAV
50 DAV is 29,000
|
$48.13
-6.54%
|
10/18/2022
|
$40.02
|
PP = $39.95
|
|
MB = $41.95
|
Most Recent Note - 11/17/2022 12:35:07 PM
G - Volume totals have been average or lighter while consolidating. Well above prior highs in the $41 area which define support to watch along with its 50 DMA line ($40.60).
>>> FEATURED STOCK ARTICLE : New High With 6th Consecutive Volume-Driven Gain - 10/31/2022 |
View all notes |
Set NEW NOTE alert |
Company Profile |
SEC
News |
Chart |
Request a new note
C
A
S
I |
CCRN
-
NASDAQ
Cross Country Healthcare
DIVERSIFIED SERVICES - Staffing and Outsourcing Service
|
$34.97
|
+1.13
3.34% |
$35.94
|
724,942
78.80% of 50 DAV
50 DAV is 920,000
|
$40.12
-12.84%
|
9/9/2022
|
$27.32
|
PP = $30.61
|
|
MB = $32.14
|
 Most Recent Note - 11/18/2022 4:19:45 PM
Y - Posted a 5th consecutive gain today after a prompt rebound above the 50 DMA line ($32.28) helped its outlook improve. Prior highs in the $30.50 area define important near-term support to watch where more damaging losses would trigger a technical sell signal. Reported Sep '22 quarterly earnings +75% on +70% sales revenues versus the year ago period.
>>> FEATURED STOCK ARTICLE : Consolidating Above Prior Highs and Above 50-Day Moving Average - 11/8/2022 |
View all notes |
Set NEW NOTE alert |
Company Profile |
SEC
News |
Chart |
Request a new note
C
A
S
I |
CMC
-
NYSE
Commercial Metals Co
METALS and MINING - Steel and Iron
|
$47.46
|
-0.19
-0.40% |
$48.22
|
564,952
52.41% of 50 DAV
50 DAV is 1,078,000
|
$49.41
-3.95%
|
10/14/2022
|
$41.61
|
PP = $44.45
|
|
MB = $46.67
|
Most Recent Note - 11/17/2022 5:20:13 PM
G - Posted a gain today with light volume, hovering near its all-time high. Fundamentals remain strong. Prior high in the $44 area defines initial support to watch on pullbacks.
>>> FEATURED STOCK ARTICLE : Steel/Metal Products Firm Quietly Perched Near All Time High - 11/7/2022 |
View all notes |
Set NEW NOTE alert |
Company Profile |
SEC
News |
Chart |
Request a new note
C
A
S
I |
VRTX
-
NASDAQ
Vertex Pharmaceuticals
Medical-Biomed/Biotech
|
$314.63
|
+4.73
1.53% |
$315.54
|
1,172,279
79.53% of 50 DAV
50 DAV is 1,474,000
|
$318.38
-1.18%
|
10/24/2022
|
$308.47
|
PP = $306.05
|
|
MB = $321.35
|
Most Recent Note - 11/18/2022 4:23:00 PM
Y - Posted a 3rd consecutive gain today with light volume yet managed a best-ever close. Its 50 DMA line ($298) defines near-term support above recent intra-day lows in the $287-288 area. Recently reported Sep '22 quarterly earnings +14% on +18% sales revenues versus the year ago period, below the +25% minimum earnings guideline raising fundamental concerns (C criteria). Annual earnings (A criteria) history has been strong.
>>> FEATURED STOCK ARTICLE : Made Little Progress Following Breakout and Latest Earnings News - 11/16/2022 |
View all notes |
Set NEW NOTE alert |
Company Profile |
SEC
News |
Chart |
Request a new note
C
A
S
I |
GPK
-
NYSE
Graphic Packaging Hldg
CONSUMER NON-DURABLES - Packaging and Containers
|
$22.53
|
+0.25
1.12% |
$22.61
|
2,227,987
75.27% of 50 DAV
50 DAV is 2,960,000
|
$24.07
-6.40%
|
10/25/2022
|
$22.75
|
PP = $24.17
|
|
MB = $25.38
|
Most Recent Note - 11/17/2022 5:15:29 PM
Y - Volume totals are cooling while consolidating above its 50 DMA line ($21.59). More damaging losses would raise concerns and trigger a technical sell signal. Subsequent gains above the pivot point backed by at least +40% above average volume may trigger a technical buy signal. Fundamentals remain strong. See the latest FSU analysis for more details and a new annotated graph.
>>> FEATURED STOCK ARTICLE : Consolidating Above 50-Day Moving Average Still Perched Near High - 11/17/2022 |
View all notes |
Set NEW NOTE alert |
Company Profile |
SEC
News |
Chart |
Request a new note
C
A
S
I |
Symbol/Exchange
Company Name
Industry Group |
PRICE |
CHANGE
(%Change) |
Day High |
Volume
(% DAV)
(% 50 day avg vol) |
52 Wk Hi
% From Hi |
Featured
Date |
Price
Featured |
Pivot Featured |
|
Max Buy |
CBZ
-
NYSE
C B I Z Inc
Comml Svcs-Consulting
|
$48.75
|
+0.77
1.60% |
$49.26
|
285,303
103.75% of 50 DAV
50 DAV is 275,000
|
$50.57
-3.60%
|
10/26/2022
|
$47.83
|
PP = $48.57
|
|
MB = $51.00
|
Most Recent Note - 11/18/2022 4:21:08 PM
Y - Gapped up today for a small gain with light volume yet rebounded above its pivot point. Its 50 DMA line ($45.85) and recent low define important near-term support. Recently reported Sep '22 quarterly earnings +24% on +28% sales revenues versus the year ago period.
>>> FEATURED STOCK ARTICLE : Gapped Up and Rebounded Above Pivot Point - 11/18/2022 |
View all notes |
Set NEW NOTE alert |
Company Profile |
SEC
News |
Chart |
Request a new note
C
A
S
I |
ENPH
-
NASDAQ
Enphase Energy Inc
Energy-Solar
|
$311.94
|
-1.02
-0.33% |
$322.65
|
10,448,721
259.60% of 50 DAV
50 DAV is 4,025,000
|
$324.84
-3.97%
|
10/26/2022
|
$301.55
|
PP = $324.94
|
|
MB = $341.19
|
Most Recent Note - 11/18/2022 12:42:49 PM
Y - Reversed into the red after early gains challenging its 52-week high. Posted 4 consecutive gains and it is perched within striking distance of its pivot point. Faces no resistance due to overhead supply up to the $324 level. Its 50 DMA line ($283) defines near-term support above the recent low ($262.60 on 11/07/22). Fundamentals remain strong.
>>> FEATURED STOCK ARTICLE : Enphase Energy Rebound Above 50-Day Moving Average Helped Outlook - 10/28/2022 |
View all notes |
Set NEW NOTE alert |
Company Profile |
SEC
News |
Chart |
Request a new note
C
A
S
I |
HRMY
-
NASDAQ
Harmony Biosciences Holdings
Medical-Biomed/Biotech
|
$57.01
|
+0.95
1.69% |
$57.50
|
247,043
4,622.81% of 50 DAV
50 DAV is 5,344
|
$61.55
-7.38%
|
11/1/2022
|
$55.31
|
PP = $57.23
|
|
MB = $60.09
|
Most Recent Note - 11/18/2022 12:59:28 PM
Y - Managed a "positive reversal" on the prior session after early weakness. Recently testing near prior highs in the $57 area that define initial support to watch above its 50 DMA line ($50.10).
>>> FEATURED STOCK ARTICLE : Volume Heavy Behind Technical Breakout After Earnings - 11/1/2022 |
View all notes |
Set NEW NOTE alert |
Company Profile |
SEC
News |
Chart |
Request a new note
C
A
S
I |
CLH
-
NYSE
Clean Harbors Inc
Pollution Control
|
$117.00
|
+0.67
0.58% |
$118.25
|
365,617
80.71% of 50 DAV
50 DAV is 453,000
|
$124.49
-6.02%
|
11/2/2022
|
$121.59
|
PP = $124.59
|
|
MB = $130.82
|
Most Recent Note - 11/16/2022 3:27:42 PM
G - Near its 50 DMA line ($116.02) with today's gain, but a rebound above the 50 DMA line is needed for its outlook to improve. Fundamentals remain strong after reporting Sep '22 quarterly earnings +113% on +43% sales revenues versus the year ago period.
>>> FEATURED STOCK ARTICLE : Testing 50 Day Moving Average Line After Forming New Base - 11/2/2022 |
View all notes |
Set NEW NOTE alert |
Company Profile |
SEC
News |
Chart |
Request a new note
C
A
S
I |
NPO
-
NYSE
Enpro Industries Inc
Machinery-Gen Industrial
|
$118.49
|
-2.01
-1.67% |
$123.00
|
131,151
132.48% of 50 DAV
50 DAV is 99,000
|
$127.67
-7.19%
|
11/4/2022
|
$119.06
|
PP = $117.73
|
|
MB = $123.62
|
Most Recent Note - 11/16/2022 3:25:57 PM
Y - Color code is changed to yellow while pulling back with below average volume today, undercutting its "max buy" level. Reported Sep '22 quarterly earnings +65% on +34% sales revenues versus the year ago period, its 3rd strong quarterly comparison above the +25% minimum earnings guideline (C criteria), helping it better match the winning models of the fact-based investment system. Annual earnings growth has been steady even through the pandemic.
>>> FEATURED STOCK ARTICLE : Finished Strong After Highlighted in Friday Mid-Day Report - 11/4/2022 |
View all notes |
Set NEW NOTE alert |
Company Profile |
SEC
News |
Chart |
Request a new note
C
A
S
I |
Symbol/Exchange
Company Name
Industry Group |
PRICE |
CHANGE
(%Change) |
Day High |
Volume
(% DAV)
(% 50 day avg vol) |
52 Wk Hi
% From Hi |
Featured
Date |
Price
Featured |
Pivot Featured |
|
Max Buy |
DGII
-
NASDAQ
Digi International Inc
COMPUTER HARDWARE - Networking and Communication Dev
|
$41.53
|
+2.03
5.14% |
$41.67
|
320,668
76.53% of 50 DAV
50 DAV is 419,000
|
$42.04
-1.21%
|
11/10/2022
|
$41.82
|
PP = $40.96
|
|
MB = $43.01
|
Most Recent Note - 11/18/2022 4:10:45 PM
Y - Posted a gain today with below average volume for a best-ever close. Recently wedged above the pivot point cited based on its 10/31/22 high plus 10 cents after forming an advanced "ascending base" pattern. Subsequent gains above the pivot point backed by at least +40% above average volume are needed to confirm a proper technical buy signal. Reported Sep '22 quarterly earnings +80% versus the year ago period, its 3rd strong quarterly comparison well above the +25% minimum earnings guideline (C criteria), helping it better match the fact-based investment system's winning models. Annual earnings (A criteria) history has been strong after a downturn in FY '17-18.
>>> FEATURED STOCK ARTICLE : Finish Below Pivot Point Leaves Disciplined Investors Waiting - 11/10/2022 |
View all notes |
Set NEW NOTE alert |
Company Profile |
SEC
News |
Chart |
Request a new note
C
A
S
I |
GFF
-
NYSE
Griffon Corporation
MATERIALS and CONSTRUCTION - General Building Materials
|
$36.16
|
+2.91
8.75% |
$36.17
|
1,150,909
333.60% of 50 DAV
50 DAV is 345,000
|
$34.92
3.55%
|
11/10/2022
|
$34.13
|
PP = $35.02
|
|
MB = $36.77
|
Most Recent Note - 11/18/2022 12:52:12 PM
Y - Hitting a new 52-weeek high and rallying above the pivot point with today's big volume-driven gain. On the prior session it briefly undercut its 50 DMA line ($31.48) which defines important near-term support. Reported Sep '22 quarterly earnings +230% versus the year ago period. Volume and volatility often increase near earnings news. A gain and strong close above the pivot point backed by at least +40% above average volume may trigger a technical buy signal.
>>> FEATURED STOCK ARTICLE : Griffon Perched Near 52-Week High After 9-Week Base - 11/11/2022 |
View all notes |
Set NEW NOTE alert |
Company Profile |
SEC
News |
Chart |
Request a new note
C
A
S
I |
ANET
-
NYSE
Arista Networks Inc
Computer-Networking
|
$135.48
|
+3.42
2.59% |
$135.70
|
1,942,728
78.27% of 50 DAV
50 DAV is 2,482,000
|
$148.57
-8.81%
|
11/14/2022
|
$132.05
|
PP = $133.70
|
|
MB = $140.39
|
Most Recent Note - 11/18/2022 4:26:30 PM
Y - Posted a gain with light volume for its best close since April 5th, wedging higher after a cup-with-handle base. Subsequent gains and a close above the pivot point backed by at least +40% above average volume are needed to trigger a proper technical buy signal. Faces some resistance due to overhead supply up to the $148 level. Fundamentals are strong.
>>> FEATURED STOCK ARTICLE : Finished in Middle of Intra-Day Range After Challenging Pivot Point - 11/14/2022 |
View all notes |
Set NEW NOTE alert |
Company Profile |
SEC
News |
Chart |
Request a new note
C
A
S
I |
|
|
|
THESE ARE NOT BUY RECOMMENDATIONS!
Comments contained in the body of this report are technical
opinions only. The material herein has been obtained
from sources believed to be reliable and accurate, however,
its accuracy and completeness cannot be guaranteed.
This site is not an investment advisor, hence it does
not endorse or recommend any securities or other investments.
Any recommendation contained in this report may not
be suitable for all investors and it is not to be deemed
an offer or solicitation on our part with respect to
the purchase or sale of any securities. All trademarks,
service marks and trade names appearing in this report
are the property of their respective owners, and are
likewise used for identification purposes only.
This report is a service available
only to active Paid Premium Members.
You may opt-out of receiving report notifications
at any time. Questions or comments may be submitted
by writing to Premium Membership Services 665 S.E. 10 Street, Suite 201 Deerfield Beach, FL 33441-5634 or by calling 1-800-965-8307
or 954-785-1121.
|
|
|