You are not logged in.
This means you
CAN ONLY VIEW reports that were published prior to Monday, March 24, 2025.
You
MUST UPGRADE YOUR MEMBERSHIP if you want to see any current reports.
AFTER MARKET UPDATE - FRIDAY, NOVEMBER 25TH, 2022
Previous After Market Report Next After Market Report >>>
|
|
|
|
DOW |
+152.97 |
34,347.03 |
+0.45% |
|
Volume |
356,950,580 |
-46% |
|
Volume |
2,141,814,327 |
-51% |
|
NASDAQ |
-58.96 |
11,226.36 |
-0.52% |
|
Advancers |
1,848 |
63% |
|
Advancers |
2,503 |
58% |
|
S&P 500 |
-1.14 |
4,026.12 |
-0.03% |
|
Decliners |
1,068 |
37% |
|
Decliners |
1,815 |
42% |
|
Russell 2000 |
+5.67 |
1,869.19 |
+0.30% |
|
52 Wk Highs |
63 |
|
|
52 Wk Highs |
91 |
|
|
S&P 600 |
+2.54 |
1,232.44 |
+0.21% |
|
52 Wk Lows |
30 |
|
|
52 Wk Lows |
96 |
|
|
 |
Major Indices Posted Weekly Gains
Kenneth J. Gruneisen - Passed the CAN SLIM® Master's Exam
The Dow added 152 points, while the Nasdaq Composite decreased 0.5%. The S&P 500 remained unchanged. All three indices ended the week higher as the Dow added 1.8%, the tech heavy Nasdaq increased 0.7%, and the S&P 500 gained 1.5%. Volume totals on the shortened session were lighter than the prior session on the NYSE and on the Nasdaq exchange. Breadth was positive as advancers led decliners by more than a 3-2 margin on the NYSE and 4-3 on the Nasdaq exchange. There were 32 high-ranked companies from the Leaders List that hit new 52-week highs and were listed on the BreakOuts Page, versus the total of 45 on the prior session. New 52-week highs outnumbered new 52-week lows on the NYSE but new lows still outnumbered new highs on the Nasdaq exchange. The market is in a confirmed uptrend (M criteria). Healthy leadership (new 52-week highs totals) has continued to help the rally be productive. Only stocks meeting all key-criteria of the fact-based investment system should be considered as buy candidates.
Chart courtesy of www.stockcharts.com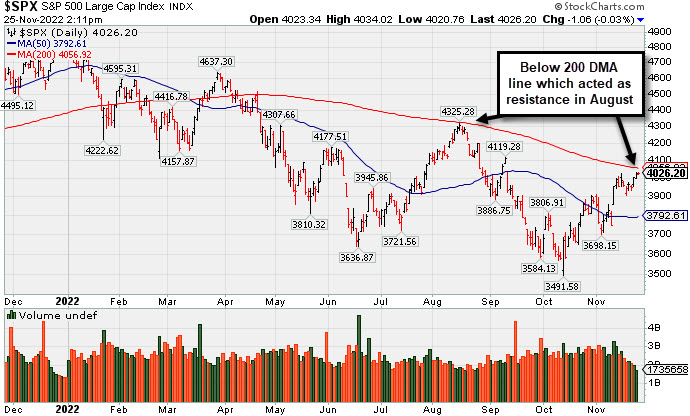 PICTURED: The S&P 500 Index is just below its 200-day moving average (DMA) line which acted as resistance in August. Of the 3 major indices only the Dow is in "healthy shape" above its 200 DMA line.
U.S. equities finished mixed Friday as investors look to close out the short holiday week with a look into this year’s Black Friday sales amid high inflation. While recent retail data suggested consumers are continuing to spend, some analysts have a mixed outlook on sales for the holiday season. The S&P Global Market Intelligence estimated holiday sales to increase 4.5% this year compared to last year’s 12.6% growth. Seven of the 11 sectors in the S&P 500 finished in positive territory, with Real Estate and Utilities pacing gains.
Treasury yields finished little changed Friday, as market participants continue to assess the Federal Reserve’s (Fed’s) meeting minutes from Wednesday which suggested a possible slowdown in interest rate hikes. The yield on the benchmark 10-year note remained unchanged at 3.69%, while the 30-year bond yield added three basis points (0.03%) to 3.75%. The yield on the two-year note dipped one basis point (0.01%) to 4.47%. In commodities, West Texas Intermediate (WTI) crude declined 1.4% to $76.87/barrel, ending the week down 4.3%, as global diplomats continue to discuss Russian price caps at the G7 Summit. While an agreement still hasn’t been reached ahead of the December 5 start date, the price cap is forecasted to be between $65 and $70 a barrel.
|
 Kenneth J. Gruneisen started out as a licensed stockbroker in August 1987, a couple of months prior to the historic stock market crash that took the Dow Jones Industrial Average down -22.6% in a single day. He has published daily fact-based fundamental and technical analysis on high-ranked stocks online for two decades. Through FACTBASEDINVESTING.COM, Kenneth provides educational articles, news, market commentary, and other information regarding proven investment systems that work in good times and bad.
Comments contained in the body of this report are technical opinions only and are not necessarily those of Gruneisen Growth Corp. The material herein has been obtained from sources believed to be reliable and accurate, however, its accuracy and completeness cannot be guaranteed. Our firm, employees, and customers may effect transactions, including transactions contrary to any recommendation herein, or have positions in the securities mentioned herein or options with respect thereto. Any recommendation contained in this report may not be suitable for all investors and it is not to be deemed an offer or solicitation on our part with respect to the purchase or sale of any securities. |
|
 |
Financial Indexes Inched Higher
Kenneth J. Gruneisen - Passed the CAN SLIM® Master's Exam
The Bank Index ($BKX +0.36%) and Broker/Dealer Index ($XBD +0.30%) both eked out small gains while the Retail Index ($RLX +0.03%) finished flat on Friday. The Semiconductor Index ($SOX -1.26%) slumped while the Networking Index ($NWX +0.25%) posted a tiny gain. The Gold & Silver Index ($XAU -1.05%) outpaced the Oil Services Index ($OSX -0.76%) to the downside and the Integrated Oil Index ($XOI -0.13%) also inched lower.
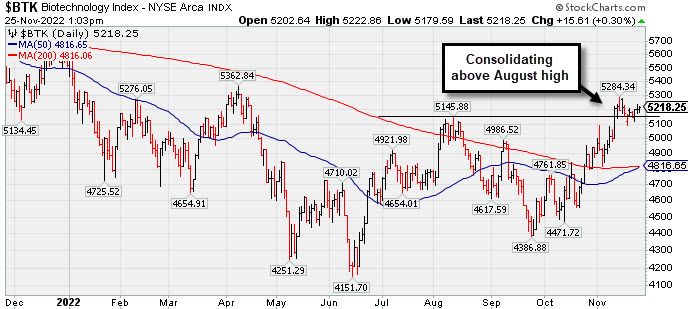
PICTURED: The Biotech Index ($BTK +0.30%) has been consolidating above its August high.
| Oil Services |
$OSX |
82.94 |
-0.64 |
-0.76% |
+57.32% |
| Integrated Oil |
$XOI |
1,890.98 |
-2.51 |
-0.13% |
+60.50% |
| Semiconductor |
$SOX |
2,751.27 |
-35.15 |
-1.26% |
-30.28% |
| Networking |
$NWX |
822.47 |
+2.04 |
+0.25% |
-15.30% |
| Broker/Dealer |
$XBD |
476.31 |
+1.45 |
+0.30% |
-2.17% |
| Retail |
$RLX |
2,944.56 |
+0.79 |
+0.03% |
-30.33% |
| Gold & Silver |
$XAU |
118.26 |
-1.26 |
-1.05% |
-10.72% |
| Bank |
$BKX |
107.99 |
+0.38 |
+0.36% |
-18.33% |
| Biotech |
$BTK |
5,218.18 |
+15.54 |
+0.30% |
-5.44% |
|
|
|
 |
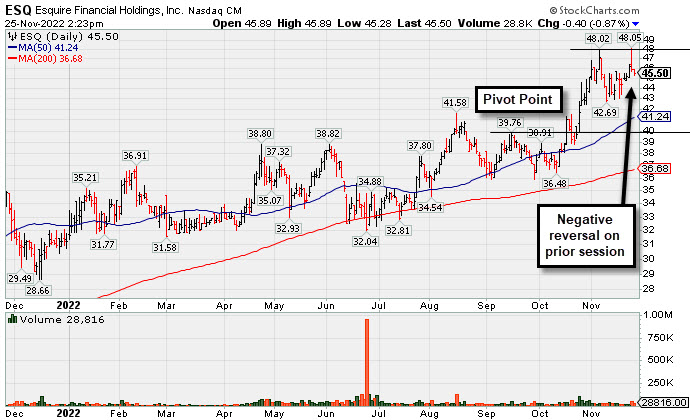
Pulled Back Following "Negative Reversal" at All-Time High
Kenneth J. Gruneisen - Passed the CAN SLIM® Master's Exam
Esquire Financial Hldgs (ESQ -$0.80 or -1.74% to $45.10) pulled back today. It challenged its high on the prior session but there was a "negative reversal" and it closed near the session low with a small loss on above average volume. Prior highs and its 50-day moving average (DMA) line coincide in the $41 area defining important near-term support to watch.
ESQ was highlighted in yellow with pivot point cited based on its 9/16/22 high plus 10 cents. It was last shown in this FSU section on 10/31/22 with an annotated graph under the headline, "New High With 6th Consecutive Volume-Driven Gain". This thinly-traded holding company in the Finance - Commercial Loans industry group has a small supply (S criteria) of only 6.5 million shares in the public float, which can contribute to greater price volatility in the event of institutional buying or selling. It completed its $14 IPO on 6/29/17. The number of top-rated funds owning its shares rose form 64 in Sep '21 to 167 in Sep '22, a reassuring sign concerning the I criteria. Its current Up/Down Volume Ratio of 1.7 is an unbiased indication its shares have been under accumulation over the past 50 days.
ESQ has a 98 Earnings Per Share Rating. It reported earnings +49% on +36% sales revenues for the Sep '22 quarter versus the year-ago period, the 5th consecutive quarterly comparison with an earnings increase above the +25% minimum guideline. Its annual earnings growth (A criteria) history has been strong.
|
|
|
Color Codes Explained :
Y - Better candidates highlighted by our
staff of experts.
G - Previously featured
in past reports as yellow but may no longer be buyable under the
guidelines.
***Last / Change / Volume data in this table is the closing quote data***
Symbol/Exchange
Company Name
Industry Group |
PRICE |
CHANGE
(%Change) |
Day High |
Volume
(% DAV)
(% 50 day avg vol) |
52 Wk Hi
% From Hi |
Featured
Date |
Price
Featured |
Pivot Featured |
|
Max Buy |
 ESQ
-
NASDAQ
ESQ
-
NASDAQ
Esquire Financial Hldgs
Finance-Commercial Loans
|
$45.10
|
-0.80
-1.74% |
$45.89
|
36,744
126.70% of 50 DAV
50 DAV is 29,000
|
$48.13
-6.30%
|
10/18/2022
|
$40.02
|
PP = $39.95
|
|
MB = $41.95
|
 Most Recent Note - 11/25/2022 2:46:06 PM
G - Lost ground today after a "negative reversal" on the prior session with above average volume. Prior highs and its 50 DMA line coincide in the $41 area defining important near-term support to watch on pullbacks. See the latest FSU analysis for more details and a new annotated graph.
>>> FEATURED STOCK ARTICLE : Pulled Back Following "Negative Reversal" at All-Time High - 11/25/2022 |
View all notes |
Set NEW NOTE alert |
Company Profile |
SEC
News |
Chart |
Request a new note
C
A
S
I |
CCRN
-
NASDAQ
Cross Country Healthcare
DIVERSIFIED SERVICES - Staffing and Outsourcing Service
|
$35.32
|
+0.11
0.31% |
$36.17
|
214,474
24.97% of 50 DAV
50 DAV is 859,000
|
$40.12
-11.96%
|
9/9/2022
|
$27.32
|
PP = $30.61
|
|
MB = $32.14
|
Most Recent Note - 11/22/2022 6:18:52 PM
Y - Posted a gain today, consolidating above its 50 DMA line ($32.62). Reported Sep '22 quarterly earnings +75% on +70% sales revenues versus the year ago period.
>>> FEATURED STOCK ARTICLE : Consolidating Above Prior Highs and Above 50-Day Moving Average - 11/8/2022 |
View all notes |
Set NEW NOTE alert |
Company Profile |
SEC
News |
Chart |
Request a new note
C
A
S
I |
CMC
-
NYSE
Commercial Metals Co
METALS and MINING - Steel and Iron
|
$47.97
|
-0.11
-0.23% |
$48.49
|
168,216
15.96% of 50 DAV
50 DAV is 1,054,000
|
$49.41
-2.91%
|
10/14/2022
|
$41.61
|
PP = $44.45
|
|
MB = $46.67
|
Most Recent Note - 11/22/2022 6:13:29 PM
G - Posted a gain today with below average for a best-ever close. Fundamentals remain strong. Prior high in the $44 area defines initial support to watch on pullbacks.
>>> FEATURED STOCK ARTICLE : Steel/Metal Products Firm Quietly Perched Near All Time High - 11/7/2022 |
View all notes |
Set NEW NOTE alert |
Company Profile |
SEC
News |
Chart |
Request a new note
C
A
S
I |
VRTX
-
NASDAQ
Vertex Pharmaceuticals
Medical-Biomed/Biotech
|
$312.98
|
-3.18
-1.01% |
$317.03
|
712,994
49.27% of 50 DAV
50 DAV is 1,447,000
|
$323.61
-3.28%
|
10/24/2022
|
$308.47
|
PP = $306.05
|
|
MB = $321.35
|
Most Recent Note - 11/25/2022 2:55:05 PM
Y - Pulled back for a 2nd consecutive loss today with lighter volume. Its 50 DMA line ($300.44) defines near-term support above recent intra-day lows in the $287-288 area. Recently reported Sep '22 quarterly earnings +14% on +18% sales revenues versus the year ago period, below the +25% minimum earnings guideline raising fundamental concerns (C criteria). Annual earnings (A criteria) history has been strong.
>>> FEATURED STOCK ARTICLE : Made Little Progress Following Breakout and Latest Earnings News - 11/16/2022 |
View all notes |
Set NEW NOTE alert |
Company Profile |
SEC
News |
Chart |
Request a new note
C
A
S
I |
GPK
-
NYSE
Graphic Packaging Hldg
CONSUMER NON-DURABLES - Packaging and Containers
|
$22.78
|
+0.20
0.89% |
$22.89
|
736,358
24.55% of 50 DAV
50 DAV is 3,000,000
|
$24.07
-5.36%
|
10/25/2022
|
$22.75
|
PP = $24.17
|
|
MB = $25.38
|
Most Recent Note - 11/23/2022 5:44:25 PM
Y - Posted a quiet gain today. Volume totals are cooling while consolidating above its 50 DMA line ($21.54). More damaging losses would raise concerns and trigger a technical sell signal. Subsequent gains above the pivot point backed by at least +40% above average volume may trigger a technical buy signal. Fundamentals remain strong.
>>> FEATURED STOCK ARTICLE : Consolidating Above 50-Day Moving Average Still Perched Near High - 11/17/2022 |
View all notes |
Set NEW NOTE alert |
Company Profile |
SEC
News |
Chart |
Request a new note
C
A
S
I |
Symbol/Exchange
Company Name
Industry Group |
PRICE |
CHANGE
(%Change) |
Day High |
Volume
(% DAV)
(% 50 day avg vol) |
52 Wk Hi
% From Hi |
Featured
Date |
Price
Featured |
Pivot Featured |
|
Max Buy |
CBZ
-
NYSE
C B I Z Inc
Comml Svcs-Consulting
|
$49.82
|
+0.51
1.03% |
$50.32
|
111,374
40.21% of 50 DAV
50 DAV is 277,000
|
$50.57
-1.48%
|
10/26/2022
|
$47.83
|
PP = $48.57
|
|
MB = $51.00
|
Most Recent Note - 11/25/2022 2:49:22 PM
Y - Posted a small gain with light volume today as it inched further above its pivot point and challenged its 52-week high. Its 50 DMA line ($46.27) and recent low define important near-term support. Recently reported Sep '22 quarterly earnings +24% on +28% sales revenues versus the year ago period.
>>> FEATURED STOCK ARTICLE : Gapped Up and Rebounded Above Pivot Point - 11/18/2022 |
View all notes |
Set NEW NOTE alert |
Company Profile |
SEC
News |
Chart |
Request a new note
C
A
S
I |
ENPH
-
NASDAQ
Enphase Energy Inc
Energy-Solar
|
$319.42
|
+3.64
1.15% |
$323.44
|
1,536,045
37.99% of 50 DAV
50 DAV is 4,043,000
|
$324.84
-1.67%
|
10/26/2022
|
$301.55
|
PP = $324.94
|
|
MB = $341.19
|
Most Recent Note - 11/22/2022 6:22:53 PM
Y - Posted a big gain today with below average volume and closed at the session high, perched within close striking distance of its pivot point. Faces no resistance due to overhead supply. Its 50 DMA line ($283) defines near-term support above the recent low ($262.60 on 11/07/22). Fundamentals remain strong.
>>> FEATURED STOCK ARTICLE : Perched Near High Still Awaiting Technical Breakout - 11/21/2022 |
View all notes |
Set NEW NOTE alert |
Company Profile |
SEC
News |
Chart |
Request a new note
C
A
S
I |
HRMY
-
NASDAQ
Harmony Biosciences Holdings
Medical-Biomed/Biotech
|
$58.09
|
+0.59
1.03% |
$58.87
|
87,684
16.59% of 50 DAV
50 DAV is 528,400
|
$61.55
-5.62%
|
11/1/2022
|
$55.31
|
PP = $57.23
|
|
MB = $60.09
|
Most Recent Note - 11/25/2022 2:52:08 PM
Y - It has been wedging higher with gains lacking great volume conviction following a noted "positive reversal" on 11/17/22. That recent low ($53.06) defines initial support to watch above its 50 DMA line ($51).
>>> FEATURED STOCK ARTICLE : Volume Heavy Behind Technical Breakout After Earnings - 11/1/2022 |
View all notes |
Set NEW NOTE alert |
Company Profile |
SEC
News |
Chart |
Request a new note
C
A
S
I |
CLH
-
NYSE
Clean Harbors Inc
Pollution Control
|
$123.37
|
+0.75
0.61% |
$123.37
|
117,737
26.82% of 50 DAV
50 DAV is 439,000
|
$124.49
-0.90%
|
11/2/2022
|
$121.59
|
PP = $124.59
|
|
MB = $130.82
|
Most Recent Note - 11/22/2022 6:20:32 PM
Y - Posted a 6th consecutive gain today with lighter than average volume, approaching its prior highs and pivot point. Fundamentals remain strong after reporting Sep '22 quarterly earnings +113% on +43% sales revenues versus the year ago period.
>>> FEATURED STOCK ARTICLE : Testing 50 Day Moving Average Line After Forming New Base - 11/2/2022 |
View all notes |
Set NEW NOTE alert |
Company Profile |
SEC
News |
Chart |
Request a new note
C
A
S
I |
NPO
-
NYSE
Enpro Industries Inc
Machinery-Gen Industrial
|
$119.55
|
+1.00
0.84% |
$120.01
|
24,148
23.22% of 50 DAV
50 DAV is 104,000
|
$127.67
-6.36%
|
11/4/2022
|
$119.06
|
PP = $117.73
|
|
MB = $123.62
|
Most Recent Note - 11/25/2022 2:53:48 PM
Y - Volume totals have been cooling while stubbornly holding its ground above the pivot point cited. Fundamentals remain strong.
>>> FEATURED STOCK ARTICLE : Finished Strong After Highlighted in Friday Mid-Day Report - 11/4/2022 |
View all notes |
Set NEW NOTE alert |
Company Profile |
SEC
News |
Chart |
Request a new note
C
A
S
I |
Symbol/Exchange
Company Name
Industry Group |
PRICE |
CHANGE
(%Change) |
Day High |
Volume
(% DAV)
(% 50 day avg vol) |
52 Wk Hi
% From Hi |
Featured
Date |
Price
Featured |
Pivot Featured |
|
Max Buy |
DGII
-
NASDAQ
Digi International Inc
COMPUTER HARDWARE - Networking and Communication Dev
|
$42.39
|
+0.23
0.55% |
$42.91
|
98,152
23.77% of 50 DAV
50 DAV is 413,000
|
$43.68
-2.95%
|
11/10/2022
|
$41.82
|
PP = $40.96
|
|
MB = $43.01
|
Most Recent Note - 11/25/2022 2:57:40 PM
Y - Volume totals have been cooling while stubbornly holding its ground at its all-time high. Recently wedged above the pivot point cited based on its 10/31/22 high plus 10 cents after forming an advanced "ascending base" pattern. Subsequent gains above the pivot point backed by at least +40% above average volume are needed to confirm a proper technical buy signal. Fundamentals remain strong.
>>> FEATURED STOCK ARTICLE : Finish Below Pivot Point Leaves Disciplined Investors Waiting - 11/10/2022 |
View all notes |
Set NEW NOTE alert |
Company Profile |
SEC
News |
Chart |
Request a new note
C
A
S
I |
GFF
-
NYSE
Griffon Corporation
MATERIALS and CONSTRUCTION - General Building Materials
|
$36.59
|
+0.35
0.97% |
$36.75
|
163,086
44.20% of 50 DAV
50 DAV is 369,000
|
$36.68
-0.25%
|
11/10/2022
|
$34.13
|
PP = $35.02
|
|
MB = $36.77
|
Most Recent Note - 11/23/2022 12:28:42 PM
Y - Perched at its 52-weeek high with today's 2nd small gain backed by above average volume. Rallied above the pivot point with a big volume-driven gain on 11/18/22 backed by +220% above average volume triggering a technical buy signal. Last week it briefly undercut its 50 DMA line ($31.66) which defines important near-term support. Reported Sep '22 quarterly earnings +230% on +24% sales revenues versus the year ago period.
>>> FEATURED STOCK ARTICLE : Griffon Perched Near 52-Week High After 9-Week Base - 11/11/2022 |
View all notes |
Set NEW NOTE alert |
Company Profile |
SEC
News |
Chart |
Request a new note
C
A
S
I |
ANET
-
NYSE
Arista Networks Inc
Computer-Networking
|
$135.76
|
-1.43
-1.04% |
$137.35
|
644,575
26.04% of 50 DAV
50 DAV is 2,475,000
|
$148.57
-8.62%
|
11/14/2022
|
$132.05
|
PP = $133.70
|
|
MB = $140.39
|
Most Recent Note - 11/25/2022 2:47:36 PM
Y - Held its ground stubbornly as it wedged higher after a cup-with-handle base. Subsequent gains and a close above the pivot point backed by at least +40% above average volume are needed to trigger a proper technical buy signal. Faces some resistance due to overhead supply up to the $148 level. Fundamentals are strong.
>>> FEATURED STOCK ARTICLE : Finished in Middle of Intra-Day Range After Challenging Pivot Point - 11/14/2022 |
View all notes |
Set NEW NOTE alert |
Company Profile |
SEC
News |
Chart |
Request a new note
C
A
S
I |
CPRX
-
NASDAQ
Catalyst Pharma Inc
Medical-Biomed/Biotech
|
$16.97
|
-0.06
-0.35% |
$17.11
|
1,007,786
39.00% of 50 DAV
50 DAV is 2,584,000
|
$17.76
-4.45%
|
11/22/2022
|
$17.38
|
PP = $16.66
|
|
MB = $17.49
|
Most Recent Note - 11/23/2022 12:18:59 PM
Y - Pulling back today. Finished strong on the prior session after highlighted in yellow with new pivot point cited based on its 11/11/22 high in the mid-day report. Rallied from a 9-week cup-with-handle base for a new 52-week high with a big gain backed by +90% above average volume. Reported Sep '22 quarterly earnings +86% on +59% sales revenues versus the year ago period. Showed resilience since dropped from the Featured Stocks list on 9/23/22.
>>> FEATURED STOCK ARTICLE : Breakout From Cup-With-Handle With 90% Above Average Volume - 11/22/2022 |
View all notes |
Set NEW NOTE alert |
Company Profile |
SEC
News |
Chart |
Request a new note
C
A
S
I |
CLFD
-
NASDAQ
Clearfield Inc
TELECOMMUNICATIONS - Cables / Satalite Equipment
|
$130.82
|
+1.32
1.02% |
$134.90
|
178,313
62.79% of 50 DAV
50 DAV is 284,000
|
$132.97
-1.62%
|
11/23/2022
|
$131.27
|
PP = $130.11
|
|
MB = $136.62
|
Most Recent Note - 11/25/2022 11:44:31 AM
Y - Inching to another new high with today's 6th consecutive gain. Color code was changed to yellow with pivot point cited based on its 8/25/22 high plus 10 cents. A gain and close above the pivot point backed by at least +40% above average volume may trigger a new technical buy signal. Gapped up on 11/18/22 for a considerable gain, rebounding from below its 50 DMA line ($103). It found support above its 200 DMA line and showed resilience after dropped from the Featured Stocks list on 11/08/22. Reported Sep '22 quarterly earnings +130% on +110% sales revenues versus the year ago period.
>>> FEATURED STOCK ARTICLE : Hit New High But Encountered Distributional Pressure - 11/23/2022 |
View all notes |
Set NEW NOTE alert |
Company Profile |
SEC
News |
Chart |
Request a new note
C
A
S
I |
Symbol/Exchange
Company Name
Industry Group |
PRICE |
CHANGE
(%Change) |
Day High |
Volume
(% DAV)
(% 50 day avg vol) |
52 Wk Hi
% From Hi |
Featured
Date |
Price
Featured |
Pivot Featured |
|
Max Buy |
|
|
|
THESE ARE NOT BUY RECOMMENDATIONS!
Comments contained in the body of this report are technical
opinions only. The material herein has been obtained
from sources believed to be reliable and accurate, however,
its accuracy and completeness cannot be guaranteed.
This site is not an investment advisor, hence it does
not endorse or recommend any securities or other investments.
Any recommendation contained in this report may not
be suitable for all investors and it is not to be deemed
an offer or solicitation on our part with respect to
the purchase or sale of any securities. All trademarks,
service marks and trade names appearing in this report
are the property of their respective owners, and are
likewise used for identification purposes only.
This report is a service available
only to active Paid Premium Members.
You may opt-out of receiving report notifications
at any time. Questions or comments may be submitted
by writing to Premium Membership Services 665 S.E. 10 Street, Suite 201 Deerfield Beach, FL 33441-5634 or by calling 1-800-965-8307
or 954-785-1121.
|
|
|