You are not logged in.
This means you
CAN ONLY VIEW reports that were published prior to Saturday, April 5, 2025.
You
MUST UPGRADE YOUR MEMBERSHIP if you want to see any current reports.
AFTER MARKET UPDATE - FRIDAY, DECEMBER 9TH, 2022
Previous After Market Report Next After Market Report >>>
|
|
|
|
DOW |
-305.02 |
33,476.46 |
-0.90% |
|
Volume |
865,542,613 |
+3% |
|
Volume |
4,295,302,800 |
+2% |
|
NASDAQ |
-77.39 |
11,004.62 |
-0.70% |
|
Advancers |
852 |
28% |
|
Advancers |
1,649 |
36% |
|
S&P 500 |
-29.13 |
3,934.38 |
-0.73% |
|
Decliners |
2,168 |
72% |
|
Decliners |
2,872 |
64% |
|
Russell 2000 |
-21.63 |
1,796.66 |
-1.19% |
|
52 Wk Highs |
43 |
|
|
52 Wk Highs |
68 |
|
|
S&P 600 |
-12.81 |
1,186.60 |
-1.07% |
|
52 Wk Lows |
63 |
|
|
52 Wk Lows |
248 |
|
|
 |
Major Indices Fell With Higher Volume Totals
Kenneth J. Gruneisen - Passed the CAN SLIM® Master's Exam
The Dow lost 305 points, while the Nasdaq Composite fell 0.7% and the S&P 500 declined 0.7%. Volume totals were higher than the prior session on the NYSE and on the Nasdaq exchange. Breadth was negative as decliners led advancers by more than a 2-1 margin on the NYSE and nearly 2-1 on the Nasdaq exchange. There were 11 high-ranked companies from the Leaders List that hit new 52-week highs and were listed on the BreakOuts Page, versus the total of 15 on the prior session. New 52-week lows totals outnumbered new 52-week highs on the NYSE and on the Nasdaq exchange. The market uptrend (M criteria) encountered some recent pressure. Healthy leadership (new 52-week highs totals) must continue for the rally be productive, but new highs totals have recently contracted. Only stocks meeting all key-criteria of the fact-based investment system should be considered as buy candidates.
Chart courtesy of www.stockcharts.com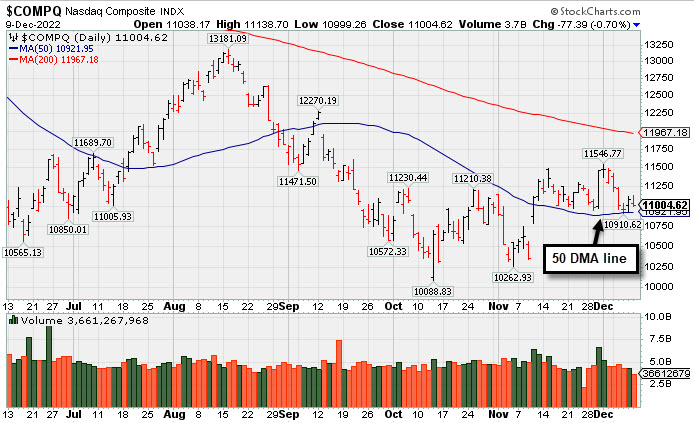 PICTURED: The Nasdaq Composite Index is consolidating above its 50-day moving average (DMA) line. It must be trading above the long-term 200 DMA average to be considered to be in "healthy" shape.
U.S. equities tumble Friday after November’s Producer Price Index (PPI) came in hotter-than-expected, showing inflation has not yet eased. Investors are looking towards Tuesday’s Consumer Price Index (CPI) data for support on a possible pivot from the Federal Reserve (Fed). All indexes notched its worst week since September. Ten of 11 sectors in the S&P 500 finished in negative territory, with Energy being the sole gainer for the week at 48.9%.
On the data front, November’s wholesale PPI topped analyst expectations with an increase of 0.3% month-over-month and 7.4% annually. According to the Bureau of Labor Statistics, financial services was one of leading sectors within November’s PPI reading, jumping 11.3%. Meanwhile, the University of Michigan’s Consumer Sentiment survey showed consumers are becoming more optimistic about the economy notching a 3.1 increase to 59.1 in December. However, sentiment is still down 16.3% from last December’s 70.6 print.
Treasuries finished lower with the yield on the benchmark 10-year note up nine basis points (0.09%) to 3.58%, while the yield on the 30-year bond gained 13 basis points (0.13%) to 3.57%. The yield on the two-year note, which is more sensitive to changes in Fed policy, increased two basis points (0.02%) to 4.34%. In commodities, West Texas Intermediate (WTI) crude remained little changed at $71.47/barrel, hitting its lowest weekly decline since August, down 10.7%. This week’s decline follows the European Union’s and the Group of Seven’s (G7) new sanctions on Russian crude oil as investors ever growing recessionary concerns continue to mount.
|
 Kenneth J. Gruneisen started out as a licensed stockbroker in August 1987, a couple of months prior to the historic stock market crash that took the Dow Jones Industrial Average down -22.6% in a single day. He has published daily fact-based fundamental and technical analysis on high-ranked stocks online for two decades. Through FACTBASEDINVESTING.COM, Kenneth provides educational articles, news, market commentary, and other information regarding proven investment systems that work in good times and bad.
Comments contained in the body of this report are technical opinions only and are not necessarily those of Gruneisen Growth Corp. The material herein has been obtained from sources believed to be reliable and accurate, however, its accuracy and completeness cannot be guaranteed. Our firm, employees, and customers may effect transactions, including transactions contrary to any recommendation herein, or have positions in the securities mentioned herein or options with respect thereto. Any recommendation contained in this report may not be suitable for all investors and it is not to be deemed an offer or solicitation on our part with respect to the purchase or sale of any securities. |
|
 |
Commodity-Linked Groups Led Tech and Retail Indexes Lower
Kenneth J. Gruneisen - Passed the CAN SLIM® Master's Exam
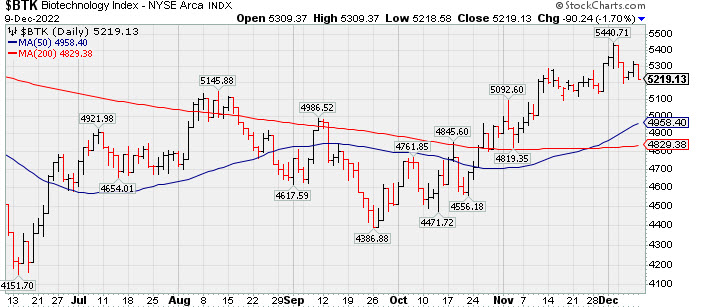
The Bank Index ($BKX +0.05%) held its ground while the Broker/Dealer Index ($XBD -0.52%) edged lower. The Retail Index ($RLX -1.29%) created a drag on the major indices and the tech sector had a negative bias as the Biotech Index ($BTK -1.70%), Networking Index ($NWX -1.51%), and Semiconductor Index ($SOX -0.86%) each lost ground. Commodity-linked groups suffer the largest losses as the Oil Services Index ($OSX -3.83%), Integrated Oil Index ($XOI -2.19%), and Gold & Silver Index ($XAU -1.54%) ended unanimously lower.
PICTURED: The Biotech Index ($BTK -1.70%) is in healthy shape and consolidating above its 50-day and 200-day moving average (DMA) lines.
| Oil Services |
$OSX |
75.07 |
-2.99 |
-3.83% |
+42.39% |
| Integrated Oil |
$XOI |
1,678.46 |
-37.55 |
-2.19% |
+42.46% |
| Semiconductor |
$SOX |
2,721.02 |
-23.72 |
-0.86% |
-31.05% |
| Networking |
$NWX |
811.64 |
-12.45 |
-1.51% |
-16.42% |
| Broker/Dealer |
$XBD |
465.73 |
-2.42 |
-0.52% |
-4.34% |
| Retail |
$RLX |
2,838.22 |
-37.13 |
-1.29% |
-32.85% |
| Gold & Silver |
$XAU |
119.90 |
-1.87 |
-1.54% |
-9.48% |
| Bank |
$BKX |
100.52 |
+0.05 |
+0.05% |
-23.98% |
| Biotech |
$BTK |
5,219.13 |
-90.24 |
-1.70% |
-5.42% |
|
|
|
 |
Sputtered Back Below Prior High Hurting Outlook
Kenneth J. Gruneisen - Passed the CAN SLIM® Master's Exam
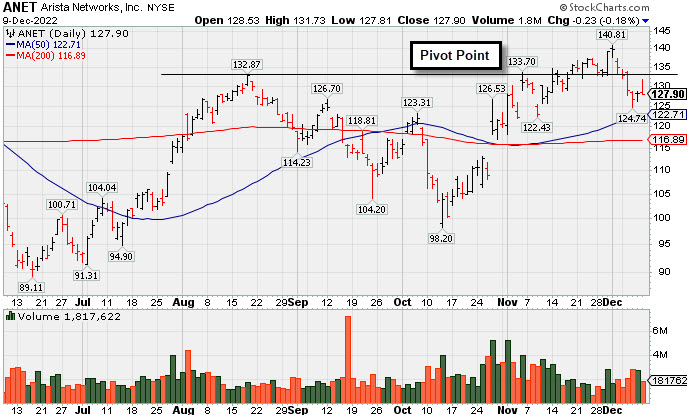
Arista Networks Inc (ANET -$0.23 or -0.18% to $127.90) has posted 2 small gains after 4 consecutive losses. Its 50-day moving average (DMA) line ($122.73) defines near-term support to watch. Fundamentals remain strong, but technically it has struggled since highlighted in yellow in the 11/14/22 mid-day report (read here) with pivot point cited based on its 11/04/22 high after a cup-with-handle base. Disciplined investors may note that it failed to produce a gain and close above the pivot point backed by at least +40% above average volume to trigger a proper technical buy signal. It has instead sputtered back below its August high. It still faces some resistance due to overhead supply up to the $148 level.
ANET currently has a 97 Earnings Per Share Rating. It reported Sep '22 quarterly earnings +69% on +57% sales revenues versus the year ago period, its 4th quarterly comparison strong and steady above the +25% minimum earnings guideline (C criteria). Annual earnings had a downturn in FY 20 like many during the pandemic. It was last shown in this FSU section on 11/14/22 with an annotated graph under the headline, "Finished in Middle of Intra-Day Range After Challenging Pivot Point".
The number of top-rated funds owning its shares rose from 1,758 in Dec '21 to 1,976 in Sep '22, a reassuring sign concerning the I criteria. Its current Up/Down Volume Ratio of 1.3 is an unbiased indication its shares have been under accumulation over the past 50 days. The high-ranked Computer - Networking firm has a Timeliness Rating of A and a Sponsorship Rating of C. Its small supply of 244.5 million shares (S criteria) in the public float may contribute to greater volatility in the event of institutional buying or selling.
|
|
|
Color Codes Explained :
Y - Better candidates highlighted by our
staff of experts.
G - Previously featured
in past reports as yellow but may no longer be buyable under the
guidelines.
***Last / Change / Volume data in this table is the closing quote data***
Symbol/Exchange
Company Name
Industry Group |
PRICE |
CHANGE
(%Change) |
Day High |
Volume
(% DAV)
(% 50 day avg vol) |
52 Wk Hi
% From Hi |
Featured
Date |
Price
Featured |
Pivot Featured |
|
Max Buy |
 ESQ
-
NASDAQ
ESQ
-
NASDAQ
Esquire Financial Hldgs
Finance-Commercial Loans
|
$42.25
|
-1.13
-2.60% |
$43.08
|
11,060
39.50% of 50 DAV
50 DAV is 28,000
|
$48.13
-12.22%
|
10/18/2022
|
$40.02
|
PP = $39.95
|
|
MB = $41.95
|
Most Recent Note - 12/7/2022 3:23:46 PM
G - Pulling back today with below average volume for a 9th loss in the span of 10 sessions. Prior highs and its 50 DMA line ($42.10) coincide in the $41 area defining important near-term support to watch.
>>> FEATURED STOCK ARTICLE : Pulled Back Following "Negative Reversal" at All-Time High - 11/25/2022 |
View all notes |
Set NEW NOTE alert |
Company Profile |
SEC
News |
Chart |
Request a new note
C
A
S
I |
CCRN
-
NASDAQ
Cross Country Healthcare
DIVERSIFIED SERVICES - Staffing and Outsourcing Service
|
$30.34
|
-1.41
-4.44% |
$31.73
|
725,959
88.97% of 50 DAV
50 DAV is 816,000
|
$40.12
-24.38%
|
9/9/2022
|
$27.32
|
PP = $30.61
|
|
MB = $32.14
|
 Most Recent Note - 12/9/2022 3:14:33 PM
G - Suffering a 5th consecutive loss today, slumping further below its 50 DMA line ($34) as damaging losses triggered a technical sell signal. The prior low ($29.97 on 11/11/22) defines the next important support to watch. Fundamentals remain strong.
>>> FEATURED STOCK ARTICLE : Big Loss Testing Support at 50-Day Moving Average - 12/5/2022 |
View all notes |
Set NEW NOTE alert |
Company Profile |
SEC
News |
Chart |
Request a new note
C
A
S
I |
CMC
-
NYSE
Commercial Metals Co
METALS and MINING - Steel and Iron
|
$47.97
|
-1.82
-3.66% |
$49.80
|
849,415
85.11% of 50 DAV
50 DAV is 998,000
|
$50.83
-5.63%
|
10/14/2022
|
$41.61
|
PP = $44.45
|
|
MB = $46.67
|
Most Recent Note - 12/9/2022 3:11:15 PM
G - Pulling back further today following a "negative reversal" on 12/07/22 after hitting yet a new high, now on track to break a streak of 9 consecutive weekly gains. Fundamentals remain strong. Prior highs define initial support to watch above its 50 DMA line ($44.90).
>>> FEATURED STOCK ARTICLE : Wedging Higher With Recent Gains Lacking Great Volume - 12/2/2022 |
View all notes |
Set NEW NOTE alert |
Company Profile |
SEC
News |
Chart |
Request a new note
C
A
S
I |
VRTX
-
NASDAQ
Vertex Pharmaceuticals
Medical-Biomed/Biotech
|
$312.22
|
-9.10
-2.83% |
$321.15
|
942,069
63.06% of 50 DAV
50 DAV is 1,494,000
|
$324.75
-3.86%
|
10/24/2022
|
$308.47
|
PP = $306.05
|
|
MB = $321.35
|
Most Recent Note - 12/9/2022 3:16:43 PM
Y - Pulling back today with light volume after wedging to new highs with light volume. Its 50 DMA line ($306.72) defines near-term support to watch. Recently reported Sep '22 quarterly earnings +14% on +18% sales revenues versus the year ago period, below the +25% minimum earnings guideline raising fundamental concerns (C criteria). Annual earnings (A criteria) history has been strong.
>>> FEATURED STOCK ARTICLE : Made Little Progress Following Breakout and Latest Earnings News - 11/16/2022 |
View all notes |
Set NEW NOTE alert |
Company Profile |
SEC
News |
Chart |
Request a new note
C
A
S
I |
GPK
-
NYSE
Graphic Packaging Hldg
CONSUMER NON-DURABLES - Packaging and Containers
|
$22.10
|
-0.12
-0.54% |
$22.38
|
3,169,738
109.22% of 50 DAV
50 DAV is 2,902,100
|
$24.07
-8.18%
|
10/25/2022
|
$22.75
|
PP = $24.17
|
|
MB = $25.38
|
Most Recent Note - 12/9/2022 4:39:00 PM
Y - Pulled back today for a 3rd consecutive loss, consolidating above its 50 DMA line ($21.95). More damaging losses would raise concerns and trigger a technical sell signal. Subsequent gains above the pivot point backed by at least +40% above average volume may trigger a technical buy signal. Fundamentals remain strong.
>>> FEATURED STOCK ARTICLE : Consolidating Above 50-Day Moving Average Still Perched Near High - 11/17/2022 |
View all notes |
Set NEW NOTE alert |
Company Profile |
SEC
News |
Chart |
Request a new note
C
A
S
I |
Symbol/Exchange
Company Name
Industry Group |
PRICE |
CHANGE
(%Change) |
Day High |
Volume
(% DAV)
(% 50 day avg vol) |
52 Wk Hi
% From Hi |
Featured
Date |
Price
Featured |
Pivot Featured |
|
Max Buy |
CBZ
-
NYSE
C B I Z Inc
Comml Svcs-Consulting
|
$49.60
|
+0.24
0.49% |
$49.88
|
208,685
80.57% of 50 DAV
50 DAV is 259,000
|
$50.57
-1.92%
|
10/26/2022
|
$47.83
|
PP = $48.57
|
|
MB = $51.00
|
Most Recent Note - 12/7/2022 3:19:32 PM
Y - Pulling back for a 3rd consecutive small loss with below average volume, hovering near its 52-week high. Its 50 DMA line ($47.07) and recent low define important near-term support. Recently reported Sep '22 quarterly earnings +24% on +28% sales revenues versus the year ago period.
>>> FEATURED STOCK ARTICLE : Gapped Up and Rebounded Above Pivot Point - 11/18/2022 |
View all notes |
Set NEW NOTE alert |
Company Profile |
SEC
News |
Chart |
Request a new note
C
A
S
I |
ENPH
-
NASDAQ
Enphase Energy Inc
Energy-Solar
|
$319.55
|
-0.32
-0.10% |
$326.48
|
2,365,600
59.23% of 50 DAV
50 DAV is 3,994,000
|
$339.92
-5.99%
|
10/26/2022
|
$301.55
|
PP = $324.94
|
|
MB = $341.19
|
Most Recent Note - 12/7/2022 12:03:40 PM
Y - Holding its ground today after a slump back below its pivot point with a volume-driven loss on the prior session raised concerns. Stalled after hitting a new all-time high on 12/02/22 with a volume-driven gain above its pivot point. Faces no resistance due to overhead supply. Its 50 DMA line ($287) defines near-term support above the recent low ($262.60 on 11/07/22). Fundamentals remain strong.
>>> FEATURED STOCK ARTICLE : Perched Near High Still Awaiting Technical Breakout - 11/21/2022 |
View all notes |
Set NEW NOTE alert |
Company Profile |
SEC
News |
Chart |
Request a new note
C
A
S
I |
HRMY
-
NASDAQ
Harmony Biosciences Holdings
Medical-Biomed/Biotech
|
$59.03
|
-0.81
-1.35% |
$60.13
|
221,863
46.03% of 50 DAV
50 DAV is 482,000
|
$62.09
-4.93%
|
11/1/2022
|
$55.31
|
PP = $57.23
|
|
MB = $60.09
|
Most Recent Note - 12/9/2022 3:20:18 PM
Y - Color code is changed to yellow while pulling back below its "max buy" level with small losses marked by below average volume. The 11/17/22 low ($53.06) defines important support to watch coinciding with its 50 DMA line ($54.33).
>>> FEATURED STOCK ARTICLE : Harmony Still Hovering Near All-Time High - 11/28/2022 |
View all notes |
Set NEW NOTE alert |
Company Profile |
SEC
News |
Chart |
Request a new note
C
A
S
I |
CLH
-
NYSE
Clean Harbors Inc
Pollution Control
|
$116.16
|
-2.33
-1.97% |
$119.10
|
225,744
53.62% of 50 DAV
50 DAV is 421,000
|
$125.41
-7.38%
|
11/2/2022
|
$121.59
|
PP = $124.59
|
|
MB = $130.82
|
Most Recent Note - 12/9/2022 3:18:34 PM
Y - On track today for its 4th loss with below average volume in the span of 5 sessions. Sputtering near its 50 DMA line ($117) and recent low ($114.86 on 11/29/22) which define important near-term support to watch. Fundamentals remain strong.
>>> FEATURED STOCK ARTICLE : Volume-Driven Losses Undercut 50-Day Moving Average - 11/29/2022 |
View all notes |
Set NEW NOTE alert |
Company Profile |
SEC
News |
Chart |
Request a new note
C
A
S
I |
NPO
-
NYSE
Enpro Industries Inc
Machinery-Gen Industrial
|
$109.79
|
-2.30
-2.05% |
$112.46
|
65,752
65.75% of 50 DAV
50 DAV is 100,000
|
$127.67
-14.00%
|
11/4/2022
|
$119.06
|
PP = $117.73
|
|
MB = $123.62
|
Most Recent Note - 12/9/2022 3:25:12 PM
Y - Pulling back today for a 5th consecutive loss with below average volume. It has slumped back below its pivot point raising concerns. The 50 DMA line ($107.31) defines important near term support to watch. Fundamentals remain strong.
>>> FEATURED STOCK ARTICLE : Consolidating Near Old Highs Following Recent Breakout - 12/1/2022 |
View all notes |
Set NEW NOTE alert |
Company Profile |
SEC
News |
Chart |
Request a new note
C
A
S
I |
Symbol/Exchange
Company Name
Industry Group |
PRICE |
CHANGE
(%Change) |
Day High |
Volume
(% DAV)
(% 50 day avg vol) |
52 Wk Hi
% From Hi |
Featured
Date |
Price
Featured |
Pivot Featured |
|
Max Buy |
DGII
-
NASDAQ
Digi International Inc
COMPUTER HARDWARE - Networking and Communication Dev
|
$39.40
|
-0.72
-1.79% |
$40.75
|
311,893
77.59% of 50 DAV
50 DAV is 402,000
|
$43.68
-9.80%
|
11/10/2022
|
$41.82
|
PP = $40.96
|
|
MB = $43.01
|
Most Recent Note - 12/8/2022 5:32:52 PM
Y - Posted a gain today with lighter volume halting a streak of 5 consecutive losses. Raised concerns as it sank below the pivot point cited based on its 10/31/22 high plus 10 cents after forming an advanced "ascending base" pattern. Its 50 DMA line ($38.48) defines important near-term support to watch. Fundamentals remain strong.
>>> FEATURED STOCK ARTICLE : Sputtering After Recently Wedging to New Highs - 12/6/2022 |
View all notes |
Set NEW NOTE alert |
Company Profile |
SEC
News |
Chart |
Request a new note
C
A
S
I |
GFF
-
NYSE
Griffon Corporation
MATERIALS and CONSTRUCTION - General Building Materials
|
$34.89
|
-0.10
-0.29% |
$35.47
|
463,528
126.99% of 50 DAV
50 DAV is 365,000
|
$36.75
-5.06%
|
11/10/2022
|
$34.13
|
PP = $35.02
|
|
MB = $36.77
|
Most Recent Note - 12/7/2022 5:28:36 PM
Y - Perched near its 52-week high, consolidating near prior highs in the $34 area which define initial support to watch above its 50 DMA line ($32.51). Reported Sep '22 quarterly earnings +230% on +24% sales revenues versus the year ago period. See the latest FSU analysis for more details and a new annotated graph.
>>> FEATURED STOCK ARTICLE : No Meaningful Progress After Breakout 3 Weeks Ago - 12/7/2022 |
View all notes |
Set NEW NOTE alert |
Company Profile |
SEC
News |
Chart |
Request a new note
C
A
S
I |
ANET
-
NYSE
Arista Networks Inc
Computer-Networking
|
$127.90
|
-0.23
-0.18% |
$131.73
|
1,817,630
76.56% of 50 DAV
50 DAV is 2,374,000
|
$148.57
-13.91%
|
11/14/2022
|
$132.05
|
PP = $133.70
|
|
MB = $140.39
|
Most Recent Note - 12/9/2022 4:37:02 PM
Y - Posted 2 small gains after 4 consecutive losses. Its 50-day moving average (DMA) line ($122.73) defines near-term support to watch. Subsequent gains and a close above the pivot point must be backed by at least +40% above average volume to trigger a proper technical buy signal. Faces some resistance due to overhead supply up to the $148 level. Fundamentals are strong. See the latest FSU analysis for more details and a new annotated graph.
>>> FEATURED STOCK ARTICLE : Sputtered Back Below Prior High Hurting Outlook - 12/9/2022 |
View all notes |
Set NEW NOTE alert |
Company Profile |
SEC
News |
Chart |
Request a new note
C
A
S
I |
CPRX
-
NASDAQ
Catalyst Pharma Inc
Medical-Biomed/Biotech
|
$16.38
|
-0.42
-2.50% |
$16.82
|
1,118,425
49.14% of 50 DAV
50 DAV is 2,276,000
|
$18.39
-10.93%
|
11/22/2022
|
$17.38
|
PP = $16.66
|
|
MB = $17.49
|
Most Recent Note - 12/9/2022 3:26:49 PM
Y - Volume totals have been cooling while consolidating, however, its slump below its pivot point raised some concerns. Still consolidating well above its 50 DMA line ($14.61).
>>> FEATURED STOCK ARTICLE : Breakout From Cup-With-Handle With 90% Above Average Volume - 11/22/2022 |
View all notes |
Set NEW NOTE alert |
Company Profile |
SEC
News |
Chart |
Request a new note
C
A
S
I |
TITN
-
NASDAQ
Titan Machinery Inc
SPECIALTY RETAIL
|
$39.91
|
-0.64
-1.58% |
$40.97
|
180,993
96.79% of 50 DAV
50 DAV is 187,000
|
$44.35
-10.01%
|
11/30/2022
|
$40.10
|
PP = $38.68
|
|
MB = $40.61
|
Most Recent Note - 12/7/2022 12:13:47 PM
Y - Prior high in the $38 area defines initial support to watch. Pulling back below its "max buy" level and its color code was changed to yellow. On track for a 5th consecutive loss with above average volume after a technical breakout noted on 11/30/22. Fundamentals remain strong after reporting Oct '22 quarterly earnings +91% on +47% sales revenues.
>>> FEATURED STOCK ARTICLE : Gap Up and Big Volume-Driven Breakout Gain - 11/30/2022 |
View all notes |
Set NEW NOTE alert |
Company Profile |
SEC
News |
Chart |
Request a new note
C
A
S
I |
Symbol/Exchange
Company Name
Industry Group |
PRICE |
CHANGE
(%Change) |
Day High |
Volume
(% DAV)
(% 50 day avg vol) |
52 Wk Hi
% From Hi |
Featured
Date |
Price
Featured |
Pivot Featured |
|
Max Buy |
MYE
-
NYSE
Myers Industries Inc
Containers/Packaging
|
$23.20
|
-0.43
-1.82% |
$24.05
|
125,246
106.14% of 50 DAV
50 DAV is 118,000
|
$25.55
-9.20%
|
12/8/2022
|
$23.94
|
PP = $25.65
|
|
MB = $26.93
|
Most Recent Note - 12/9/2022 3:23:00 PM
Y - Pulling back today with below average volume. Highlighted in yellow with pivot point cited based on its 6/06/22 high plus 10 cents in the 12/08/22 mid-day report. It is -8.6% off its 52-week high and still on track for a 9th consecutive weekly gain. Subsequent gains above the pivot point backed by at least +40% above average volume may trigger a technical buy signal. The Sep '22 quarter showed +78% earnings on +14% sales revenues versus the year ago period. The past 4 quarterly comparisons were above the +25% minimum guideline (C criteria), however, its sales revenues growth rate has shown deceleration in sequential comparisons +45%, +29%, +24%, to +14%. Annual earnings (A criteria) history had a slight downturn in FY '19 but growth has been otherwise strong and steady. See the latest FSU analysis for more details and an annotated graph.
>>> FEATURED STOCK ARTICLE : Myers Industries on Track for 9th Straight Weekly Gain - 12/8/2022 |
View all notes |
Set NEW NOTE alert |
Company Profile |
SEC
News |
Chart |
Request a new note
C
A
S
I |
|
|
|
THESE ARE NOT BUY RECOMMENDATIONS!
Comments contained in the body of this report are technical
opinions only. The material herein has been obtained
from sources believed to be reliable and accurate, however,
its accuracy and completeness cannot be guaranteed.
This site is not an investment advisor, hence it does
not endorse or recommend any securities or other investments.
Any recommendation contained in this report may not
be suitable for all investors and it is not to be deemed
an offer or solicitation on our part with respect to
the purchase or sale of any securities. All trademarks,
service marks and trade names appearing in this report
are the property of their respective owners, and are
likewise used for identification purposes only.
This report is a service available
only to active Paid Premium Members.
You may opt-out of receiving report notifications
at any time. Questions or comments may be submitted
by writing to Premium Membership Services 665 S.E. 10 Street, Suite 201 Deerfield Beach, FL 33441-5634 or by calling 1-800-965-8307
or 954-785-1121.
|
|
|