You are not logged in.
This means you
CAN ONLY VIEW reports that were published prior to Tuesday, March 25, 2025.
You
MUST UPGRADE YOUR MEMBERSHIP if you want to see any current reports.
AFTER MARKET UPDATE - WEDNESDAY, NOVEMBER 30TH, 2022
Previous After Market Report Next After Market Report >>>
|
|
|
|
DOW |
+737.24 |
34,589.77 |
+2.18% |
|
Volume |
1,994,704,396 |
+152% |
|
Volume |
6,481,142,300 |
+43% |
|
NASDAQ |
+484.22 |
11,468.00 |
+4.41% |
|
Advancers |
2,592 |
86% |
|
Advancers |
3,564 |
76% |
|
S&P 500 |
+122.48 |
4,080.11 |
+3.09% |
|
Decliners |
421 |
14% |
|
Decliners |
1,132 |
24% |
|
Russell 2000 |
+50.03 |
1,886.58 |
+2.72% |
|
52 Wk Highs |
82 |
|
|
52 Wk Highs |
133 |
|
|
S&P 600 |
+29.52 |
1,243.16 |
+2.43% |
|
52 Wk Lows |
66 |
|
|
52 Wk Lows |
218 |
|
|
 |
Breadth Positive as Major Indices Rallied With Heavier Volume
Kenneth J. Gruneisen - Passed the CAN SLIM® Master's Exam
The Dow jumped 737 points, while the Nasdaq Composite climbed 4.4%. The S&P 500 advanced 3.1%. Volume totals were higher than the prior session on the NYSE and on the Nasdaq exchange, indicative of an increase in institutional buying demand. Breadth was clearly positive as advancers led decliners by a 6-1 margin on the NYSE and 3-1 on the Nasdaq exchange. There were 40 high-ranked companies from the Leaders List that hit new 52-week highs and were listed on the BreakOuts Page, versus the total of 10 on the prior session. New 52-week highs outnumbered new 52-week lows on the NYSE but new highs still outnumbered new highs on the Nasdaq exchange. The market is in a confirmed uptrend (M criteria). Healthy leadership (new 52-week highs totals) has continued helping the rally be productive. Only stocks meeting all key-criteria of the fact-based investment system should be considered as buy candidates.
Chart courtesy of www.stockcharts.com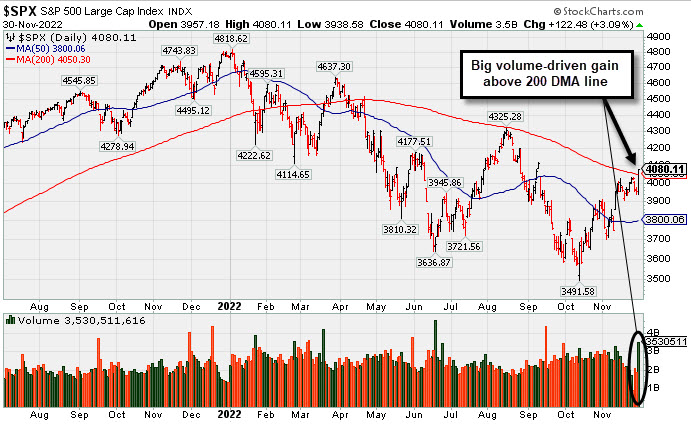 PICTURED: The S&P 500 Index posted a big gain and rallied to close above its 200 DMA line for the first time since April 7th.
U.S. equities finished higher Wednesday as investors digested comments from Federal Reserve (Fed) Chairman Jerome Powell. The Fed Chief reiterated the need to continue to curb inflation, but indicated the central bank may downshift to a slower pace of rate hikes as soon as their next meeting. Powell also echoed some of his remarks from his press conference after the November meeting, saying the rate peak may be “somewhat higher” than forecasted in September.
On the data front, the ADP Employment Change report showed payrolls increased less than forecasted in November, while the Job Openings and Labor Turnover Survey (JOLTS) showed job openings fell to 10.3 million in October. The easing figure suggests demand for labor is beginning to moderate. Meanwhile, a second reading of third-quarter Gross Domestic Product (GDP) was revised upwards to 2.9%, while wholesale inventories unexpectedly climbed 0.8% month-over-month. Retail inventories fell 0.2% month-over-month in October versus estimates of a 0.5% monthly gain. Finally, pending home sales fell 4.6% in October, while the MNI Chicago Purchasing Managers’ Index (PMI) fell sharply to 37.2 in November, signaling further contraction.
Treasuries rallied, with the yield on the 10-year note down 12 basis points (0.12%) to 3.64%, while the 30-year bond yield shed four basis points (0.04%) to 3.77%. The two-year note yield slipped 15 basis points (0.15%) to 4.33%. In commodities, West Texas Intermediate (WTI) crude climbed 3% to $80.58/barrel amid tight supply conditions.
|
 Kenneth J. Gruneisen started out as a licensed stockbroker in August 1987, a couple of months prior to the historic stock market crash that took the Dow Jones Industrial Average down -22.6% in a single day. He has published daily fact-based fundamental and technical analysis on high-ranked stocks online for two decades. Through FACTBASEDINVESTING.COM, Kenneth provides educational articles, news, market commentary, and other information regarding proven investment systems that work in good times and bad.
Comments contained in the body of this report are technical opinions only and are not necessarily those of Gruneisen Growth Corp. The material herein has been obtained from sources believed to be reliable and accurate, however, its accuracy and completeness cannot be guaranteed. Our firm, employees, and customers may effect transactions, including transactions contrary to any recommendation herein, or have positions in the securities mentioned herein or options with respect thereto. Any recommendation contained in this report may not be suitable for all investors and it is not to be deemed an offer or solicitation on our part with respect to the purchase or sale of any securities. |
|
 |
Tech, Retail, Financial, and Commodity-Linked Groups Rose
Kenneth J. Gruneisen - Passed the CAN SLIM® Master's Exam
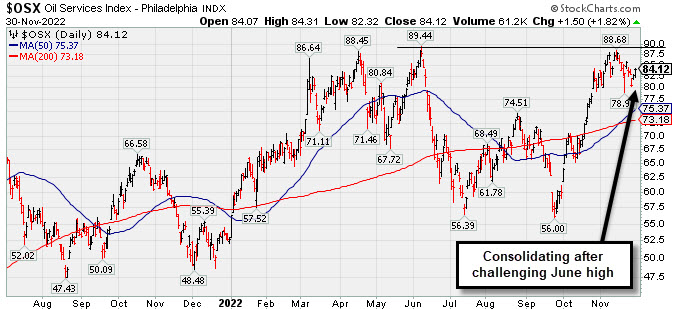
The tech sector had a positive bias as the Semiconductor Index ($SOX +5.85%) posted a standout gain while the Networking Index ($NWX +3.74%) and Biotech Index ($BTK +3.31%) also finished with solid gains. The Retail Index ($RLX +3.09%) posted an influential gain and the Broker/Dealer Index ($XBD +2.04%) and Bank Index ($BKX +2.00%) also underpinned the major averages' advance. The Gold & Silver Index ($XAU +3.55%) posted a large gain while the Oil Services Index ($OSX +1.82%) also rose and the Integrated Oil Index ($XOI +0.43%) edged higher.
PICTURED: The Oil Services Index ($OSX +1.82%) is consolidating after challenging its June high.
| Oil Services |
$OSX |
84.12 |
+1.50 |
+1.82% |
+59.57% |
| Integrated Oil |
$XOI |
1,875.78 |
+8.05 |
+0.43% |
+59.21% |
| Semiconductor |
$SOX |
2,826.85 |
+156.20 |
+5.85% |
-28.36% |
| Networking |
$NWX |
837.06 |
+30.15 |
+3.74% |
-13.80% |
| Broker/Dealer |
$XBD |
482.75 |
+9.66 |
+2.04% |
-0.84% |
| Retail |
$RLX |
2,994.16 |
+89.74 |
+3.09% |
-29.16% |
| Gold & Silver |
$XAU |
120.73 |
+4.14 |
+3.55% |
-8.85% |
| Bank |
$BKX |
108.89 |
+2.13 |
+2.00% |
-17.64% |
| Biotech |
$BTK |
5,313.91 |
+170.13 |
+3.31% |
-3.71% |
|
|
|
 |
Gap Up and Big Volume-Driven Breakout Gain
Kenneth J. Gruneisen - Passed the CAN SLIM® Master's Exam
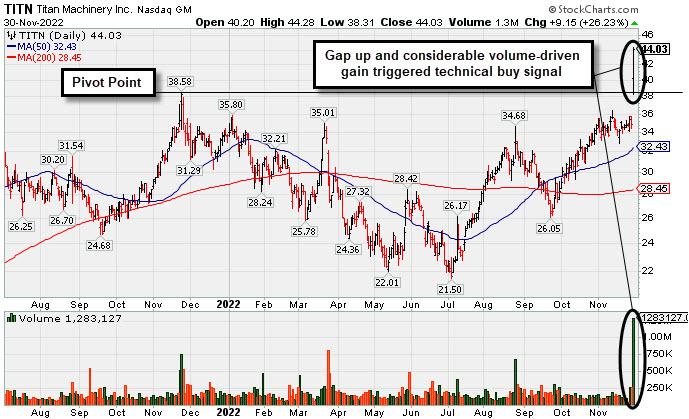
Titan Machinery Inc (TITN +$9.15 or +26.23% to $44.03) finished strong after highlighted in yellow with pivot point cited based on its 11/23/21 high plus 10 cents in the earlier mid-day report (read here). It gapped up rallying for a big volume-driven gain and new all-time high, but it has quickly gotten extended from the prior highs. Disciplined investors avoid chasing stocks more than 5% above the prior high or pivot point.
TITN went through a long consolidation below its 200 DMA line since dropped from the Featured Stocks list on 1/26/22. Fundamentals remain strong. Bullish action came after it reported Oct '22 quarterly earnings +91% on +47% sales revenues versus the year ago period, continuing its streak of strong quarterly comparisons. It currently has the highest possible earnings Per Share Rating of 99. Following years of losses it has shown strong earnings growth for FY '19-22.
The small supply of only 22.6 million shares outstanding (S criteria) can contribute to greater price volatility in the event of institutional buying or selling. The number of top-rated funds owning its shares rose from 241 in Dec '20 to 344 in Sep '22, a reassuring sign concerning the I criteria. Its current Up/Down Volume Ratio of 1.3 is an unbiased indication its shares have been under slight accumulation over the past 50 days.
|
|
|
Color Codes Explained :
Y - Better candidates highlighted by our
staff of experts.
G - Previously featured
in past reports as yellow but may no longer be buyable under the
guidelines.
***Last / Change / Volume data in this table is the closing quote data***
Symbol/Exchange
Company Name
Industry Group |
PRICE |
CHANGE
(%Change) |
Day High |
Volume
(% DAV)
(% 50 day avg vol) |
52 Wk Hi
% From Hi |
Featured
Date |
Price
Featured |
Pivot Featured |
|
Max Buy |
 ESQ
-
NASDAQ
ESQ
-
NASDAQ
Esquire Financial Hldgs
Finance-Commercial Loans
|
$44.84
|
+1.58
3.65% |
$44.97
|
26,529
94.75% of 50 DAV
50 DAV is 28,000
|
$48.13
-6.84%
|
10/18/2022
|
$40.02
|
PP = $39.95
|
|
MB = $41.95
|
 Most Recent Note - 11/30/2022 5:22:52 PM
G - Posted a big gain today with near average volume after 4 consecutive losses. Prior highs and its 50 DMA line ($41.59) coincide in the $41 area defining important near-term support to watch on pullbacks.
>>> FEATURED STOCK ARTICLE : Pulled Back Following "Negative Reversal" at All-Time High - 11/25/2022 |
View all notes |
Set NEW NOTE alert |
Company Profile |
SEC
News |
Chart |
Request a new note
C
A
S
I |
CCRN
-
NASDAQ
Cross Country Healthcare
DIVERSIFIED SERVICES - Staffing and Outsourcing Service
|
$35.78
|
+0.48
1.36% |
$35.80
|
621,277
75.40% of 50 DAV
50 DAV is 824,000
|
$40.12
-10.82%
|
9/9/2022
|
$27.32
|
PP = $30.61
|
|
MB = $32.14
|
Most Recent Note - 11/29/2022 8:32:08 AM
G - It has not formed a new base of sufficient length but has been consolidating above its 50 DMA line ($32.99) and its color code is changed to green while trading above its "max buy" level. Reported Sep '22 quarterly earnings +75% on +70% sales revenues versus the year ago period.
>>> FEATURED STOCK ARTICLE : Consolidating Above Prior Highs and Above 50-Day Moving Average - 11/8/2022 |
View all notes |
Set NEW NOTE alert |
Company Profile |
SEC
News |
Chart |
Request a new note
C
A
S
I |
CMC
-
NYSE
Commercial Metals Co
METALS and MINING - Steel and Iron
|
$49.22
|
+0.84
1.74% |
$49.22
|
753,026
76.29% of 50 DAV
50 DAV is 987,000
|
$49.41
-0.38%
|
10/14/2022
|
$41.61
|
PP = $44.45
|
|
MB = $46.67
|
Most Recent Note - 11/28/2022 9:10:16 PM
G - Pulled back for a 3rd consecutive small loss today with below average volume. Fundamentals remain strong. Prior high in the $44 area defines initial support to watch above its 50 DMA line ($42.67).
>>> FEATURED STOCK ARTICLE : Steel/Metal Products Firm Quietly Perched Near All Time High - 11/7/2022 |
View all notes |
Set NEW NOTE alert |
Company Profile |
SEC
News |
Chart |
Request a new note
C
A
S
I |
VRTX
-
NASDAQ
Vertex Pharmaceuticals
Medical-Biomed/Biotech
|
$316.40
|
+0.07
0.02% |
$322.74
|
5,974,731
422.54% of 50 DAV
50 DAV is 1,414,000
|
$323.61
-2.23%
|
10/24/2022
|
$308.47
|
PP = $306.05
|
|
MB = $321.35
|
Most Recent Note - 11/30/2022 5:37:34 PM
Y - Churned +322% above average volume today but only posted a small gain after briefly trading above its "max buy" level and ended in the lower half of its intra-day range, action indicative of distributional pressure. Its 50 DMA line ($302) defines near-term support above recent intra-day lows in the $287-288 area. Recently reported Sep '22 quarterly earnings +14% on +18% sales revenues versus the year ago period, below the +25% minimum earnings guideline raising fundamental concerns (C criteria). Annual earnings (A criteria) history has been strong.
>>> FEATURED STOCK ARTICLE : Made Little Progress Following Breakout and Latest Earnings News - 11/16/2022 |
View all notes |
Set NEW NOTE alert |
Company Profile |
SEC
News |
Chart |
Request a new note
C
A
S
I |
GPK
-
NYSE
Graphic Packaging Hldg
CONSUMER NON-DURABLES - Packaging and Containers
|
$22.98
|
+0.23
1.01% |
$23.00
|
2,708,124
93.51% of 50 DAV
50 DAV is 2,896,000
|
$24.07
-4.53%
|
10/25/2022
|
$22.75
|
PP = $24.17
|
|
MB = $25.38
|
Most Recent Note - 11/28/2022 9:07:39 PM
Y - Pulled back for a quiet loss today. Volume totals are cooling while consolidating above its 50 DMA line ($21.56). More damaging losses would raise concerns and trigger a technical sell signal. Subsequent gains above the pivot point backed by at least +40% above average volume may trigger a technical buy signal. Fundamentals remain strong.
>>> FEATURED STOCK ARTICLE : Consolidating Above 50-Day Moving Average Still Perched Near High - 11/17/2022 |
View all notes |
Set NEW NOTE alert |
Company Profile |
SEC
News |
Chart |
Request a new note
C
A
S
I |
Symbol/Exchange
Company Name
Industry Group |
PRICE |
CHANGE
(%Change) |
Day High |
Volume
(% DAV)
(% 50 day avg vol) |
52 Wk Hi
% From Hi |
Featured
Date |
Price
Featured |
Pivot Featured |
|
Max Buy |
CBZ
-
NYSE
C B I Z Inc
Comml Svcs-Consulting
|
$49.65
|
+0.81
1.66% |
$49.69
|
228,334
85.52% of 50 DAV
50 DAV is 267,000
|
$50.57
-1.82%
|
10/26/2022
|
$47.83
|
PP = $48.57
|
|
MB = $51.00
|
Most Recent Note - 11/30/2022 5:16:29 PM
Y - Posted a gain with below average volume today as it nearly challenged its 52-week high. Its 50 DMA line ($46.52) and recent low define important near-term support. Recently reported Sep '22 quarterly earnings +24% on +28% sales revenues versus the year ago period.
>>> FEATURED STOCK ARTICLE : Gapped Up and Rebounded Above Pivot Point - 11/18/2022 |
View all notes |
Set NEW NOTE alert |
Company Profile |
SEC
News |
Chart |
Request a new note
C
A
S
I |
ENPH
-
NASDAQ
Enphase Energy Inc
Energy-Solar
|
$320.59
|
+17.20
5.67% |
$320.97
|
3,920,149
99.47% of 50 DAV
50 DAV is 3,941,000
|
$324.84
-1.31%
|
10/26/2022
|
$301.55
|
PP = $324.94
|
|
MB = $341.19
|
Most Recent Note - 11/30/2022 5:20:42 PM
Y - Posted a big gain today with average volume finishing 3 cents off its best-ever close. Perched within close striking distance of its pivot point. Faces no resistance due to overhead supply. Its 50 DMA line ($283) defines near-term support above the recent low ($262.60 on 11/07/22). Fundamentals remain strong.
>>> FEATURED STOCK ARTICLE : Perched Near High Still Awaiting Technical Breakout - 11/21/2022 |
View all notes |
Set NEW NOTE alert |
Company Profile |
SEC
News |
Chart |
Request a new note
C
A
S
I |
HRMY
-
NASDAQ
Harmony Biosciences Holdings
Medical-Biomed/Biotech
|
$59.77
|
+2.33
4.06% |
$59.91
|
429,052
92.13% of 50 DAV
50 DAV is 465,700
|
$61.55
-2.89%
|
11/1/2022
|
$55.31
|
PP = $57.23
|
|
MB = $60.09
|
Most Recent Note - 11/30/2022 5:41:50 PM
Y - Posted a solid gain today with average volume for its second best ever close, finishing perched near its all-time high. The 11/17/22 low ($53.06) defines initial support to watch above its 50 DMA line ($51.93).
>>> FEATURED STOCK ARTICLE : Harmony Still Hovering Near All-Time High - 11/28/2022 |
View all notes |
Set NEW NOTE alert |
Company Profile |
SEC
News |
Chart |
Request a new note
C
A
S
I |
CLH
-
NYSE
Clean Harbors Inc
Pollution Control
|
$120.00
|
+4.54
3.93% |
$120.12
|
494,159
114.65% of 50 DAV
50 DAV is 431,000
|
$124.49
-3.61%
|
11/2/2022
|
$121.59
|
PP = $124.59
|
|
MB = $130.82
|
Most Recent Note - 11/30/2022 5:28:22 PM
Y - Gain today for a prompt rebound above the 50 DMA line ($115.91) helped its outlook improve and its color code is changed to yellow. Fundamentals remain strong.
>>> FEATURED STOCK ARTICLE : Volume-Driven Losses Undercut 50-Day Moving Average - 11/29/2022 |
View all notes |
Set NEW NOTE alert |
Company Profile |
SEC
News |
Chart |
Request a new note
C
A
S
I |
NPO
-
NYSE
Enpro Industries Inc
Machinery-Gen Industrial
|
$118.80
|
+3.73
3.24% |
$118.89
|
124,122
125.38% of 50 DAV
50 DAV is 99,000
|
$127.67
-6.95%
|
11/4/2022
|
$119.06
|
PP = $117.73
|
|
MB = $123.62
|
Most Recent Note - 11/30/2022 5:31:27 PM
Y - Volume was +25% above average as today it managed a "positive reversal" and rebounded back above the pivot point cited. Fundamentals remain strong.
>>> FEATURED STOCK ARTICLE : Finished Strong After Highlighted in Friday Mid-Day Report - 11/4/2022 |
View all notes |
Set NEW NOTE alert |
Company Profile |
SEC
News |
Chart |
Request a new note
C
A
S
I |
Symbol/Exchange
Company Name
Industry Group |
PRICE |
CHANGE
(%Change) |
Day High |
Volume
(% DAV)
(% 50 day avg vol) |
52 Wk Hi
% From Hi |
Featured
Date |
Price
Featured |
Pivot Featured |
|
Max Buy |
DGII
-
NASDAQ
Digi International Inc
COMPUTER HARDWARE - Networking and Communication Dev
|
$42.47
|
+1.81
4.45% |
$42.54
|
411,432
105.23% of 50 DAV
50 DAV is 391,000
|
$43.68
-2.77%
|
11/10/2022
|
$41.82
|
PP = $40.96
|
|
MB = $43.01
|
Most Recent Note - 11/30/2022 5:18:36 PM
Y - Posted a big gain today with average volume finishing one cent below its best ever close. Recently wedged above the pivot point cited based on its 10/31/22 high plus 10 cents after forming an advanced "ascending base" pattern. Subsequent gains above the pivot point backed by at least +40% above average volume are needed to confirm a proper technical buy signal. Fundamentals remain strong.
>>> FEATURED STOCK ARTICLE : Finish Below Pivot Point Leaves Disciplined Investors Waiting - 11/10/2022 |
View all notes |
Set NEW NOTE alert |
Company Profile |
SEC
News |
Chart |
Request a new note
C
A
S
I |
GFF
-
NYSE
Griffon Corporation
MATERIALS and CONSTRUCTION - General Building Materials
|
$35.31
|
+0.19
0.54% |
$35.32
|
561,491
153.41% of 50 DAV
50 DAV is 366,000
|
$36.75
-3.92%
|
11/10/2022
|
$34.13
|
PP = $35.02
|
|
MB = $36.77
|
Most Recent Note - 11/28/2022 9:06:25 PM
Y - Pulled back from its 52-week high with today's loss backed by above average volume. Prior highs in the $34 area define initial support to watch above its 50 DMA line ($31.81). Reported Sep '22 quarterly earnings +230% on +24% sales revenues versus the year ago period.
>>> FEATURED STOCK ARTICLE : Griffon Perched Near 52-Week High After 9-Week Base - 11/11/2022 |
View all notes |
Set NEW NOTE alert |
Company Profile |
SEC
News |
Chart |
Request a new note
C
A
S
I |
ANET
-
NYSE
Arista Networks Inc
Computer-Networking
|
$139.30
|
+5.59
4.18% |
$139.32
|
2,706,945
117.23% of 50 DAV
50 DAV is 2,309,000
|
$148.57
-6.24%
|
11/14/2022
|
$132.05
|
PP = $133.70
|
|
MB = $140.39
|
Most Recent Note - 11/30/2022 5:14:48 PM
Y - Posted a big gain today backed by +17% above average volume and finished at the session high. Subsequent gains and a close above the pivot point must be backed by at least +40% above average volume to trigger a proper technical buy signal. Faces some resistance due to overhead supply up to the $148 level. Fundamentals are strong.
>>> FEATURED STOCK ARTICLE : Finished in Middle of Intra-Day Range After Challenging Pivot Point - 11/14/2022 |
View all notes |
Set NEW NOTE alert |
Company Profile |
SEC
News |
Chart |
Request a new note
C
A
S
I |
CPRX
-
NASDAQ
Catalyst Pharma Inc
Medical-Biomed/Biotech
|
$16.77
|
+0.50
3.07% |
$16.86
|
2,964,792
128.07% of 50 DAV
50 DAV is 2,315,000
|
$18.39
-8.81%
|
11/22/2022
|
$17.38
|
PP = $16.66
|
|
MB = $17.49
|
Most Recent Note - 11/30/2022 5:39:27 PM
Y - Posted a solid gain today after a streak of 4 consecutive losses. Rallied from a 9-week cup-with-handle base with a big gain backed above average volume noted. Reported Sep '22 quarterly earnings +86% on +59% sales revenues versus the year ago period. Disciplined investors avoid chasing stocks that are extended more than +5% above prior highs or the "max buy" level.
>>> FEATURED STOCK ARTICLE : Breakout From Cup-With-Handle With 90% Above Average Volume - 11/22/2022 |
View all notes |
Set NEW NOTE alert |
Company Profile |
SEC
News |
Chart |
Request a new note
C
A
S
I |
CLFD
-
NASDAQ
Clearfield Inc
TELECOMMUNICATIONS - Cables / Satalite Equipment
|
$131.62
|
+7.74
6.25% |
$134.17
|
400,643
141.57% of 50 DAV
50 DAV is 283,000
|
$134.90
-2.43%
|
11/23/2022
|
$131.27
|
PP = $130.11
|
|
MB = $136.62
|
Most Recent Note - 11/30/2022 5:25:44 PM
Y - Posted a big gain today for a best-ever close with +41% above average volume to trigger a new technical buy signal.
>>> FEATURED STOCK ARTICLE : Hit New High But Encountered Distributional Pressure - 11/23/2022 |
View all notes |
Set NEW NOTE alert |
Company Profile |
SEC
News |
Chart |
Request a new note
C
A
S
I |
Symbol/Exchange
Company Name
Industry Group |
PRICE |
CHANGE
(%Change) |
Day High |
Volume
(% DAV)
(% 50 day avg vol) |
52 Wk Hi
% From Hi |
Featured
Date |
Price
Featured |
Pivot Featured |
|
Max Buy |
TITN
-
NASDAQ
Titan Machinery Inc
SPECIALTY RETAIL
|
$44.03
|
+9.15
26.23% |
$44.29
|
1,281,491
921.94% of 50 DAV
50 DAV is 139,000
|
$36.37
21.06%
|
11/30/2022
|
$40.10
|
PP = $38.68
|
|
MB = $40.61
|
Most Recent Note - 11/30/2022 5:12:18 PM
Y - Finished strong after highlighted in yellow with pivot point cited based on its 11/23/21 high plus 10 cents in the earlier mid-day report. Gapped up and rallied for a big gain and new all-time high backed by +821% above average volume triggering a technical buy signal, but quickly getting extended from the prior high. Fundamentals remain strong after reporting Oct '22 quarterly earnings +91% on +47% sales revenues. Went through a long consolidation below its 200 DMA line since dropped from the Featured Stocks list on 1/26/22. See the latest FSU analysis for more details and a new annotated graph.
>>> FEATURED STOCK ARTICLE : Gap Up and Big Volume-Driven Breakout Gain - 11/30/2022 |
View all notes |
Set NEW NOTE alert |
Company Profile |
SEC
News |
Chart |
Request a new note
C
A
S
I |
|
|
|
THESE ARE NOT BUY RECOMMENDATIONS!
Comments contained in the body of this report are technical
opinions only. The material herein has been obtained
from sources believed to be reliable and accurate, however,
its accuracy and completeness cannot be guaranteed.
This site is not an investment advisor, hence it does
not endorse or recommend any securities or other investments.
Any recommendation contained in this report may not
be suitable for all investors and it is not to be deemed
an offer or solicitation on our part with respect to
the purchase or sale of any securities. All trademarks,
service marks and trade names appearing in this report
are the property of their respective owners, and are
likewise used for identification purposes only.
This report is a service available
only to active Paid Premium Members.
You may opt-out of receiving report notifications
at any time. Questions or comments may be submitted
by writing to Premium Membership Services 665 S.E. 10 Street, Suite 201 Deerfield Beach, FL 33441-5634 or by calling 1-800-965-8307
or 954-785-1121.
|
|
|