You are not logged in.
This means you
CAN ONLY VIEW reports that were published prior to Wednesday, March 26, 2025.
You
MUST UPGRADE YOUR MEMBERSHIP if you want to see any current reports.
AFTER MARKET UPDATE - FRIDAY, DECEMBER 15TH, 2017
Previous After Market Report Next After Market Report >>>
|
|
|
|
DOW |
+143.08 |
24,651.74 |
+0.58% |
|
Volume |
2,420,523,510 |
+197% |
|
Volume |
3,504,079,700 |
+76% |
|
NASDAQ |
+80.05 |
6,936.58 |
+1.17% |
|
Advancers |
2,064 |
70% |
|
Advancers |
1,261 |
59% |
|
S&P 500 |
+23.80 |
2,675.81 |
+0.90% |
|
Decliners |
888 |
30% |
|
Decliners |
877 |
41% |
|
Russell 2000 |
+23.47 |
1,530.42 |
+1.56% |
|
52 Wk Highs |
120 |
|
|
52 Wk Highs |
125 |
|
|
S&P 600 |
+16.08 |
932.63 |
+1.75% |
|
52 Wk Lows |
30 |
|
|
52 Wk Lows |
47 |
|
|
 |
Major Indices Again Hit New Record Highs
Kenneth J. Gruneisen - Passed the CAN SLIM® Master's Exam
For the week, the Dow climbed 1.3%, the S&P 500 added 0.9%, and the Nasdaq was 1.4% higher. Stocks jumped higher on Friday. The Dow climbed 143 points to 24651. The S&P 500 gained 23 points to 2675 and the Nasdaq Composite advanced 80 points to 6936. Volume totals reported were much higher than the prior session totals on the NYSE and on the Nasdaq exchange, inflated by options expirations. Advancers led decliners by more than a 2-1 margin on the NYSE and by a 3-2 margin on the Nasdaq exchange. There were 41 high-ranked companies from the Leaders List that made new 52-week highs and were listed on the BreakOuts Page, versus the total of 24 on the prior session. New 52-week highs totals expanded and outnumbered shrinking new 52-week lows on the NYSE and on the Nasdaq exchange. The Featured Stocks Page provides the latest analysis on noteworthy high-ranked leaders. Charts used courtesy of www.stockcharts.com
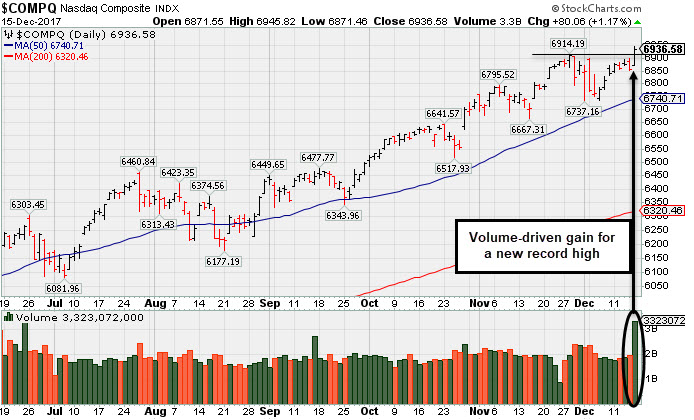 PICTURED: The Nasdaq Composite Index hit a new record high with Friday's volume-driven gain, finishing the session up +28.86% year-to-date.
The major averages (M criteria) are in a confirmed uptrend. Investors should only consider stocks meeting all key criteria of the fact-based investment system as they trigger technical buy signals.
The major averages closed in record territory as investors digested optimistic tax reform news. Potential GOP holdout Senators Marco Rubio and Bob Corker each signaled on Friday they would support the tax bill following last-minute revisions, leading to speculation that a bill could be finalized next week. On the data front, reports showed industrial production grew 0.2% and capacity utilization increased modestly to 77.1% in November.
Ten of 11 sectors in the S&P 500 finished in positive territory with Tech shares pacing the gains. Intel (INTC +3.01%) and Microsoft (MSFT +2.55%) rose. Financials also beat the tape with JP Morgan Chase & Co (JPM +1.41%) up. In earnings news, Oracle (ORCL -3.77%) fell as a reduced outlook for cloud computing tempered better-than-expected results. Adobe (ADBE +1.43%) and Costco (COST +3.32%) rose after each company topped Wall Street estimates on the top and bottom line.
Treasuries were mixed with the yield curve flattening modestly. The 10-year note finished unchanged, yielding 2.35%. In commodities, NYMEX WTI crude gained 0.5% to $57.30/barrel. In FOREX, the U.S. Dollar Index advanced 0.4% to pare most of its weekly loss. |
 Kenneth J. Gruneisen started out as a licensed stockbroker in August 1987, a couple of months prior to the historic stock market crash that took the Dow Jones Industrial Average down -22.6% in a single day. He has published daily fact-based fundamental and technical analysis on high-ranked stocks online for two decades. Through FACTBASEDINVESTING.COM, Kenneth provides educational articles, news, market commentary, and other information regarding proven investment systems that work in good times and bad.
Comments contained in the body of this report are technical opinions only and are not necessarily those of Gruneisen Growth Corp. The material herein has been obtained from sources believed to be reliable and accurate, however, its accuracy and completeness cannot be guaranteed. Our firm, employees, and customers may effect transactions, including transactions contrary to any recommendation herein, or have positions in the securities mentioned herein or options with respect thereto. Any recommendation contained in this report may not be suitable for all investors and it is not to be deemed an offer or solicitation on our part with respect to the purchase or sale of any securities. |
|
 |
Retail, Financial and Tech Shares Rose
Kenneth J. Gruneisen - Passed the CAN SLIM® Master's Exam
The Broker/Dealer Index ($XBD +1.48%) and Bank Index ($BKX +1.22%) both outpaced the Retail Index ($RLX +0.51%) on Friday. The tech sector had a positive bias as the Biotechnology Index ($BTK +1.56%) and the Semiconductor Index ($SOX +1.50%) both outpaced the Networking Index ($NWX +0.53%). The Oil Services Index ($OSX +0.35%) and Integrated Oil Index ($XOI -0.20%) ended mixed, meanwhile the Gold & Silver Index ($XAU +0.68%) posted a decent gain. Charts courtesy wwwstockcharts.com
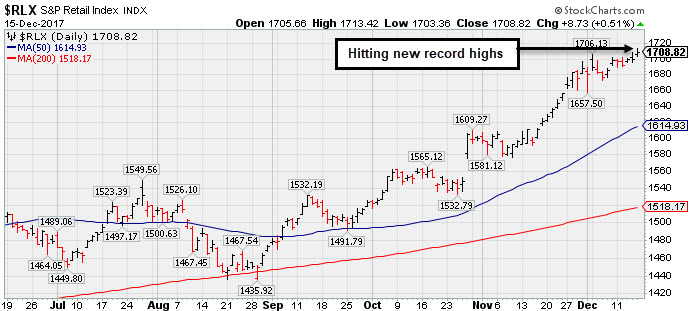 PICTURED: The Retail Index ($RLX +0.51%) is well above its 50-day moving average (DMA) line and hit a new record high today.
| Oil Services |
$OSX |
133.21 |
+0.47 |
+0.35% |
-27.52% |
| Integrated Oil |
$XOI |
1,272.89 |
-2.56 |
-0.20% |
+0.39% |
| Semiconductor |
$SOX |
1,250.89 |
+18.46 |
+1.50% |
+38.00% |
| Networking |
$NWX |
491.44 |
+2.58 |
+0.53% |
+10.16% |
| Broker/Dealer |
$XBD |
263.61 |
+3.85 |
+1.48% |
+28.41% |
| Retail |
$RLX |
1,708.82 |
+8.73 |
+0.51% |
+27.24% |
| Gold & Silver |
$XAU |
80.23 |
+0.55 |
+0.69% |
+1.74% |
| Bank |
$BKX |
106.25 |
+1.28 |
+1.22% |
+15.75% |
| Biotech |
$BTK |
4,173.14 |
+64.25 |
+1.56% |
+35.71% |
|
|
|
 |
Hovering Near High Following 3:2 Share Split
Kenneth J. Gruneisen - Passed the CAN SLIM® Master's Exam
Patrick Industries Inc (PATK +$1.35 or +2.08% to $66.20) has been hovering near its all-time high, extended from its prior base. Its 50-day moving average (DMA) line ($60.82) defines important near-term support to watch. Fundamentals remain strong.
Its small supply of 23.7 million shares (S criteria) in the public float can contribute to greater price volatility in the event of institutional buying or selling. Shares split 3/2 effective 12/11/17, so do not be confused by the impact on the share prices.
PATK finished strong on 10/26/17 after highlighted in yellow with new pivot point cited based on its 10/04/17 high in the mid-day report (read here). It spiked to a new high with a big gain backed by +305% above average volume triggering a technical buy signal. The bullish action came after it reported earnings +37% on +34% sales revenues for the Sep '17 quarter.Quarterly earnings of quarterly comparisons were above the +25% minimum earnings guideline (C criteria) in 2 of the 3 most recent quarters while sales revenues showed encouraging acceleration. A small downturn in FY '13 was a flaw previously noted in its annual earnings (A criteria) history.
It has earned a 96 Earnings Per Share rating and fundamentals remain strong. Leadership (L criteria) from others in the industry group (Building - Mobile/ Mfg & RV) is a reassuring sign. PATK currently has Timeliness Rating of B and also a Sponsorship Rating of B. It was last shown in this FSU section on 11/21/17 with an annotated graph under the headline, "Best Ever Close After Pullback Found Support Near Prior High".
Its current Up/Down Volume ratio of 1.0 is an unbiased indication that its shares were neutral concerning accumulation/distribution over the past 50 days. The number of top-rated funds owning its share rose from 218 in Jun '15 to 329 in Sep '17, a reassuring trend concerning the I criteria.
|
|
|
Color Codes Explained :
Y - Better candidates highlighted by our
staff of experts.
G - Previously featured
in past reports as yellow but may no longer be buyable under the
guidelines.
***Last / Change / Volume data in this table is the closing quote data***
Symbol/Exchange
Company Name
Industry Group |
PRICE |
CHANGE
(%Change) |
Day High |
Volume
(% DAV)
(% 50 day avg vol) |
52 Wk Hi
% From Hi |
Featured
Date |
Price
Featured |
Pivot Featured |
|
Max Buy |
THO
-
NYSE
Thor Industries Inc
AUTOMOTIVE - Recreational Vehicles
|
$149.99
|
+1.06
0.71% |
$150.91
|
538,397
83.34% of 50 DAV
50 DAV is 646,000
|
$156.86
-4.38%
|
8/14/2017
|
$106.67
|
PP = $110.01
|
|
MB = $115.51
|
Most Recent Note - 12/13/2017 5:42:48 PM
G - Still hovering near its all-time high, very extended from any sound base. Its 50 DMA line ($136.60) and prior highs in the $138 area define near-term support to watch. Reported earnings +63% on +31% sales revenues for the Oct '17 quarter, continuing its strong earnings track record.
>>> FEATURED STOCK ARTICLE : Very Extended From Prior Base and Hovering Near Record High - 12/7/2017 |
View all notes |
Set NEW NOTE alert |
Company Profile |
SEC
News |
Chart |
Request a new note
C
A
S
I |
PFBC
-
NASDAQ
Preferred Bank Los Angls
BANKING - Regional - Pacific Banks
|
$61.49
|
+1.22
2.02% |
$62.74
|
147,097
191.78% of 50 DAV
50 DAV is 76,700
|
$66.58
-7.64%
|
10/10/2017
|
$59.38
|
PP = $59.08
|
|
MB = $62.03
|
Most Recent Note - 12/12/2017 2:18:18 PM
G - Recently met resistance in the $66 area yet found prompt support at its 50 DMA line ($60.74) during its consolidation. Fundamentals remain strong.
>>> FEATURED STOCK ARTICLE : Challenged High After Finding Support at 50 Day Moving Average - 12/5/2017 |
View all notes |
Set NEW NOTE alert |
Company Profile |
SEC
News |
Chart |
Request a new note
C
A
S
I |
AVGO
-
NASDAQ
Avago Technologies Ltd
ELECTRONICS - Semiconductor - Broad Line
|
$265.73
|
+6.39
2.46% |
$266.00
|
4,422,618
133.88% of 50 DAV
50 DAV is 3,303,400
|
$285.68
-6.98%
|
10/30/2017
|
$261.19
|
PP = $259.46
|
|
MB = $272.43
|
Most Recent Note - 12/13/2017 5:41:22 PM
G - Recently finding support near prior highs in the $259 area and its 50 DMA line ($260.41). More damaging losses would raise greater concerns. Fundamentals remain strong.
>>> FEATURED STOCK ARTICLE : Testing Support at Prior Highs and 50-Day Average - 12/8/2017 |
View all notes |
Set NEW NOTE alert |
Company Profile |
SEC
News |
Chart |
Request a new note
C
A
S
I |
YY
-
NASDAQ
YY Inc Ads
INTERNET - Internet Service Providers
|
$108.54
|
+0.27
0.25% |
$109.97
|
1,055,001
70.15% of 50 DAV
50 DAV is 1,504,000
|
$123.48
-12.10%
|
9/25/2017
|
$80.26
|
PP = $83.10
|
|
MB = $87.26
|
Most Recent Note - 12/13/2017 5:44:21 PM
G - Consolidating above its prior high ($97.59 on 10/16/17) and above its 50 DMA line ($98.03), still extended from any sound base. Fundamentals remain strong. See the latest FSU analysis for more details and an annotated graph.
>>> FEATURED STOCK ARTICLE : Fundamentals Remain Strong; Extended From Any Sound Base - 12/11/2017 |
View all notes |
Set NEW NOTE alert |
Company Profile |
SEC
News |
Chart |
Request a new note
C
A
S
I |
HTHT
-
NASDAQ
China Lodging Group Ads
LEISURE - Lodging
|
$124.65
|
+2.54
2.08% |
$124.73
|
1,219,220
211.67% of 50 DAV
50 DAV is 576,000
|
$142.80
-12.71%
|
9/29/2016
|
$46.12
|
PP = $47.82
|
|
MB = $50.21
|
Most Recent Note - 12/11/2017 1:09:52 PM
G - Rebounded near its 50 DMA line ($124.84) which may act as resistance. Gains above the 50 DMA line are still needed for its outlook to improve. Fundamentals remain strong.
>>> FEATURED STOCK ARTICLE : Weak Technical Action Raises Concerns Despite Strong Fundamentals - 11/29/2017 |
View all notes |
Set NEW NOTE alert |
Company Profile |
SEC
News |
Chart |
Request a new note
C
A
S
I |
Symbol/Exchange
Company Name
Industry Group |
PRICE |
CHANGE
(%Change) |
Day High |
Volume
(% DAV)
(% 50 day avg vol) |
52 Wk Hi
% From Hi |
Featured
Date |
Price
Featured |
Pivot Featured |
|
Max Buy |
PATK
-
NASDAQ
Patrick Industries Inc
Bldg-Mobile/Mfg and RV
|
$66.20
|
+1.35
2.08% |
$66.88
|
359,068
282.73% of 50 DAV
50 DAV is 127,000
|
$68.63
-3.55%
|
10/26/2017
|
$90.90
|
PP = $87.90
|
|
MB = $92.30
|
 Most Recent Note - 12/15/2017 5:04:35 PM
G - Hovering near its all-time high, extended from its prior base. Its 50 DMA line ($60.83) defines important near-term support to watch. Fundamentals remain strong. Shares split 3/2 effective 12/11/17, so do not be confused by the impact on the share prices. See the latest FSU analysis for more details and a new annotated graph.
>>> FEATURED STOCK ARTICLE : Hovering Near High Following 3:2 Share Split - 12/15/2017 |
View all notes |
Set NEW NOTE alert |
Company Profile |
SEC
News |
Chart |
Request a new note
C
A
S
I |
ESNT
-
NYSE
Essent Group Ltd
Finance-MrtgandRel Svc
|
$44.89
|
+0.12
0.27% |
$45.47
|
1,472,737
158.02% of 50 DAV
50 DAV is 932,000
|
$47.29
-5.08%
|
10/9/2017
|
$39.75
|
PP = $41.54
|
|
MB = $43.62
|
Most Recent Note - 12/14/2017 6:25:35 PM
G - Pulled back from its all-time high after recently wedging higher with gains lacking great volume conviction. Its 50 DMA line ($43.47) defines important near-term support to watch above prior highs in the $41 area. Fundamentals remain strong. See the latest FSU analysis for more details and a new annotated graph.
>>> FEATURED STOCK ARTICLE : Pulling Back After Recently Wedging Higher - 12/14/2017 |
View all notes |
Set NEW NOTE alert |
Company Profile |
SEC
News |
Chart |
Request a new note
C
A
S
I |
FIVE
-
NASDAQ
Five Below Inc
Retail-DiscountandVariety
|
$66.72
|
+1.17
1.78% |
$67.20
|
1,100,848
108.24% of 50 DAV
50 DAV is 1,017,000
|
$67.57
-1.26%
|
10/6/2017
|
$57.13
|
PP = $54.23
|
|
MB = $56.94
|
Most Recent Note - 12/11/2017 7:32:18 PM
G - Encountered distributional pressure today and retreated from its all-time high with a loss on higher volume. Very extended from its prior base, its 50 DMA line ($58.31) and prior highs in the $57-58 area define near-term support to watch. Fundamentals remain strong.
>>> FEATURED STOCK ARTICLE : Getting Extended From Prior Base With Earnings News Due - 11/24/2017 |
View all notes |
Set NEW NOTE alert |
Company Profile |
SEC
News |
Chart |
Request a new note
C
A
S
I |
OLED
-
NASDAQ
Universal Display Corp
Elec-Misc Products
|
$170.55
|
+0.05
0.03% |
$172.60
|
624,344
67.42% of 50 DAV
50 DAV is 926,000
|
$192.75
-11.52%
|
8/31/2017
|
$128.22
|
PP = $127.78
|
|
MB = $134.17
|
Most Recent Note - 12/13/2017 5:36:39 PM
G - Fundamentals remain strong. Has not formed a sound base pattern. The recent low ($158.00 on 12/05/17) and 50 DMA line ($157.25) define important near-term support to watch. Subsequent losses leading to violations may trigger technical sell signals. See the latest FSU analysis for more details and a new annotated graph.
>>> FEATURED STOCK ARTICLE : Consolidating After +50% Rally Since First Featured 8/31/17 - 12/13/2017 |
View all notes |
Set NEW NOTE alert |
Company Profile |
SEC
News |
Chart |
Request a new note
C
A
S
I |
ANET
-
NYSE
Arista Networks Inc
TELECOMMUNICATIONS - Communication Equipment
|
$231.03
|
+4.31
1.90% |
$232.15
|
1,064,147
127.29% of 50 DAV
50 DAV is 836,000
|
$245.65
-5.95%
|
10/27/2017
|
$195.65
|
PP = $196.37
|
|
MB = $206.19
|
Most Recent Note - 12/13/2017 5:40:15 PM
G - Consolidating above its 50 DMA line ($210.35). Below that short-term average its prior low ($206.86 on 12/05/17) defines the next important support level. Subsequent violations would trigger technical sell signals.
>>> FEATURED STOCK ARTICLE : Halted Volume-Driven Pullback at 50-Day Moving Average Line - 12/6/2017 |
View all notes |
Set NEW NOTE alert |
Company Profile |
SEC
News |
Chart |
Request a new note
C
A
S
I |
Symbol/Exchange
Company Name
Industry Group |
PRICE |
CHANGE
(%Change) |
Day High |
Volume
(% DAV)
(% 50 day avg vol) |
52 Wk Hi
% From Hi |
Featured
Date |
Price
Featured |
Pivot Featured |
|
Max Buy |
GRUB
-
NYSE
Grubhub Inc
COMPUTER SOFTWARE and SERVICES - Technical and System Software
|
$72.30
|
+0.76
1.06% |
$73.32
|
4,855,227
341.20% of 50 DAV
50 DAV is 1,423,000
|
$72.55
-0.34%
|
6/21/2017
|
$47.33
|
PP = $46.94
|
|
MB = $49.29
|
Most Recent Note - 12/13/2017 5:45:27 PM
G - Hit yet another new all-time high with today's gain backed by lighter than average volume, getting very extended from any sound base. Its 50 DMA line ($60.97) and prior highs near $57 define support to watch on pullbacks. The 2 latest quarters were below the +25% minimum earnings guideline (C criteria), raising fundamental concerns with regard to the fact-based investment system.
>>> FEATURED STOCK ARTICLE : Extended From Prior Highs After Gains on Light Volume - 11/22/2017 |
View all notes |
Set NEW NOTE alert |
Company Profile |
SEC
News |
Chart |
Request a new note
C
A
S
I |
IBP
-
NYSE
Installed Building Prod
DIVERSIFIED SERVICES - Business/Management Services
|
$72.85
|
+1.75
2.46% |
$73.70
|
374,760
205.91% of 50 DAV
50 DAV is 182,000
|
$79.40
-8.25%
|
9/19/2017
|
$59.15
|
PP = $60.10
|
|
MB = $63.11
|
Most Recent Note - 12/14/2017 6:28:12 PM
G - Posted a solid volume-driven gain today, bouncing from support at its 50 DMA line ($68.36). Subsequent losses leading to a violation may trigger a technical sell signal. Fundamentals remain strong.
>>> FEATURED STOCK ARTICLE : Extended From Any Sound Base After Impressive Rebound and Rally - 12/1/2017 |
View all notes |
Set NEW NOTE alert |
Company Profile |
SEC
News |
Chart |
Request a new note
C
A
S
I |
OLLI
-
NASDAQ
Ollie's Bargain Outlet
Retail-DiscountandVariety
|
$50.00
|
+1.20
2.46% |
$50.15
|
851,127
175.49% of 50 DAV
50 DAV is 485,000
|
$51.53
-2.96%
|
11/21/2017
|
$46.78
|
PP = $47.00
|
|
MB = $49.35
|
Most Recent Note - 12/15/2017 5:05:45 PM
G - Color code is changed to green after rising back above its "max buy" level. Its 50 DMA line ($46.16) defines important near-term support. Fundamentals remain strong.
>>> FEATURED STOCK ARTICLE : Recently Stalled After Reaching a New High - 11/27/2017 |
View all notes |
Set NEW NOTE alert |
Company Profile |
SEC
News |
Chart |
Request a new note
C
A
S
I |
HLI
-
NYSE
Houlihan Lokey Inc Cl A
Finance-Invest Bnk/Bkrs
|
$46.02
|
+0.55
1.21% |
$46.21
|
605,792
243.29% of 50 DAV
50 DAV is 249,000
|
$46.30
-0.60%
|
9/18/2017
|
$37.04
|
PP = $39.78
|
|
MB = $41.77
|
Most Recent Note - 12/12/2017 6:12:03 PM
G - Wedged to a new all-time high with today's 4th consecutive gain, getting more extended from any sound base. Its 50 DMA line ($42.19) defines near-term support to watch. On 10/26/17 it priced a Secondary Offering. Fundamentals remain strong. See the latest FSU analysis for more details and a new annotated graph.
>>> FEATURED STOCK ARTICLE : Wedging Higher With Recent Gains Lacking Great Volume - 12/12/2017 |
View all notes |
Set NEW NOTE alert |
Company Profile |
SEC
News |
Chart |
Request a new note
C
A
S
I |
|
|
|
THESE ARE NOT BUY RECOMMENDATIONS!
Comments contained in the body of this report are technical
opinions only. The material herein has been obtained
from sources believed to be reliable and accurate, however,
its accuracy and completeness cannot be guaranteed.
This site is not an investment advisor, hence it does
not endorse or recommend any securities or other investments.
Any recommendation contained in this report may not
be suitable for all investors and it is not to be deemed
an offer or solicitation on our part with respect to
the purchase or sale of any securities. All trademarks,
service marks and trade names appearing in this report
are the property of their respective owners, and are
likewise used for identification purposes only.
This report is a service available
only to active Paid Premium Members.
You may opt-out of receiving report notifications
at any time. Questions or comments may be submitted
by writing to Premium Membership Services 665 S.E. 10 Street, Suite 201 Deerfield Beach, FL 33441-5634 or by calling 1-800-965-8307
or 954-785-1121.
|
|
|


