You are not logged in.
This means you
CAN ONLY VIEW reports that were published prior to Thursday, March 20, 2025.
You
MUST UPGRADE YOUR MEMBERSHIP if you want to see any current reports.
AFTER MARKET UPDATE - FRIDAY, SEPTEMBER 29TH, 2017
Previous After Market Report Next After Market Report >>>
|
|
|
|
DOW |
+23.89 |
22,405.09 |
+0.11% |
|
Volume |
936,117,300 |
+22% |
|
Volume |
1,973,642,080 |
+5% |
|
NASDAQ |
+42.51 |
6,495.96 |
+0.66% |
|
Advancers |
1,787 |
61% |
|
Advancers |
1,369 |
53% |
|
S&P 500 |
+9.30 |
2,519.36 |
+0.37% |
|
Decliners |
1,151 |
39% |
|
Decliners |
1,237 |
47% |
|
Russell 2000 |
+2.08 |
1,490.86 |
+0.14% |
|
52 Wk Highs |
205 |
|
|
52 Wk Highs |
283 |
|
|
S&P 600 |
+2.39 |
904.34 |
+0.26% |
|
52 Wk Lows |
13 |
|
|
52 Wk Lows |
21 |
|
|
 |
Major Indices Extend Record Rally
Kenneth J. Gruneisen - Passed the CAN SLIM® Master's Exam
For the week, the Dow added 0.3%, while the S&P 500 gained 0.7% and the Nasdaq climbed 1.1%. The Dow gained 2.1% in September while the S&P 500 advanced 1.9% and the Nasdaq was up 1.1%. For the third quarter, the Dow climbed 4.9%, capping the first eight quarter winning streak for the blue-chip index in 20 years. The S&P 500 added 4% while the Nasdaq increased 5.8%. Stocks finished in positive territory Friday. The Dow was up 23 points at 22405. The S&P 500 was up 9 points to 2519. The Nasdaq Composite gained 42 points to 6495. Volume totals reported were higher than the prior session totals on the NYSE and on the Nasdaq exchange. Breadth was positive as advancers led decliners by a 3-2 margin on the NYSE but only by a narrow margin on the Nasdaq exchange. There were 96 high-ranked companies from the Leaders List that made new 52-week highs and were listed on the BreakOuts Page, versus the total of 84 on the prior session. New 52-week highs totals expanded and outnumbered new 52-week lows totals on the Nasdaq exchange and on the NYSE. The Featured Stocks Page provides the latest analysis on noteworthy high-ranked leaders. Charts used courtesy of www.stockcharts.com
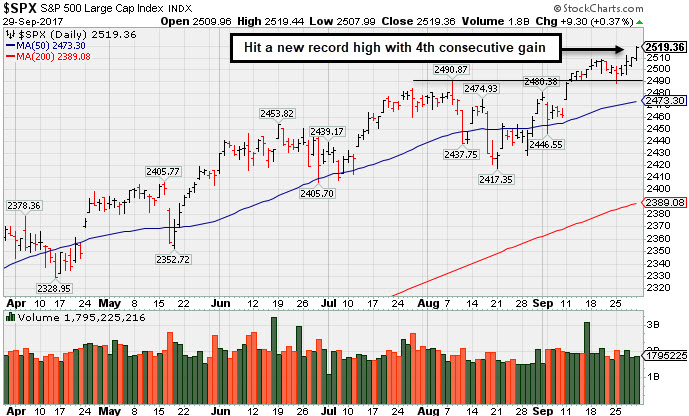 PICTURED: The benchmark S&P 500 Index hit a new record high with a 4th consecutive gain. In mid-August it found prompt support above the prior low after undercutting its 50-day moving average (DMA) line.
The major averages' (M criteria) are in a confirmed uptrend. Leadership has remained healthy. Investors should buy stocks meeting all key criteria of the fact-based investment system on a case-by-case basis as they trigger technical buy signals.
The major averages finished higher while Treasuries declined amid an influx of central bank commentary and economic releases. The Fed chatter included reports that President Trump will nominate a successor to Fed Chair Janet Yellen in the coming weeks. On the data front, The PCE Deflator inched up 0.2% in August, below expectations of a 0.3% increase.
Seven of 11 sectors in the S&P 500 finished in the green with Technology shares outperforming. Facebook (FB +1.27%) rose. In earnings news, Tyson Foods (TSN +7.64%) rose following its increased forward guidance. Scana Corp (SCG +4.90%) continued its recent decline.
Treasuries were lower on the session, the yield on the benchmark 10-year note climbed 3 basis points to 2.33%. In commodities, NYMEX WTI crude rose less than 0.1% to $51.59/barrel. |
 Kenneth J. Gruneisen started out as a licensed stockbroker in August 1987, a couple of months prior to the historic stock market crash that took the Dow Jones Industrial Average down -22.6% in a single day. He has published daily fact-based fundamental and technical analysis on high-ranked stocks online for two decades. Through FACTBASEDINVESTING.COM, Kenneth provides educational articles, news, market commentary, and other information regarding proven investment systems that work in good times and bad.
Comments contained in the body of this report are technical opinions only and are not necessarily those of Gruneisen Growth Corp. The material herein has been obtained from sources believed to be reliable and accurate, however, its accuracy and completeness cannot be guaranteed. Our firm, employees, and customers may effect transactions, including transactions contrary to any recommendation herein, or have positions in the securities mentioned herein or options with respect thereto. Any recommendation contained in this report may not be suitable for all investors and it is not to be deemed an offer or solicitation on our part with respect to the purchase or sale of any securities. |
|
 |
Financial, Retail, Tech and Energy-Linked Groups Rose
Kenneth J. Gruneisen - Passed the CAN SLIM® Master's Exam
On Friday the Broker/Dealer Index ($XBD +0.57%), Bank Index ($BKX +0.59%) and the Retail Index ($RLX +0.49%) each posted a small gain. The tech sector saw unanimous gains from Semiconductor Index ($SOX +0.86%), Biotechnology Index ($BTK +0.51%) and Networking Index ($NWX +0.78%). The Gold & Silver Index ($XAU -1.21%) edged lower while energy-linked groups had a slightly positive bias as the Oil Services Index ($OSX +0.43%) and the Integrated Oil Index ($XOI +0.16%) eked out tiny gains. Charts courtesy www.stockcharts.com
 PICTURED: The Oil Services Index ($OSX +0.43%) recently rebounded above its prior high, rising toward its 200-day moving average (DMA) line.
| Oil Services |
$OSX |
142.17 |
+0.61 |
+0.43% |
-22.65% |
| Integrated Oil |
$XOI |
1,216.14 |
+1.97 |
+0.16% |
-4.09% |
| Semiconductor |
$SOX |
1,171.74 |
+10.05 |
+0.87% |
+29.26% |
| Networking |
$NWX |
465.06 |
+3.59 |
+0.78% |
+4.25% |
| Broker/Dealer |
$XBD |
241.47 |
+1.36 |
+0.57% |
+17.63% |
| Retail |
$RLX |
1,523.19 |
+7.39 |
+0.49% |
+13.47% |
| Gold & Silver |
$XAU |
84.65 |
-1.04 |
-1.21% |
+7.34% |
| Bank |
$BKX |
99.26 |
+0.57 |
+0.58% |
+8.14% |
| Biotech |
$BTK |
4,203.32 |
+21.52 |
+0.51% |
+36.69% |
|
|
|
 |
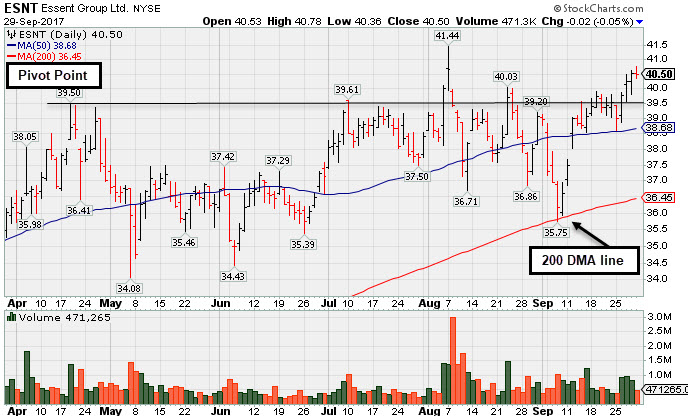
Perched Within Close Striking Distance of Prior High
Kenneth J. Gruneisen - Passed the CAN SLIM® Master's Exam
Essent Group Ltd (ESNT -$0.02 or -0.05% to $40.50) is consolidating above its 50-day moving average (DMA) line ($38.57), and very little resistance remains due to overhead supply. It currently has a Timeliness rating of A and a Sponsorship rating of C
ESNT completed a new Public Offering on 8/08/17. During a subsequent consolidation it found support near prior lows ($36.71 on 8/11/17) and near its 200 DMA line, then a prompt rebound above the 50 DMA line helped its outlook improve. It was last shown in this FSU section on 9/05/17 with an annotated graph under the headline, "Undercut 50-Day Moving Average in Slump Toward Prior Lows".
The high-ranked Finance-Mrtg and Rel Svc firm's quarterly earnings have been above the +25% minimum guideline (C criteria) and sales revenues increases in comparisons through Jun '17 have been strong. Its annual earnings (A criteria) history has been good since its $17 IPO on 10/31/13.
It completed a new Public Offering on 11/19/14. It was first highlighted in yellow with pivot point cited based on its 12/12/16 high plus 10 cents in the 1/25/17 mid-day report (read here). The number of top-rated funds owning its shares rose from 317 in Mar '16 to 454 in Jun '17, a reassuring sign concerning the I criteria. |
|
|
Color Codes Explained :
Y - Better candidates highlighted by our
staff of experts.
G - Previously featured
in past reports as yellow but may no longer be buyable under the
guidelines.
***Last / Change / Volume data in this table is the closing quote data***
Symbol/Exchange
Company Name
Industry Group |
PRICE |
CHANGE
(%Change) |
Day High |
Volume
(% DAV)
(% 50 day avg vol) |
52 Wk Hi
% From Hi |
Featured
Date |
Price
Featured |
Pivot Featured |
|
Max Buy |
MPX
-
NYSE
Marine Products Corp
AUTOMOTIVE - Recreational Vehicles
|
$16.05
|
-0.88
-5.20% |
$17.01
|
96,650
268.47% of 50 DAV
50 DAV is 36,000
|
$17.12
-6.25%
|
9/26/2017
|
$16.30
|
PP = $16.35
|
|
MB = $17.17
|
 Most Recent Note - 9/29/2017 12:53:13 PM
Y - Encountered damaging distributional pressure with a big loss today on higher volume. Members were cautioned in the prior note 5:19PM 9/27/17 - "Hit yet another new high with today's 6th consecutive gain, however, volume was only +13% above average, not indicative of heavy institutional buying demand. It was highlighted in yellow with pivot point cited based on its 7/12/17 high plus 10 cents in the 9/26/17 mid-day report. Gains above the pivot point must be backed by at least +40% above average volume to clinch a convincing technical buy signal. See the latest FSU analysis for more details and an annotated graph."
>>> FEATURED STOCK ARTICLE : Powerboat Maker Hit Another New 52-Week High - 9/26/2017 |
View all notes |
Set NEW NOTE alert |
Company Profile |
SEC
News |
Chart |
Request a new note
C
A
S
I |
THO
-
NYSE
Thor Industries Inc
AUTOMOTIVE - Recreational Vehicles
|
$125.91
|
+2.84
2.31% |
$127.12
|
1,395,125
250.92% of 50 DAV
50 DAV is 556,000
|
$124.16
1.41%
|
8/14/2017
|
$106.67
|
PP = $110.01
|
|
MB = $115.51
|
Most Recent Note - 9/29/2017 1:07:26 PM
G - Hitting yet another new 52-week high with today's 5th consecutive volume-driven gain, getting more extended from the previously noted base. Prior highs in the $115 area define initial support to watch on pullbacks. Fundamentals remain strong.
>>> FEATURED STOCK ARTICLE : Wedged to New High Then Ended the Session Weak - 9/18/2017 |
View all notes |
Set NEW NOTE alert |
Company Profile |
SEC
News |
Chart |
Request a new note
C
A
S
I |
AVGO
-
NASDAQ
Broadcom Limited
ELECTRONICS - Semiconductor - Broad Line
|
$242.54
|
-0.40
-0.16% |
$244.28
|
1,727,224
66.66% of 50 DAV
50 DAV is 2,591,000
|
$259.36
-6.49%
|
8/24/2017
|
$252.44
|
PP = $256.89
|
|
MB = $269.73
|
Most Recent Note - 9/26/2017 6:15:21 PM
G - Halted its slide with a volume-driven gain today. Found support after undercutting recent lows in the $238-240 area with volume-driven losses triggering more worrisome technical sell signals. A rebound above the 50 DMA line ($248) is needed for its outlook to improve.
>>> FEATURED STOCK ARTICLE : Technical Deterioration Raises Concerns - 9/21/2017 |
View all notes |
Set NEW NOTE alert |
Company Profile |
SEC
News |
Chart |
Request a new note
C
A
S
I |
YY
-
NASDAQ
YY Inc Ads
INTERNET - Internet Service Providers
|
$86.78
|
+0.96
1.12% |
$89.37
|
1,488,422
85.39% of 50 DAV
50 DAV is 1,743,000
|
$86.98
-0.23%
|
9/25/2017
|
$80.26
|
PP = $83.10
|
|
MB = $87.26
|
Most Recent Note - 9/27/2017 1:27:57 PM
Y - Hitting another new 52-week high with today's 2nd consecutive volume-driven gain. Encountered distributional pressure on 9/25/17 after highlighted in yellow with pivot point based on its 8/10/17 high plus 10 cents. Gains above the pivot point must be backed by at least +40% above average volume to trigger a proper technical buy signal. This Chinese Internet - Content firm found support in recent weeks above its 50 DMA line. Completed a new Public Offering on 8/16/17. Reported Jun '17 quarterly earnings +53% on +29% sales revenues, its 4th consecutive strong quarterly report above the +25% minimum (C criteria). See the latest FSU analysis for more details and an annotated graph.
>>> FEATURED STOCK ARTICLE : Encountered Distributional Pressure When Challenging Prior HIgh - 9/25/2017 |
View all notes |
Set NEW NOTE alert |
Company Profile |
SEC
News |
Chart |
Request a new note
C
A
S
I |
STMP
-
NASDAQ
Stamps.com Inc
INTERNET - Internet Software and Services
|
$202.65
|
+2.50
1.25% |
$210.55
|
414,306
92.89% of 50 DAV
50 DAV is 446,000
|
$220.25
-7.99%
|
9/11/2017
|
$193.65
|
PP = $220.35
|
|
MB = $231.37
|
Most Recent Note - 9/25/2017 3:12:34 PM
Y - Reversed into the red today after 6 consecutive gains marked by light volume. The new pivot point cited was based on its 8/07/17 high plus 10 cents. Faces some near-term resistance. Subsequent volume-driven gains above the pivot point are needed to trigger a new (or add-on) technical buy signal. Recent low ($185.80 on 9/05/17) and its 50 DMA line ($188) define important near-term support where violations would trigger technical sell signals. Fundamentals remain strong.
>>> FEATURED STOCK ARTICLE : New Base Being Built After Considerable Gap Higher - 9/11/2017 |
View all notes |
Set NEW NOTE alert |
Company Profile |
SEC
News |
Chart |
Request a new note
C
A
S
I |
Symbol/Exchange
Company Name
Industry Group |
PRICE |
CHANGE
(%Change) |
Day High |
Volume
(% DAV)
(% 50 day avg vol) |
52 Wk Hi
% From Hi |
Featured
Date |
Price
Featured |
Pivot Featured |
|
Max Buy |
HTHT
-
NASDAQ
China Lodging Group Ads
LEISURE - Lodging
|
$118.82
|
-1.42
-1.18% |
$120.49
|
274,418
77.08% of 50 DAV
50 DAV is 356,000
|
$126.29
-5.91%
|
9/29/2016
|
$46.12
|
PP = $47.82
|
|
MB = $50.21
|
Most Recent Note - 9/25/2017 3:13:42 PM
G - Pulling back from its all-time high with today's 4th consecutive loss, still very extended from any sound base. Recently reported earnings +19% on +18% sales revenues for the Jun '17 quarter, below the +25% minimum earnings guideline (C criteria). Its 50 DMA line ($106.51) defines near-term support.
>>> FEATURED STOCK ARTICLE : Considerable Rally However Fundamental Concerns Were Raised - 9/12/2017 |
View all notes |
Set NEW NOTE alert |
Company Profile |
SEC
News |
Chart |
Request a new note
C
A
S
I |
LMAT
-
NASDAQ
Lemaitre Vascular Inc
Medical-Products
|
$37.42
|
-0.24
-0.64% |
$37.76
|
175,558
83.20% of 50 DAV
50 DAV is 211,000
|
$39.29
-4.77%
|
7/28/2017
|
$33.50
|
PP = $33.32
|
|
MB = $34.99
|
Most Recent Note - 9/27/2017 5:36:00 PM
G - Posted a 2nd consecutive gain today on light volume. The 50 DMA line ($34.81) defines near-term support to watch above prior highs in the $33 area.
>>> FEATURED STOCK ARTICLE : Quietly Pulling Back From High After More Volume-Driven Gains - 9/22/2017 |
View all notes |
Set NEW NOTE alert |
Company Profile |
SEC
News |
Chart |
Request a new note
C
A
S
I |
ESNT
-
NYSE
Essent Group Ltd
Finance-MrtgandRel Svc
|
$40.50
|
-0.02
-0.05% |
$40.78
|
471,265
66.38% of 50 DAV
50 DAV is 710,000
|
$41.44
-2.27%
|
7/3/2017
|
$38.05
|
PP = $39.60
|
|
MB = $41.58
|
Most Recent Note - 9/29/2017 6:36:07 PM
Y - Consolidating above its 50 DMA line with very little resistance remaining due to overhead supply. See the latest FSU analysis for more details for a new annotated graph.
>>> FEATURED STOCK ARTICLE : Perched Within Close Striking Distance of Prior High - 9/29/2017 |
View all notes |
Set NEW NOTE alert |
Company Profile |
SEC
News |
Chart |
Request a new note
C
A
S
I |
OLED
-
NASDAQ
Universal Display Corp
Elec-Misc Products
|
$128.85
|
+1.00
0.78% |
$129.78
|
583,277
66.51% of 50 DAV
50 DAV is 877,000
|
$145.30
-11.32%
|
8/31/2017
|
$128.22
|
PP = $127.78
|
|
MB = $134.17
|
Most Recent Note - 9/28/2017 6:00:43 PM
Y - Holding its ground after pulling back near prior highs in the $127-130 area. Its 50 DMA line ($122.36) defines the next important support to watch. See the latest FSU analysis for more details and a new annotated graph
>>> FEATURED STOCK ARTICLE : Consolidating Near Prior Highs Following Recent Breakout - 9/28/2017 |
View all notes |
Set NEW NOTE alert |
Company Profile |
SEC
News |
Chart |
Request a new note
C
A
S
I |
ANET
-
NYSE
Arista Networks Inc
TELECOMMUNICATIONS - Communication Equipment
|
$189.61
|
+2.06
1.10% |
$189.90
|
446,198
51.70% of 50 DAV
50 DAV is 863,000
|
$193.24
-1.88%
|
8/4/2017
|
$173.31
|
PP = $163.07
|
|
MB = $171.22
|
Most Recent Note - 9/25/2017 3:10:58 PM
G - Reversed into the red today after hitting yet another new all-time high. extended from any sound base and its 50 DMA line ($168.75) defines important near-term support to watch. Fundamentals remain very strong.
>>> FEATURED STOCK ARTICLE : Extended From Any Sound Base After Additional Volume-Driven Gains - 9/19/2017 |
View all notes |
Set NEW NOTE alert |
Company Profile |
SEC
News |
Chart |
Request a new note
C
A
S
I |
Symbol/Exchange
Company Name
Industry Group |
PRICE |
CHANGE
(%Change) |
Day High |
Volume
(% DAV)
(% 50 day avg vol) |
52 Wk Hi
% From Hi |
Featured
Date |
Price
Featured |
Pivot Featured |
|
Max Buy |
GRUB
-
NYSE
Grubhub Inc
COMPUTER SOFTWARE and SERVICES - Technical and System Software
|
$52.66
|
+0.88
1.70% |
$52.71
|
1,844,488
95.52% of 50 DAV
50 DAV is 1,931,000
|
$57.61
-8.59%
|
6/21/2017
|
$47.33
|
PP = $46.94
|
|
MB = $49.29
|
Most Recent Note - 9/27/2017 5:34:44 PM
G - Posted a gain today with lighter volume. A rebound above its 50 DMA line ($52.63) is needed for its outlook to improve. More damaging losses below the recent low ($49.60 on 9/22/17) would raise greater concerns. The next near-term support is prior highs in the $47 area. Recently reported earnings +13% on +32% sales revenues for the Jun '17 quarter, below the +25% minimum earnings guideline (C criteria) raising fundamental concerns.
>>> FEATURED STOCK ARTICLE : Touched New High With Quiet Gain From Brief Consolidation - 9/7/2017 |
View all notes |
Set NEW NOTE alert |
Company Profile |
SEC
News |
Chart |
Request a new note
C
A
S
I |
IBP
-
NYSE
Installed Building Prod
DIVERSIFIED SERVICES - Business/Management Services
|
$64.80
|
+0.90
1.41% |
$64.90
|
155,533
112.71% of 50 DAV
50 DAV is 138,000
|
$65.60
-1.22%
|
9/19/2017
|
$59.15
|
PP = $60.10
|
|
MB = $63.11
|
Most Recent Note - 9/28/2017 12:34:39 PM
Y - There was a "negative reversal" after early gains into new high territory today following 2 consecutive volume-driven gains. Color code is changed to yellow after retreating below its "max buy" level. Prior highs in the $60 area define initial support after the technical breakout this week.
>>> FEATURED STOCK ARTICLE : Found Prompt Support Near Prior Highs and 50 Day Average - 9/13/2017 |
View all notes |
Set NEW NOTE alert |
Company Profile |
SEC
News |
Chart |
Request a new note
C
A
S
I |
NCOM
-
NASDAQ
National Commerce Corp
BANKING - Regional - Southeast Banks
|
$42.80
|
-0.10
-0.23% |
$43.80
|
52,045
148.70% of 50 DAV
50 DAV is 35,000
|
$42.95
-0.35%
|
4/25/2017
|
$38.95
|
PP = $40.09
|
|
MB = $42.09
|
Most Recent Note - 9/27/2017 5:27:12 PM
G - Hit another new 52-week high with today's 4th consecutive gain adding to an impressive spurt of volume-driven gains. Recently reported Jun '17 earnings +23% on +45% sales revenues, below the +25% minimum earnings guideline (C criteria), raising fundamental concerns.
>>> FEATURED STOCK ARTICLE : Relative Strength Rating Fell Below 80+ Minimum Guideline - 9/14/2017 |
View all notes |
Set NEW NOTE alert |
Company Profile |
SEC
News |
Chart |
Request a new note
C
A
S
I |
OLLI
-
NASDAQ
Ollie's Bargain Outlet
Retail-DiscountandVariety
|
$46.40
|
+0.60
1.31% |
$46.70
|
679,028
121.91% of 50 DAV
50 DAV is 557,000
|
$46.25
0.32%
|
9/8/2017
|
$45.20
|
PP = $46.18
|
|
MB = $48.49
|
Most Recent Note - 9/27/2017 5:31:21 PM
Y - Found support at its 50 DMA line ($44.40) and posted a solid gain today ending near its session high and near its all-time high. New pivot point cited was based on its 8/01/17 high plus 10 cents. Subsequent gains above the latest pivot point with at least the minimum +40% above average volume may trigger a proper new (or add-on) technical buy signal. Fundamentals remain strong.
>>> FEATURED STOCK ARTICLE : New Pivot Point Cited After Rebound From Below 50-Day Average - 9/8/2017 |
View all notes |
Set NEW NOTE alert |
Company Profile |
SEC
News |
Chart |
Request a new note
C
A
S
I |
HLI
-
NYSE
Houlihan Lokey Inc Cl A
Finance-Invest Bnk/Bkrs
|
$39.13
|
-0.18
-0.46% |
$39.37
|
163,164
70.33% of 50 DAV
50 DAV is 232,000
|
$39.68
-1.39%
|
9/18/2017
|
$37.04
|
PP = $39.78
|
|
MB = $41.77
|
Most Recent Note - 9/27/2017 5:15:36 PM
Y - Rebounded further above its 50 DMA line ($36.48) today and finished near the session high. Approaching the new pivot point cited based on its 7/26/17 plus 10 cents. Subsequent volume-driven gains for new highs may trigger a new (or add-on) technical buy signal. Subsequent losses below the recent low ($34.41 on 8/18/17) would raise more serious concerns and trigger a technical sell signal. See the latest FSU analysis for more details and a new annotated graph.
>>> FEATURED STOCK ARTICLE : Rebounding Toward Prior High and New Pivot Point - 9/27/2017 |
View all notes |
Set NEW NOTE alert |
Company Profile |
SEC
News |
Chart |
Request a new note
C
A
S
I |
Symbol/Exchange
Company Name
Industry Group |
PRICE |
CHANGE
(%Change) |
Day High |
Volume
(% DAV)
(% 50 day avg vol) |
52 Wk Hi
% From Hi |
Featured
Date |
Price
Featured |
Pivot Featured |
|
Max Buy |
|
|
|
THESE ARE NOT BUY RECOMMENDATIONS!
Comments contained in the body of this report are technical
opinions only. The material herein has been obtained
from sources believed to be reliable and accurate, however,
its accuracy and completeness cannot be guaranteed.
This site is not an investment advisor, hence it does
not endorse or recommend any securities or other investments.
Any recommendation contained in this report may not
be suitable for all investors and it is not to be deemed
an offer or solicitation on our part with respect to
the purchase or sale of any securities. All trademarks,
service marks and trade names appearing in this report
are the property of their respective owners, and are
likewise used for identification purposes only.
This report is a service available
only to active Paid Premium Members.
You may opt-out of receiving report notifications
at any time. Questions or comments may be submitted
by writing to Premium Membership Services 665 S.E. 10 Street, Suite 201 Deerfield Beach, FL 33441-5634 or by calling 1-800-965-8307
or 954-785-1121.
|
|
|