You are not logged in.
This means you
CAN ONLY VIEW reports that were published prior to Tuesday, April 15, 2025.
You
MUST UPGRADE YOUR MEMBERSHIP if you want to see any current reports.
AFTER MARKET UPDATE - WEDNESDAY, SEPTEMBER 27TH, 2017
Previous After Market Report Next After Market Report >>>
|
|
|
|
DOW |
+56.39 |
22,340.71 |
+0.25% |
|
Volume |
835,488,840 |
+13% |
|
Volume |
2,045,460,624 |
+7% |
|
NASDAQ |
+73.10 |
6,453.26 |
+1.15% |
|
Advancers |
1,650 |
56% |
|
Advancers |
1,706 |
67% |
|
S&P 500 |
+10.20 |
2,507.04 |
+0.41% |
|
Decliners |
1,286 |
44% |
|
Decliners |
853 |
33% |
|
Russell 2000 |
+27.95 |
1,484.81 |
+1.92% |
|
52 Wk Highs |
191 |
|
|
52 Wk Highs |
275 |
|
|
S&P 600 |
+17.81 |
899.58 |
+2.02% |
|
52 Wk Lows |
16 |
|
|
52 Wk Lows |
31 |
|
|
 |
Leadership Expanded as Major Indices Rallied on Higher Volume
Kenneth J. Gruneisen - Passed the CAN SLIM® Master's Exam
Stocks rose on Wednesday’s session. The Dow was up 56 points to 22340. The S&P 500 gained 10 points to 2507. The Nasdaq Composite surged 73 points to 6453. Volume totals reported were higher than the prior session totals on the NYSE and on the Nasdaq exchange. Breadth was positive as advancers led decliners by a 4-3 margin on the NYSE and by a 2-1 margin on the Nasdaq exchange. There were 120 high-ranked companies from the Leaders List that made new 52-week highs and were listed on the BreakOuts Page, versus the total of 64 on the prior session. New 52-week highs totals expanded and solidly outnumbered new 52-week lows totals on the Nasdaq exchange and on the NYSE. The Featured Stocks Page provides the latest analysis on noteworthy high-ranked leaders. Charts used courtesy of www.stockcharts.com
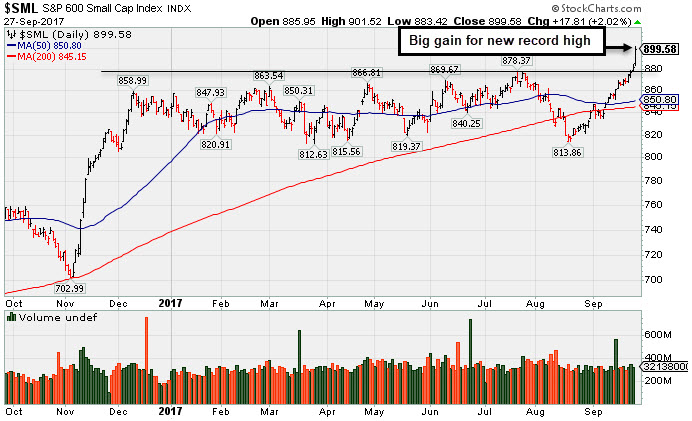 PICTURED: The S&P 600 Small Cap Index powered above prior highs into new record high territory. In mid-August it found support near a prior low then rebounded above its 50-day and 200-day moving average (DMA) lines.
The major averages' (M criteria) uptrend endured recent pressure however leadership has remained healthy. Investors should buy stocks meeting all key criteria of the fact-based investment system on a case-by-case basis as they trigger technical buy signals.
The major averages finished firmly higher as investors reacted positively to President Trump’s proposed tax reform plan which stands to benefit corporations. In economic news, durable goods orders rose 1.7% in August compared to a projected 1.0% increase. A separate report showed pending home sales were down 2.6% last month, compared to an expected 0.5% decrease, and marked the fourth annualized decline in five months.
Financials, Technology and Consumer Discretionary were the best performing sectors on the session. Bank of America (BAC +2.42%) rose. Shares of Micron (MU +8.51%) jumped following the chipmaker’s positive earnings results and increased forward guidance. Amazon (AMZN +1.31%) rose to counter Nike (NKE -1.92%) falling after posting its slowest sales growth in nearly seven years. Cintas (CTAS +5.81%) as the uniform rental company’s quarterly profits exceeded analyst forecasts.
Treasuries retreated following Tuesday’s central bank commentary on monetary policy. The yield on the benchmark 10-year note finished at a two month high, up seven basis points at 2.30%. In commodities, NYMEX WTI crude gained 0.4% to $52.06/barrel after a report showed weekly U.S. inventories unexpectedly declined 1.8 million barrels. COMEX gold retreated 1.1% to $1282.90/ounce amid a stronger dollar. |
 Kenneth J. Gruneisen started out as a licensed stockbroker in August 1987, a couple of months prior to the historic stock market crash that took the Dow Jones Industrial Average down -22.6% in a single day. He has published daily fact-based fundamental and technical analysis on high-ranked stocks online for two decades. Through FACTBASEDINVESTING.COM, Kenneth provides educational articles, news, market commentary, and other information regarding proven investment systems that work in good times and bad.
Comments contained in the body of this report are technical opinions only and are not necessarily those of Gruneisen Growth Corp. The material herein has been obtained from sources believed to be reliable and accurate, however, its accuracy and completeness cannot be guaranteed. Our firm, employees, and customers may effect transactions, including transactions contrary to any recommendation herein, or have positions in the securities mentioned herein or options with respect thereto. Any recommendation contained in this report may not be suitable for all investors and it is not to be deemed an offer or solicitation on our part with respect to the purchase or sale of any securities. |
|
 |
Financial, Retail, Tech, and Energy-Linked Indexes Rose
Kenneth J. Gruneisen - Passed the CAN SLIM® Master's Exam
On Wednesday the Broker/Dealer Index ($XBD +2.12%) and the Bank Index ($BKX +1.63%) both posted solid gains as they outpaced the Retail Index ($RLX +0.79%). The tech sector was led by the Semiconductor Index ($SOX +2.36%) as the Networking Index ($NWX +1.12%) and the Biotechnology Index ($BTK +0.58%) followed with smaller gains. The Gold & Silver Index ($XAU -1.30%) fell while the Oil Services Index ($OSX +0.80%) and the Integrated Oil Index ($XOI +0.32%) both posted gains. Charts courtesy www.stockcharts.com
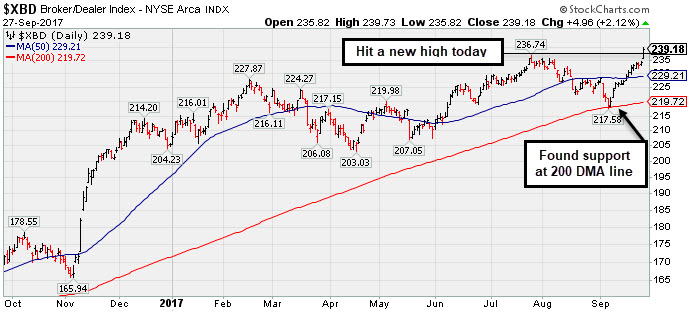 PICTURED: The Broker/Dealer Index ($XBD +2.12%) posted a big gain and rallied above its prior high. It found prompt support at its 200-day moving average (DMA) line during its consolidation, then rebounded above the 50 DMA line. Healthier action in recent weeks from the financial indexes is reassuring because they have been reliable leading indicators for the market.
| Oil Services |
$OSX |
141.73 |
+1.12 |
+0.80% |
-22.88% |
| Integrated Oil |
$XOI |
1,213.11 |
+3.87 |
+0.32% |
-4.33% |
| Semiconductor |
$SOX |
1,153.00 |
+26.60 |
+2.36% |
+27.20% |
| Networking |
$NWX |
463.22 |
+5.15 |
+1.12% |
+3.84% |
| Broker/Dealer |
$XBD |
239.18 |
+4.96 |
+2.12% |
+16.51% |
| Retail |
$RLX |
1,512.09 |
+11.82 |
+0.79% |
+12.59% |
| Gold & Silver |
$XAU |
84.75 |
-1.11 |
-1.29% |
+7.47% |
| Bank |
$BKX |
98.55 |
+1.58 |
+1.63% |
+7.36% |
| Biotech |
$BTK |
4,160.37 |
+24.15 |
+0.58% |
+35.30% |
|
|
|
 |
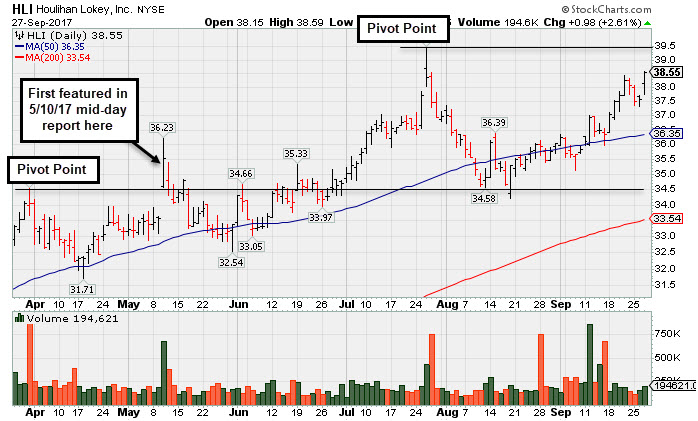
Rebounding Toward Prior High and New Pivot Point
Kenneth J. Gruneisen - Passed the CAN SLIM® Master's Exam
Houlihan Lokey Inc (HLI +$0.98 or +2.61% to $38.55) rebounded further above its 50-day moving average (DMA) line ($36.35) toward the prior high. A new pivot point was recently cited based on its 7/26/17 plus 10 cents. Subsequent volume-driven gains for new highs may trigger a new (or add-on) technical buy signal. Subsequent losses below the recent low ($34.41 on 8/18/17) would raise more serious concerns and trigger a technical sell signal.
HLI was last shown in this FSU section on Tuesday, August 29, 2017 with an annotated graph, "Consolidating Near 50-Day Moving Average". It was highlighted in yellow in the 5/10/17 mid-day report (read here) with pivot point cited based on its 3/31/17 high plus 10 cents after an orderly flat base.
The high ranked Finance - Invest Bank//Broker firm reported earnings +43% on +20% sales revenues for the Jun '17 quarter, and 3 of the past 4 quarterly comparisons were above the +25% minimum earning guideline (C criteria). Annual earnings growth (A criteria) history is a good match with the fact-based investment system's guidelines. It has an Earnings Per share rating of 98.
It has a current Timeliness rating of B and a Sponsorship rating of D. The number of top-rated funds owning its shares rose from 165 in Jun '16 to 265 in Jun '17, a reassuring sign concerning the I criteria. Its small supply of only 24.6 million shares (S criteria) in the public float can contribute to greater price volatility in the event of institutional buying or selling.
|
|
|
Color Codes Explained :
Y - Better candidates highlighted by our
staff of experts.
G - Previously featured
in past reports as yellow but may no longer be buyable under the
guidelines.
***Last / Change / Volume data in this table is the closing quote data***
Symbol/Exchange
Company Name
Industry Group |
PRICE |
CHANGE
(%Change) |
Day High |
Volume
(% DAV)
(% 50 day avg vol) |
52 Wk Hi
% From Hi |
Featured
Date |
Price
Featured |
Pivot Featured |
|
Max Buy |
MPX
-
NYSE
Marine Products Corp
AUTOMOTIVE - Recreational Vehicles
|
$16.98
|
+0.67
4.11% |
$17.12
|
40,649
112.91% of 50 DAV
50 DAV is 36,000
|
$16.50
2.91%
|
9/26/2017
|
$16.30
|
PP = $16.35
|
|
MB = $17.17
|
 Most Recent Note - 9/27/2017 5:19:38 PM
Y - Hit yet another new high with today's 6th consecutive gain, however, volume was only +13% above average, not indicative of heavy institutional buying demand. It was highlighted in yellow with pivot point cited based on its 7/12/17 high plus 10 cents in the 9/26/17 mid-day report. Gains above the pivot point must be backed by at least +40% above average volume to clinch a convincing technical buy signal. See the latest FSU analysis for more details and an annotated graph.
>>> FEATURED STOCK ARTICLE : Powerboat Maker Hit Another New 52-Week High - 9/26/2017 |
View all notes |
Set NEW NOTE alert |
Company Profile |
SEC
News |
Chart |
Request a new note
C
A
S
I |
THO
-
NYSE
Thor Industries Inc
AUTOMOTIVE - Recreational Vehicles
|
$119.99
|
+2.75
2.35% |
$120.41
|
1,653,696
315.59% of 50 DAV
50 DAV is 524,000
|
$118.45
1.30%
|
8/14/2017
|
$106.67
|
PP = $110.01
|
|
MB = $115.51
|
Most Recent Note - 9/27/2017 5:22:50 PM
G - Color code is changed to green after hitting a new 52-week high and rallying above its "max buy" level with +235% above average volume behind today's gain. Reported Jul '17 quarterly earnings +44% on +50% sales revenues, and volume and volatility often increase near earnings news.
>>> FEATURED STOCK ARTICLE : Wedged to New High Then Ended the Session Weak - 9/18/2017 |
View all notes |
Set NEW NOTE alert |
Company Profile |
SEC
News |
Chart |
Request a new note
C
A
S
I |
AVGO
-
NASDAQ
Broadcom Limited
ELECTRONICS - Semiconductor - Broad Line
|
$240.58
|
+3.31
1.40% |
$242.67
|
2,615,972
102.03% of 50 DAV
50 DAV is 2,564,000
|
$259.36
-7.24%
|
8/24/2017
|
$252.44
|
PP = $256.89
|
|
MB = $269.73
|
Most Recent Note - 9/26/2017 6:15:21 PM
G - Halted its slide with a volume-driven gain today. Found support after undercutting recent lows in the $238-240 area with volume-driven losses triggering more worrisome technical sell signals. A rebound above the 50 DMA line ($248) is needed for its outlook to improve.
>>> FEATURED STOCK ARTICLE : Technical Deterioration Raises Concerns - 9/21/2017 |
View all notes |
Set NEW NOTE alert |
Company Profile |
SEC
News |
Chart |
Request a new note
C
A
S
I |
EW
-
NYSE
Edwards Lifesciences Cp
HEALTH SERVICES - Medical Appliances and Equipment
|
$109.37
|
-1.22
-1.10% |
$110.39
|
2,268,426
175.13% of 50 DAV
50 DAV is 1,295,300
|
$121.75
-10.17%
|
7/11/2017
|
$117.23
|
PP = $121.85
|
|
MB = $127.94
|
Most Recent Note - 9/27/2017 5:25:43 PM
Met resistance at its 50 DMA line and slumped in recent weeks. It will be dropped from the Featured Stocks list tonight due to technical deterioration. A rebound above its downward sloping 50 DMA line ($114) is needed for its outlook to improve. Fundamentals remain strong.
>>> FEATURED STOCK ARTICLE : Positive Reversal After Slumping to New Lows - 9/6/2017 |
View all notes |
Set NEW NOTE alert |
Company Profile |
SEC
News |
Chart |
Request a new note
C
A
S
I |
YY
-
NASDAQ
YY Inc Ads
INTERNET - Internet Service Providers
|
$85.08
|
+0.66
0.78% |
$86.80
|
2,736,700
160.13% of 50 DAV
50 DAV is 1,709,000
|
$85.59
-0.60%
|
9/25/2017
|
$80.26
|
PP = $83.10
|
|
MB = $87.26
|
Most Recent Note - 9/27/2017 1:27:57 PM
Y - Hitting another new 52-week high with today's 2nd consecutive volume-driven gain. Encountered distributional pressure on 9/25/17 after highlighted in yellow with pivot point based on its 8/10/17 high plus 10 cents. Gains above the pivot point must be backed by at least +40% above average volume to trigger a proper technical buy signal. This Chinese Internet - Content firm found support in recent weeks above its 50 DMA line. Completed a new Public Offering on 8/16/17. Reported Jun '17 quarterly earnings +53% on +29% sales revenues, its 4th consecutive strong quarterly report above the +25% minimum (C criteria). See the latest FSU analysis for more details and an annotated graph.
>>> FEATURED STOCK ARTICLE : Encountered Distributional Pressure When Challenging Prior HIgh - 9/25/2017 |
View all notes |
Set NEW NOTE alert |
Company Profile |
SEC
News |
Chart |
Request a new note
C
A
S
I |
Symbol/Exchange
Company Name
Industry Group |
PRICE |
CHANGE
(%Change) |
Day High |
Volume
(% DAV)
(% 50 day avg vol) |
52 Wk Hi
% From Hi |
Featured
Date |
Price
Featured |
Pivot Featured |
|
Max Buy |
STMP
-
NASDAQ
Stamps.com Inc
INTERNET - Internet Software and Services
|
$203.95
|
+0.95
0.47% |
$205.35
|
435,350
98.05% of 50 DAV
50 DAV is 444,000
|
$220.25
-7.40%
|
9/11/2017
|
$193.65
|
PP = $220.35
|
|
MB = $231.37
|
Most Recent Note - 9/25/2017 3:12:34 PM
Y - Reversed into the red today after 6 consecutive gains marked by light volume. The new pivot point cited was based on its 8/07/17 high plus 10 cents. Faces some near-term resistance. Subsequent volume-driven gains above the pivot point are needed to trigger a new (or add-on) technical buy signal. Recent low ($185.80 on 9/05/17) and its 50 DMA line ($188) define important near-term support where violations would trigger technical sell signals. Fundamentals remain strong.
>>> FEATURED STOCK ARTICLE : New Base Being Built After Considerable Gap Higher - 9/11/2017 |
View all notes |
Set NEW NOTE alert |
Company Profile |
SEC
News |
Chart |
Request a new note
C
A
S
I |
HTHT
-
NASDAQ
China Lodging Group Ads
LEISURE - Lodging
|
$123.34
|
+4.98
4.21% |
$123.76
|
269,141
74.35% of 50 DAV
50 DAV is 362,000
|
$126.29
-2.34%
|
9/29/2016
|
$46.12
|
PP = $47.82
|
|
MB = $50.21
|
Most Recent Note - 9/25/2017 3:13:42 PM
G - Pulling back from its all-time high with today's 4th consecutive loss, still very extended from any sound base. Recently reported earnings +19% on +18% sales revenues for the Jun '17 quarter, below the +25% minimum earnings guideline (C criteria). Its 50 DMA line ($106.51) defines near-term support.
>>> FEATURED STOCK ARTICLE : Considerable Rally However Fundamental Concerns Were Raised - 9/12/2017 |
View all notes |
Set NEW NOTE alert |
Company Profile |
SEC
News |
Chart |
Request a new note
C
A
S
I |
LMAT
-
NASDAQ
Lemaitre Vascular Inc
Medical-Products
|
$37.68
|
+0.69
1.87% |
$38.12
|
113,004
53.30% of 50 DAV
50 DAV is 212,000
|
$39.29
-4.10%
|
7/28/2017
|
$33.50
|
PP = $33.32
|
|
MB = $34.99
|
Most Recent Note - 9/27/2017 5:36:00 PM
G - Posted a 2nd consecutive gain today on light volume. The 50 DMA line ($34.81) defines near-term support to watch above prior highs in the $33 area.
>>> FEATURED STOCK ARTICLE : Quietly Pulling Back From High After More Volume-Driven Gains - 9/22/2017 |
View all notes |
Set NEW NOTE alert |
Company Profile |
SEC
News |
Chart |
Request a new note
C
A
S
I |
ESNT
-
NYSE
Essent Group Ltd
Finance-MrtgandRel Svc
|
$40.25
|
+0.47
1.18% |
$40.47
|
930,971
132.43% of 50 DAV
50 DAV is 703,000
|
$41.44
-2.87%
|
7/3/2017
|
$38.05
|
PP = $39.60
|
|
MB = $41.58
|
Most Recent Note - 9/25/2017 3:15:18 PM
Y - Still quietly consolidating just above its 50 DMA line ($38.57), and little resistance remains due to overhead supply. Completed a new Public Offering on 8/08/17.
>>> FEATURED STOCK ARTICLE : Undercut 50-Day Moving Average in Slump Toward Prior Lows - 9/5/2017 |
View all notes |
Set NEW NOTE alert |
Company Profile |
SEC
News |
Chart |
Request a new note
C
A
S
I |
OLED
-
NASDAQ
Universal Display Corp
Elec-Misc Products
|
$127.85
|
+2.40
1.91% |
$129.00
|
809,228
91.54% of 50 DAV
50 DAV is 884,000
|
$145.30
-12.01%
|
8/31/2017
|
$128.22
|
PP = $127.78
|
|
MB = $134.17
|
Most Recent Note - 9/27/2017 5:29:17 PM
Y - Holding its ground the past 2 sessions after pulling back near prior highs in the $127-130 area. Its 50 DMA line ($122.28) defines the next important support to watch.
>>> FEATURED STOCK ARTICLE : Rallied Near Pivot Point But Confirming Gains Are Still Needed - 8/31/2017 |
View all notes |
Set NEW NOTE alert |
Company Profile |
SEC
News |
Chart |
Request a new note
C
A
S
I |
Symbol/Exchange
Company Name
Industry Group |
PRICE |
CHANGE
(%Change) |
Day High |
Volume
(% DAV)
(% 50 day avg vol) |
52 Wk Hi
% From Hi |
Featured
Date |
Price
Featured |
Pivot Featured |
|
Max Buy |
ANET
-
NYSE
Arista Networks Inc
TELECOMMUNICATIONS - Communication Equipment
|
$186.55
|
+3.89
2.13% |
$190.96
|
606,412
70.60% of 50 DAV
50 DAV is 859,000
|
$193.24
-3.46%
|
8/4/2017
|
$173.31
|
PP = $163.07
|
|
MB = $171.22
|
Most Recent Note - 9/25/2017 3:10:58 PM
G - Reversed into the red today after hitting yet another new all-time high. extended from any sound base and its 50 DMA line ($168.75) defines important near-term support to watch. Fundamentals remain very strong.
>>> FEATURED STOCK ARTICLE : Extended From Any Sound Base After Additional Volume-Driven Gains - 9/19/2017 |
View all notes |
Set NEW NOTE alert |
Company Profile |
SEC
News |
Chart |
Request a new note
C
A
S
I |
GRUB
-
NYSE
Grubhub Inc
COMPUTER SOFTWARE and SERVICES - Technical and System Software
|
$51.61
|
+0.87
1.71% |
$51.90
|
1,605,135
83.82% of 50 DAV
50 DAV is 1,915,000
|
$57.61
-10.41%
|
6/21/2017
|
$47.33
|
PP = $46.94
|
|
MB = $49.29
|
Most Recent Note - 9/27/2017 5:34:44 PM
G - Posted a gain today with lighter volume. A rebound above its 50 DMA line ($52.63) is needed for its outlook to improve. More damaging losses below the recent low ($49.60 on 9/22/17) would raise greater concerns. The next near-term support is prior highs in the $47 area. Recently reported earnings +13% on +32% sales revenues for the Jun '17 quarter, below the +25% minimum earnings guideline (C criteria) raising fundamental concerns.
>>> FEATURED STOCK ARTICLE : Touched New High With Quiet Gain From Brief Consolidation - 9/7/2017 |
View all notes |
Set NEW NOTE alert |
Company Profile |
SEC
News |
Chart |
Request a new note
C
A
S
I |
IBP
-
NYSE
Installed Building Prod
DIVERSIFIED SERVICES - Business/Management Services
|
$64.00
|
+2.50
4.07% |
$64.95
|
434,942
329.50% of 50 DAV
50 DAV is 132,000
|
$62.50
2.40%
|
9/19/2017
|
$59.15
|
PP = $60.10
|
|
MB = $63.11
|
Most Recent Note - 9/27/2017 1:07:26 PM
G - Color code is changed to green while rallying above its "max buy" level. Gain with +72% above average volume on the prior session cleared the pivot point and triggered a technical buy signal.
>>> FEATURED STOCK ARTICLE : Found Prompt Support Near Prior Highs and 50 Day Average - 9/13/2017 |
View all notes |
Set NEW NOTE alert |
Company Profile |
SEC
News |
Chart |
Request a new note
C
A
S
I |
NCOM
-
NASDAQ
National Commerce Corp
BANKING - Regional - Southeast Banks
|
$42.25
|
+0.85
2.05% |
$42.40
|
78,739
238.60% of 50 DAV
50 DAV is 33,000
|
$41.50
1.81%
|
4/25/2017
|
$38.95
|
PP = $40.09
|
|
MB = $42.09
|
Most Recent Note - 9/27/2017 5:27:12 PM
G - Hit another new 52-week high with today's 4th consecutive gain adding to an impressive spurt of volume-driven gains. Recently reported Jun '17 earnings +23% on +45% sales revenues, below the +25% minimum earnings guideline (C criteria), raising fundamental concerns.
>>> FEATURED STOCK ARTICLE : Relative Strength Rating Fell Below 80+ Minimum Guideline - 9/14/2017 |
View all notes |
Set NEW NOTE alert |
Company Profile |
SEC
News |
Chart |
Request a new note
C
A
S
I |
OLLI
-
NASDAQ
Ollie's Bargain Outlet
Retail-DiscountandVariety
|
$45.95
|
+1.35
3.03% |
$46.00
|
582,110
103.95% of 50 DAV
50 DAV is 560,000
|
$46.25
-0.65%
|
9/8/2017
|
$45.20
|
PP = $46.18
|
|
MB = $48.49
|
Most Recent Note - 9/27/2017 5:31:21 PM
Y - Found support at its 50 DMA line ($44.40) and posted a solid gain today ending near its session high and near its all-time high. New pivot point cited was based on its 8/01/17 high plus 10 cents. Subsequent gains above the latest pivot point with at least the minimum +40% above average volume may trigger a proper new (or add-on) technical buy signal. Fundamentals remain strong.
>>> FEATURED STOCK ARTICLE : New Pivot Point Cited After Rebound From Below 50-Day Average - 9/8/2017 |
View all notes |
Set NEW NOTE alert |
Company Profile |
SEC
News |
Chart |
Request a new note
C
A
S
I |
Symbol/Exchange
Company Name
Industry Group |
PRICE |
CHANGE
(%Change) |
Day High |
Volume
(% DAV)
(% 50 day avg vol) |
52 Wk Hi
% From Hi |
Featured
Date |
Price
Featured |
Pivot Featured |
|
Max Buy |
HLI
-
NYSE
Houlihan Lokey Inc Cl A
Finance-Invest Bnk/Bkrs
|
$38.55
|
+0.98
2.61% |
$38.59
|
191,815
83.04% of 50 DAV
50 DAV is 231,000
|
$39.68
-2.85%
|
9/18/2017
|
$37.04
|
PP = $39.78
|
|
MB = $41.77
|
Most Recent Note - 9/27/2017 5:15:36 PM
Y - Rebounded further above its 50 DMA line ($36.48) today and finished near the session high. Approaching the new pivot point cited based on its 7/26/17 plus 10 cents. Subsequent volume-driven gains for new highs may trigger a new (or add-on) technical buy signal. Subsequent losses below the recent low ($34.41 on 8/18/17) would raise more serious concerns and trigger a technical sell signal. See the latest FSU analysis for more details and a new annotated graph.
>>> FEATURED STOCK ARTICLE : Rebounding Toward Prior High and New Pivot Point - 9/27/2017 |
View all notes |
Set NEW NOTE alert |
Company Profile |
SEC
News |
Chart |
Request a new note
C
A
S
I |
|
|
|
THESE ARE NOT BUY RECOMMENDATIONS!
Comments contained in the body of this report are technical
opinions only. The material herein has been obtained
from sources believed to be reliable and accurate, however,
its accuracy and completeness cannot be guaranteed.
This site is not an investment advisor, hence it does
not endorse or recommend any securities or other investments.
Any recommendation contained in this report may not
be suitable for all investors and it is not to be deemed
an offer or solicitation on our part with respect to
the purchase or sale of any securities. All trademarks,
service marks and trade names appearing in this report
are the property of their respective owners, and are
likewise used for identification purposes only.
This report is a service available
only to active Paid Premium Members.
You may opt-out of receiving report notifications
at any time. Questions or comments may be submitted
by writing to Premium Membership Services 665 S.E. 10 Street, Suite 201 Deerfield Beach, FL 33441-5634 or by calling 1-800-965-8307
or 954-785-1121.
|
|
|