You are not logged in.
This means you
CAN ONLY VIEW reports that were published prior to Thursday, March 20, 2025.
You
MUST UPGRADE YOUR MEMBERSHIP if you want to see any current reports.
AFTER MARKET UPDATE - FRIDAY, SEPTEMBER 22ND, 2017
Previous After Market Report Next After Market Report >>>
|
|
|
|
DOW |
-9.64 |
22,349.59 |
-0.04% |
|
Volume |
722,094,850 |
-1% |
|
Volume |
1,642,461,688 |
-7% |
|
NASDAQ |
+4.23 |
6,426.92 |
+0.07% |
|
Advancers |
1,893 |
65% |
|
Advancers |
1,764 |
65% |
|
S&P 500 |
+1.62 |
2,502.22 |
+0.06% |
|
Decliners |
1,024 |
35% |
|
Decliners |
942 |
35% |
|
Russell 2000 |
+6.60 |
1,450.78 |
+0.46% |
|
52 Wk Highs |
145 |
|
|
52 Wk Highs |
119 |
|
|
S&P 600 |
+5.91 |
874.87 |
+0.68% |
|
52 Wk Lows |
17 |
|
|
52 Wk Lows |
24 |
|
|
 |
Major Indices Remain Perched at Record Highs
Kenneth J. Gruneisen - Passed the CAN SLIM® Master's Exam
For the week, the Dow rose 0.4%, the S&P 500 edged up 0.1% while the Nasdaq lost 0.3%. Stocks were little changed Friday. The Dow was down 10 points to 22349. The S&P 500 was up 2 points to 2502. The Nasdaq Composite added 4 points to close at 6426. Volume totals reported were lighter than the prior session totals on the NYSE and on the Nasdaq exchange. Breadth was positive as advancers led decliners by a 9-5 margin on the NYSE and on the Nasdaq exchange. There were 56 high-ranked companies from the Leaders List that made new 52-week highs and were listed on the BreakOuts Page, versus the total of 57 on the prior session. New 52-week highs totals solidly outnumbered new 52-week lows totals on the Nasdaq exchange and on the NYSE. The Featured Stocks Page provides the latest analysis on noteworthy high-ranked leaders. Charts used courtesy of www.stockcharts.com
 PICTURED: The S&P 500 Index is perched near the record high.
The major averages' (M criteria) uptrend endured recent pressure however leadership has remained healthy. Investors should buy stocks meeting all key criteria of the fact-based investment system on a case-by-case basis as they trigger technical buy signals.
The major averages rebounded from session lows to finish mixed as investors weighed geopolitical concerns. Stocks retreated in early trading as North Korea indicated it may conduct additional nuclear tests following President Trump calling for additional sanctions against the country. On the data front, reports showed manufacturing expanded modestly in September while activity in the service sector slowed.
Telecom and Energy were the best performing sectors in the S&P 500. Sprint (S +6.10%) rose and T-Mobile (TMUS +1.06%) also inched higher on continued reports the companies were in merger talks. Chevron (CVX + 0.70%) rose. Utilities and Real Estate were down the most on the session as Scana (SCG -3.43%) and American Tower (AMT -1.16%) both fell. In earnings news, CarMax (KMX +7.77%) rose after beating consensus estimates. Over in Technology, Apple (AAPL -0.98%) extended its weekly decline, falling on concerns surrounding the new iPhone and Apple Watch.
Treasuries advanced with the benchmark 10-year note up 6/32 to yield 2.26%. In commodities, NYMEX WTI crude gained 0.2% to $50.63/barrel. COMEX gold added 0.4% to $1295.80/ounce. |
 Kenneth J. Gruneisen started out as a licensed stockbroker in August 1987, a couple of months prior to the historic stock market crash that took the Dow Jones Industrial Average down -22.6% in a single day. He has published daily fact-based fundamental and technical analysis on high-ranked stocks online for two decades. Through FACTBASEDINVESTING.COM, Kenneth provides educational articles, news, market commentary, and other information regarding proven investment systems that work in good times and bad.
Comments contained in the body of this report are technical opinions only and are not necessarily those of Gruneisen Growth Corp. The material herein has been obtained from sources believed to be reliable and accurate, however, its accuracy and completeness cannot be guaranteed. Our firm, employees, and customers may effect transactions, including transactions contrary to any recommendation herein, or have positions in the securities mentioned herein or options with respect thereto. Any recommendation contained in this report may not be suitable for all investors and it is not to be deemed an offer or solicitation on our part with respect to the purchase or sale of any securities. |
|
 |
Tech and Commodity-Linked Groups Led Gainers
Kenneth J. Gruneisen - Passed the CAN SLIM® Master's Exam
On Friday the Broker/Dealer Index ($XBD +0.38%) edged higher but the Bank Index ($BKX -0.11%) inched lower. The Retail Index ($RLX +0.10%) inched higher. The tech sector had a positive bias as the Networking Index ($NWX +0.79%) and Semiconductor Index ($SOX +0.50%) both outpaced the Biotechnology Index ($BTK +0.20%). Commodity-linked groups had a positive bias as the Gold & Silver Index ($XAU +1.21%) and Oil Services Index ($OSX +1.29%) both outpaced the Integrated Oil Index ($XOI +0.56%). Charts courtesy www.stockcharts.com
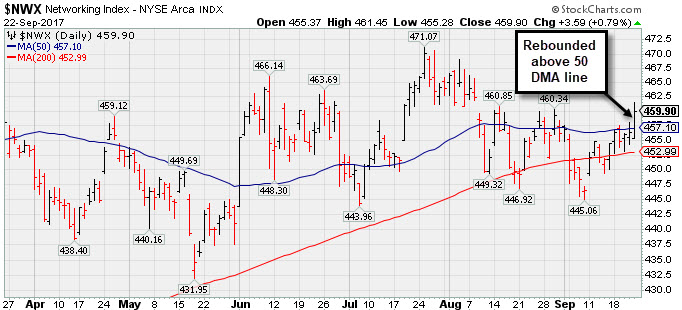 PICTURED: The Networking Index ($NWX +0.79%) rebounded above its 50-day moving average (DMA) line. It found prompt support in recent weeks after briefly undercutting its 200-day moving average (DMA) line.
| Oil Services |
$OSX |
136.24 |
+1.74 |
+1.29% |
-25.87% |
| Integrated Oil |
$XOI |
1,193.19 |
+6.67 |
+0.56% |
-5.90% |
| Semiconductor |
$SOX |
1,149.59 |
+5.72 |
+0.50% |
+26.82% |
| Networking |
$NWX |
459.90 |
+3.59 |
+0.79% |
+3.09% |
| Broker/Dealer |
$XBD |
233.95 |
+0.88 |
+0.38% |
+13.97% |
| Retail |
$RLX |
1,505.73 |
+1.47 |
+0.10% |
+12.12% |
| Gold & Silver |
$XAU |
86.06 |
+1.03 |
+1.21% |
+9.13% |
| Bank |
$BKX |
97.04 |
-0.11 |
-0.11% |
+5.72% |
| Biotech |
$BTK |
4,166.47 |
+8.47 |
+0.20% |
+35.49% |
|
|
|
 |
Quietly Pulling Back From High After More Volume-Driven Gains
Kenneth J. Gruneisen - Passed the CAN SLIM® Master's Exam
Lemaitre Vascular Inc (LMAT -$0.04 or -0.11% to $37.25) has been quietly pulling back from its all-time high following a gain on 9/15/17 backed by above average volume. The 50-day moving average (DMA) line ($34.31) defines near-term support to watch above prior highs in the $33 area. Disciplined investors avoid chasing extended stocks more than +5% above prior highs, and they always limit losses by selling any stock that falls more than -7% from their purchase price. Patient investors may watch for a new base or secondary buy point to possibly develop and be noted in the weeks ahead.
LMAT was highlighted in yellow in the 7/28/17 mid-day report (read here) with new pivot point cited based on its 5/02/17 high plus 10 cents. It triggered a technical buy signal as it powered to a new all-time high after gapping up for a big volume-driven gain following earnings news. It reported earnings +64% on +15% sales revenues for the Jun '17 quarter, Three of the past four quarterly comparisons were above the +25% minimum guideline (C criteria).
LMAT was last shown in this FSU section on 8/28/17 with an annotated graph under the headline. "Volume-Driven Gain for New High And Strong Finish Bode Well". The high-ranked Medical - Products firm was first highlighted in yellow with a pivot point based on its 9/20/16 high plus 10 cents in the 10/27/16 mid-day report (read here).
Its current Up/Down Volume ratio of 1.4 is an unbiased indication that its shares were under some accumulation over the past 50 days. The number of top-rated funds owning its share rose from 184 in Dec '15 to 254 in Jun '17, a reassuring sign concerning the I criteria. Its small supply of 14.5 million shares (S criteria) in the public float can contribute to greater price volatility in the event of institutional buying or selling. |
|
|
Color Codes Explained :
Y - Better candidates highlighted by our
staff of experts.
G - Previously featured
in past reports as yellow but may no longer be buyable under the
guidelines.
***Last / Change / Volume data in this table is the closing quote data***
Symbol/Exchange
Company Name
Industry Group |
PRICE |
CHANGE
(%Change) |
Day High |
Volume
(% DAV)
(% 50 day avg vol) |
52 Wk Hi
% From Hi |
Featured
Date |
Price
Featured |
Pivot Featured |
|
Max Buy |
THO
-
NYSE
Thor Industries Inc
AUTOMOTIVE - Recreational Vehicles
|
$114.94
|
-0.39
-0.34% |
$115.85
|
432,453
84.46% of 50 DAV
50 DAV is 512,000
|
$116.34
-1.20%
|
8/14/2017
|
$106.67
|
PP = $110.01
|
|
MB = $115.51
|
Most Recent Note - 9/18/2017 6:14:05 PM
Y - Quietly touched a new 52-week high but ended the session weak. Current Relative Strength Rating of 79 is just below the 80+ minimum guideline for buy candidates under the fact-based investment system. Very little resistance remains due to overhead supply up to its $115.74 all-time high. See the latest FSU analysis for more details and a new annotated graph.
>>> FEATURED STOCK ARTICLE : Wedged to New High Then Ended the Session Weak - 9/18/2017 |
View all notes |
Set NEW NOTE alert |
Company Profile |
SEC
News |
Chart |
Request a new note
C
A
S
I |
AVGO
-
NASDAQ
Broadcom Limited
ELECTRONICS - Semiconductor - Broad Line
|
$239.24
|
-1.14
-0.47% |
$240.75
|
2,290,355
92.76% of 50 DAV
50 DAV is 2,469,000
|
$259.36
-7.76%
|
8/24/2017
|
$252.44
|
PP = $256.89
|
|
MB = $269.73
|
Most Recent Note - 9/21/2017 4:34:36 PM
G - Raised more concerns today while slumping further below its 50 DMA line ($249) and enduring distributional pressure, and its color code is changed to green. Recent lows define the next important support in the $238-240 area. Subsequent violations would trigger more worrisome technical sell signals. See the latest FSU analysis for more details and a new annotated graph.
>>> FEATURED STOCK ARTICLE : Technical Deterioration Raises Concerns - 9/21/2017 |
View all notes |
Set NEW NOTE alert |
Company Profile |
SEC
News |
Chart |
Request a new note
C
A
S
I |
EW
-
NYSE
Edwards Lifesciences Cp
HEALTH SERVICES - Medical Appliances and Equipment
|
$110.64
|
+0.31
0.28% |
$110.84
|
949,822
72.94% of 50 DAV
50 DAV is 1,302,200
|
$121.75
-9.13%
|
7/11/2017
|
$117.23
|
PP = $121.85
|
|
MB = $127.94
|
Most Recent Note - 9/19/2017 7:06:11 PM
G - A rebound above its downward sloping 50 DMA line ($114.73) is needed for its outlook to improve. Met resistance at its 50 DMA line and it has been pulling back with light volume. It is only -8.6% off its all-time high, but its Relative Strength Rating has slumped to 52, below the 80+ minimum guideline for buy candidates. Fundamentals remain strong.
>>> FEATURED STOCK ARTICLE : Positive Reversal After Slumping to New Lows - 9/6/2017 |
View all notes |
Set NEW NOTE alert |
Company Profile |
SEC
News |
Chart |
Request a new note
C
A
S
I |
STMP
-
NASDAQ
Stamps.com Inc
INTERNET - Internet Software and Services
|
$210.30
|
+1.05
0.50% |
$211.75
|
292,649
64.04% of 50 DAV
50 DAV is 457,000
|
$220.25
-4.52%
|
9/11/2017
|
$193.65
|
PP = $220.35
|
|
MB = $231.37
|
Most Recent Note - 9/18/2017 6:12:15 PM
Y - Gapped up today for a gain with light volume. The new pivot point cited was based on its 8/07/17 high plus 10 cents. Faces some near-term resistance. Subsequent volume-driven gains above the pivot point are needed to trigger a new (or add-on) technical buy signal. Recent low ($185.80 on 9/05/17) and its 50 DMA line ($182.53) define important near-term support where violations would trigger technical sell signals. Fundamentals remain strong.
>>> FEATURED STOCK ARTICLE : New Base Being Built After Considerable Gap Higher - 9/11/2017 |
View all notes |
Set NEW NOTE alert |
Company Profile |
SEC
News |
Chart |
Request a new note
C
A
S
I |
HTHT
-
NASDAQ
China Lodging Group Ads
LEISURE - Lodging
|
$120.36
|
-1.64
-1.34% |
$123.14
|
258,095
72.09% of 50 DAV
50 DAV is 358,000
|
$126.29
-4.70%
|
9/29/2016
|
$46.12
|
PP = $47.82
|
|
MB = $50.21
|
Most Recent Note - 9/19/2017 12:54:27 PM
G - Hitting another new all-time high with today's big volume-driven gain, very extended from any sound base. Recently reported earnings +19% on +18% sales revenues for the Jun '17 quarter, below the +25% minimum earnings guideline (C criteria). Its 50 DMA line ($103) defines near-term support.
>>> FEATURED STOCK ARTICLE : Considerable Rally However Fundamental Concerns Were Raised - 9/12/2017 |
View all notes |
Set NEW NOTE alert |
Company Profile |
SEC
News |
Chart |
Request a new note
C
A
S
I |
Symbol/Exchange
Company Name
Industry Group |
PRICE |
CHANGE
(%Change) |
Day High |
Volume
(% DAV)
(% 50 day avg vol) |
52 Wk Hi
% From Hi |
Featured
Date |
Price
Featured |
Pivot Featured |
|
Max Buy |
LMAT
-
NASDAQ
Lemaitre Vascular Inc
Medical-Products
|
$37.25
|
-0.04
-0.11% |
$37.62
|
108,274
50.13% of 50 DAV
50 DAV is 216,000
|
$39.29
-5.20%
|
7/28/2017
|
$33.50
|
PP = $33.32
|
|
MB = $34.99
|
 Most Recent Note - 9/22/2017 5:51:44 PM
G - Pulled back for a 4th consecutive small loss on light volume. The 50 DMA line ($34.33) defines near-term support to watch above prior highs in the $33 area. See the latest FSU analysis for more details and a new annotated graph.
>>> FEATURED STOCK ARTICLE : Quietly Pulling Back From High After More Volume-Driven Gains - 9/22/2017 |
View all notes |
Set NEW NOTE alert |
Company Profile |
SEC
News |
Chart |
Request a new note
C
A
S
I |
ESNT
-
NYSE
Essent Group Ltd
Finance-MrtgandRel Svc
|
$39.55
|
+0.11
0.28% |
$39.80
|
357,397
51.42% of 50 DAV
50 DAV is 695,000
|
$41.44
-4.56%
|
7/3/2017
|
$38.05
|
PP = $39.60
|
|
MB = $41.58
|
Most Recent Note - 9/18/2017 6:08:14 PM
Y - Color code is changed to yellow after recent gains above its 50 DMA line ($38.50) helped its outlook to improve. Completed a new Public Offering on 8/08/17.
>>> FEATURED STOCK ARTICLE : Undercut 50-Day Moving Average in Slump Toward Prior Lows - 9/5/2017 |
View all notes |
Set NEW NOTE alert |
Company Profile |
SEC
News |
Chart |
Request a new note
C
A
S
I |
OLED
-
NASDAQ
Universal Display Corp
Elec-Misc Products
|
$132.70
|
-3.30
-2.43% |
$135.85
|
894,063
103.84% of 50 DAV
50 DAV is 861,000
|
$145.30
-8.67%
|
8/31/2017
|
$128.22
|
PP = $127.78
|
|
MB = $134.17
|
Most Recent Note - 9/22/2017 3:58:30 PM
Y - Color code is changed to yellow after pulling back below its "max buy" level with today's 3rd consecutive loss. Prior highs in the $127-130 area define initial support to watch on pullbacks.
>>> FEATURED STOCK ARTICLE : Rallied Near Pivot Point But Confirming Gains Are Still Needed - 8/31/2017 |
View all notes |
Set NEW NOTE alert |
Company Profile |
SEC
News |
Chart |
Request a new note
C
A
S
I |
ANET
-
NYSE
Arista Networks Inc
TELECOMMUNICATIONS - Communication Equipment
|
$191.05
|
+3.82
2.04% |
$192.08
|
891,452
108.32% of 50 DAV
50 DAV is 823,000
|
$188.85
1.16%
|
8/4/2017
|
$173.31
|
PP = $163.07
|
|
MB = $171.22
|
Most Recent Note - 9/19/2017 7:02:46 PM
G - Perched near its all-time high following additional volume-driven gains after stubbornly holding its ground in recent weeks. Its 50 DMA line ($166) and prior highs in the $162 area define important near-term support to watch on pullbacks. Fundamentals remain very strong. See the latest FSU analysis for more details and a new annotated graph.
>>> FEATURED STOCK ARTICLE : Extended From Any Sound Base After Additional Volume-Driven Gains - 9/19/2017 |
View all notes |
Set NEW NOTE alert |
Company Profile |
SEC
News |
Chart |
Request a new note
C
A
S
I |
GRUB
-
NYSE
Grubhub Inc
COMPUTER SOFTWARE and SERVICES - Technical and System Software
|
$51.69
|
-1.82
-3.40% |
$53.03
|
3,516,314
189.66% of 50 DAV
50 DAV is 1,854,000
|
$57.61
-10.28%
|
6/21/2017
|
$47.33
|
PP = $46.94
|
|
MB = $49.29
|
Most Recent Note - 9/22/2017 12:13:07 PM
G - Gapped down today violating its 50 DMA line ($52.30) then found prompt support, rebounding near that important short-term average. More damaging losses would raise greater concerns. The next near-term support is prior highs in the $47 area. Recently reported earnings +13% on +32% sales revenues for the Jun '17 quarter, below the +25% minimum earnings guideline (C criteria) raising fundamental concerns.
>>> FEATURED STOCK ARTICLE : Touched New High With Quiet Gain From Brief Consolidation - 9/7/2017 |
View all notes |
Set NEW NOTE alert |
Company Profile |
SEC
News |
Chart |
Request a new note
C
A
S
I |
Symbol/Exchange
Company Name
Industry Group |
PRICE |
CHANGE
(%Change) |
Day High |
Volume
(% DAV)
(% 50 day avg vol) |
52 Wk Hi
% From Hi |
Featured
Date |
Price
Featured |
Pivot Featured |
|
Max Buy |
IBP
-
NYSE
Installed Building Prod
DIVERSIFIED SERVICES - Business/Management Services
|
$59.95
|
+0.05
0.08% |
$60.00
|
122,615
98.88% of 50 DAV
50 DAV is 124,000
|
$60.08
-0.21%
|
9/19/2017
|
$59.15
|
PP = $60.10
|
|
MB = $63.11
|
Most Recent Note - 9/19/2017 1:02:46 PM
Y - New pivot point is cited based on its 8/04/17 high plus 10 cents. Subsequent volume-driven gains for new highs may trigger a new (or add-on) technical buy signal. Perched within close striking distance of its all-time high after finding support near its 50 DMA line ($55.50) and prior highs.
>>> FEATURED STOCK ARTICLE : Found Prompt Support Near Prior Highs and 50 Day Average - 9/13/2017 |
View all notes |
Set NEW NOTE alert |
Company Profile |
SEC
News |
Chart |
Request a new note
C
A
S
I |
NCOM
-
NASDAQ
National Commerce Corp
BANKING - Regional - Southeast Banks
|
$40.50
|
+0.00
0.00% |
$40.65
|
57,953
186.95% of 50 DAV
50 DAV is 31,000
|
$41.25
-1.82%
|
4/25/2017
|
$38.95
|
PP = $40.09
|
|
MB = $42.09
|
Most Recent Note - 9/22/2017 12:25:08 PM
G - Trading above its 50 DMA line ($39.79) and its Relative Strength rating is currently 81, above the minimum guideline for buy candidates. Recently reported Jun '17 earnings +23% on +45% sales revenues, below the +25% minimum earnings guideline (C criteria), raising fundamental concerns.
>>> FEATURED STOCK ARTICLE : Relative Strength Rating Fell Below 80+ Minimum Guideline - 9/14/2017 |
View all notes |
Set NEW NOTE alert |
Company Profile |
SEC
News |
Chart |
Request a new note
C
A
S
I |
OLLI
-
NASDAQ
Ollie's Bargain Outlet
Retail-DiscountandVariety
|
$45.80
|
+0.20
0.44% |
$46.03
|
491,075
88.80% of 50 DAV
50 DAV is 553,000
|
$46.25
-0.97%
|
9/8/2017
|
$45.20
|
PP = $46.18
|
|
MB = $48.49
|
Most Recent Note - 9/21/2017 4:02:19 PM
Y - Stubbornly holding its ground, still quietly hovering near its all-time high. New pivot point cited was based on its 8/01/17 high plus 10 cents. Recent gains above the 50 DMA line helped its outlook improve. Subsequent gains above the latest pivot point with at least the minimum +40% above average volume may trigger a proper new (or add-on) technical buy signal. Fundamentals remain strong.
>>> FEATURED STOCK ARTICLE : New Pivot Point Cited After Rebound From Below 50-Day Average - 9/8/2017 |
View all notes |
Set NEW NOTE alert |
Company Profile |
SEC
News |
Chart |
Request a new note
C
A
S
I |
HLI
-
NYSE
Houlihan Lokey Inc Cl A
Finance-Invest Bnk/Bkrs
|
$38.07
|
-0.21
-0.55% |
$38.33
|
143,583
61.89% of 50 DAV
50 DAV is 232,000
|
$39.68
-4.06%
|
9/18/2017
|
$37.04
|
PP = $39.78
|
|
MB = $41.77
|
Most Recent Note - 9/18/2017 6:26:48 PM
Y - A new pivot point is cited based on its 7/26/17 plus 10 cents. Subsequent volume-driven gains for new highs may trigger a new (or add-on) technical buy signal. Consolidating above its 50 DMA line ($36.32). Subsequent losses below the recent low ($34.41 on 8/18/17) would raise more serious concerns and trigger a technical sell signal.
>>> FEATURED STOCK ARTICLE : Consolidating Near 50-Day Moving Average - 8/29/2017 |
View all notes |
Set NEW NOTE alert |
Company Profile |
SEC
News |
Chart |
Request a new note
C
A
S
I |
|
|
|
THESE ARE NOT BUY RECOMMENDATIONS!
Comments contained in the body of this report are technical
opinions only. The material herein has been obtained
from sources believed to be reliable and accurate, however,
its accuracy and completeness cannot be guaranteed.
This site is not an investment advisor, hence it does
not endorse or recommend any securities or other investments.
Any recommendation contained in this report may not
be suitable for all investors and it is not to be deemed
an offer or solicitation on our part with respect to
the purchase or sale of any securities. All trademarks,
service marks and trade names appearing in this report
are the property of their respective owners, and are
likewise used for identification purposes only.
This report is a service available
only to active Paid Premium Members.
You may opt-out of receiving report notifications
at any time. Questions or comments may be submitted
by writing to Premium Membership Services 665 S.E. 10 Street, Suite 201 Deerfield Beach, FL 33441-5634 or by calling 1-800-965-8307
or 954-785-1121.
|
|
|


