You are not logged in.
This means you
CAN ONLY VIEW reports that were published prior to Thursday, March 20, 2025.
You
MUST UPGRADE YOUR MEMBERSHIP if you want to see any current reports.
AFTER MARKET UPDATE - MONDAY, SEPTEMBER 25TH, 2017
Previous After Market Report Next After Market Report >>>
|
|
|
|
DOW |
-53.50 |
22,296.09 |
-0.24% |
|
Volume |
842,279,570 |
+17% |
|
Volume |
2,060,596,570 |
+25% |
|
NASDAQ |
-56.33 |
6,370.59 |
-0.88% |
|
Advancers |
1,648 |
56% |
|
Advancers |
1,282 |
44% |
|
S&P 500 |
-5.56 |
2,496.66 |
-0.22% |
|
Decliners |
1,275 |
44% |
|
Decliners |
1,618 |
56% |
|
Russell 2000 |
+1.18 |
1,451.96 |
+0.08% |
|
52 Wk Highs |
128 |
|
|
52 Wk Highs |
113 |
|
|
S&P 600 |
+2.43 |
877.30 |
+0.28% |
|
52 Wk Lows |
13 |
|
|
52 Wk Lows |
28 |
|
|
 |
Major Indices Encounter More Distributional Pressure
Kenneth J. Gruneisen - Passed the CAN SLIM® Master's Exam
Stocks finished lower Monday. The Dow fell 54 points to 22296. The S&P 500 declined 6 points to 2496. The Nasdaq Composite slumped 56 points to close at 6370. Volume totals reported were higher than the prior session totals on the NYSE and on the Nasdaq exchange. Breadth was mixed as advancers led decliners by a 4-3 margin on the NYSE but decliners led advancers by nearly 4-3 on the Nasdaq exchange. There were 40 high-ranked companies from the Leaders List that made new 52-week highs and were listed on the BreakOuts Page, versus the total of 56 on the prior session. New 52-week highs totals solidly outnumbered new 52-week lows totals on the Nasdaq exchange and on the NYSE. The Featured Stocks Page provides the latest analysis on noteworthy high-ranked leaders. Charts used courtesy of www.stockcharts.com
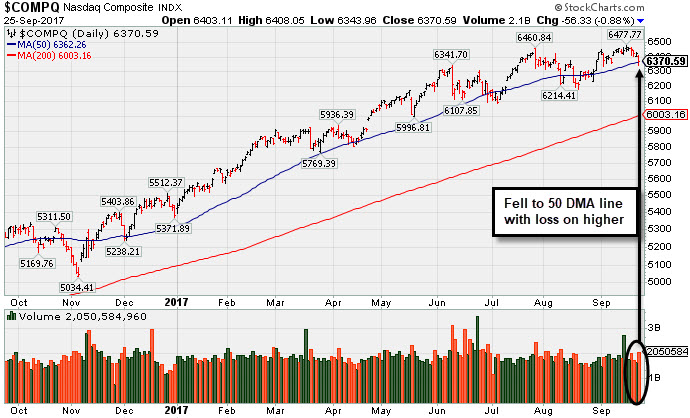 PICTURED: The Nasdaq Composite Index pulled back on higher volume, a sign of distributional pressure, testing its 50-day moving average (DMA) line yet again.
The major averages' (M criteria) uptrend endured recent pressure however leadership has remained healthy. Investors should buy stocks meeting all key criteria of the fact-based investment system on a case-by-case basis as they trigger technical buy signals.
The major averages retreated after last week’s advance amid heightened geopolitical concerns. Stocks fell after North Korea’s foreign minister said recent comments by President Trump were akin to declaring war. Investor attention was also on Republican attempts at health care and tax reforms. On the Fed front, New York Regional President William Dudley indicated the central bank remains on track to gradually raise interest rates as temporary factors muting inflation appear to be fading.
Technology was the biggest contributor to the market’s retreat. Facebook (FB -4.50%) violated its 50-day moving average (DMA) line after the company scrapped plans to issue a new share class. Apple (AAPL -0.88%) extended its recent slide. Chipmakers Advanced Micro Devices (AMD -5.19%) and Nvidia (NVDA -4.47%) fell after Intel (INTC -0.05%) introduced a new desktop processor that enhances PC gaming. Energy was the best performing group on the session. Hess (HES+3.60%) and Exxon (XOM +1.33%) rose as oil prices climbed to a five month high.
Treasuries rose with the yield on the benchmark 10-year note down 3 basis points to 2.22%. In commodities, NYMEX WTI crude rallied 3.1% to $52.22/barrel on OPEC reiterating its commitment to production cuts last week. COMEX gold rose 1.3% to $1309.80/ounce. |
 Kenneth J. Gruneisen started out as a licensed stockbroker in August 1987, a couple of months prior to the historic stock market crash that took the Dow Jones Industrial Average down -22.6% in a single day. He has published daily fact-based fundamental and technical analysis on high-ranked stocks online for two decades. Through FACTBASEDINVESTING.COM, Kenneth provides educational articles, news, market commentary, and other information regarding proven investment systems that work in good times and bad.
Comments contained in the body of this report are technical opinions only and are not necessarily those of Gruneisen Growth Corp. The material herein has been obtained from sources believed to be reliable and accurate, however, its accuracy and completeness cannot be guaranteed. Our firm, employees, and customers may effect transactions, including transactions contrary to any recommendation herein, or have positions in the securities mentioned herein or options with respect thereto. Any recommendation contained in this report may not be suitable for all investors and it is not to be deemed an offer or solicitation on our part with respect to the purchase or sale of any securities. |
|
 |
Commodity-Linked Groups and Biotech Index Rose
Kenneth J. Gruneisen - Passed the CAN SLIM® Master's Exam
On Monday the Broker/Dealer Index ($XBD -0.34%) and the Bank Index ($BKX -0.27%) both edged lower along with the Retail Index ($RLX -0.45%). The tech sector was mixed as the Semiconductor Index ($SOX -1.96%) outpaced the Networking Index ($NWX -0.59%) to the downside and the Biotechnology Index ($BTK +0.38%) posted a small gain. Commodity-linked groups had a positive bias as the Gold & Silver Index ($XAU +1.37%), Oil Services Index ($OSX +2.83%) and the Integrated Oil Index ($XOI +1.36%) posted unanimous gains. Charts courtesy www.stockcharts.com
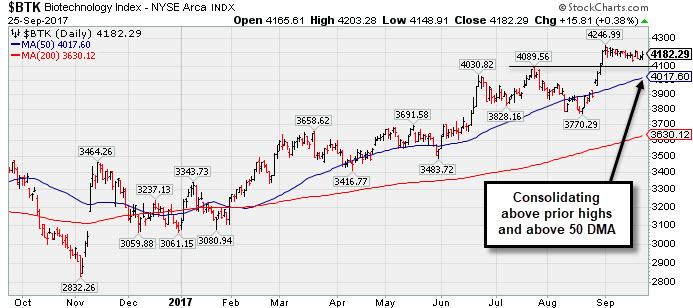 PICTURED: The Biotechnology Index ($BTK +0.38%) is consolidating above prior highs and above its 50-day moving average (DMA) line.
| Oil Services |
$OSX |
139.95 |
+3.71 |
+2.72% |
-23.85% |
| Integrated Oil |
$XOI |
1,209.36 |
+16.17 |
+1.36% |
-4.62% |
| Semiconductor |
$SOX |
1,126.94 |
-22.65 |
-1.97% |
+24.32% |
| Networking |
$NWX |
457.17 |
-2.73 |
-0.59% |
+2.48% |
| Broker/Dealer |
$XBD |
233.16 |
-0.80 |
-0.34% |
+13.58% |
| Retail |
$RLX |
1,498.99 |
-6.74 |
-0.45% |
+11.62% |
| Gold & Silver |
$XAU |
87.42 |
+1.36 |
+1.58% |
+10.85% |
| Bank |
$BKX |
96.78 |
-0.26 |
-0.27% |
+5.44% |
| Biotech |
$BTK |
4,182.29 |
+15.81 |
+0.38% |
+36.01% |
|
|
|
 |
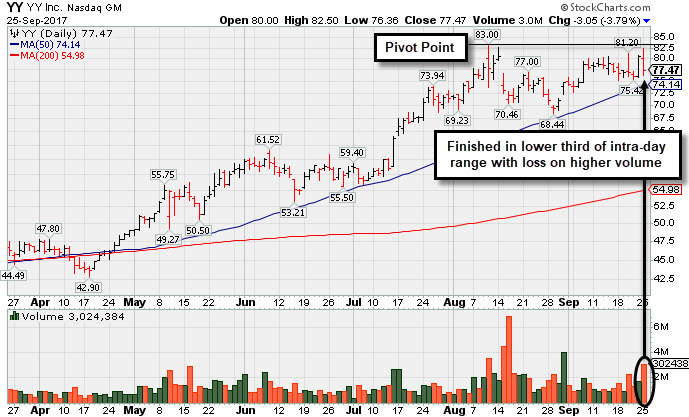
Encountered Distributional Pressure When Challenging Prior HIgh
Kenneth J. Gruneisen - Passed the CAN SLIM® Master's Exam
YY Inc (YY -$3.05 or -3.79% to $77.47) encountered distributional pressure and ended in the lower third of its intra-day range with a loss on above average volume. It was highlighted in yellow with a pivot point cited based on its 8/10/17 high plus 10 cents in the earlier mid-day report (read here). Subsequent gains as the stock rallies above its pivot point with volume more than +40%above average may trigger a convincing technical buy signal.
This Chinese Internet - Content firm found support in recent weeks above its 50-day moving average (DMA) line and rebounded to challenge its 52-week high. Jun '17 quarterly earnings +53% on +29% sales revenues marked its 4th consecutive strong quarterly report above the +25% minimum (C criteria). Its annual earnings (A criteria) history has been strong especially since its $11 IPO on 11/21/12.
The number of top-rated funds owning its shares rose from 268 in Sep '16 to 346 in Jun '17, a reassuring sign concerning the I criteria. It completed a new Public Offering on 8/16/17. |
|
|
Color Codes Explained :
Y - Better candidates highlighted by our
staff of experts.
G - Previously featured
in past reports as yellow but may no longer be buyable under the
guidelines.
***Last / Change / Volume data in this table is the closing quote data***
Symbol/Exchange
Company Name
Industry Group |
PRICE |
CHANGE
(%Change) |
Day High |
Volume
(% DAV)
(% 50 day avg vol) |
52 Wk Hi
% From Hi |
Featured
Date |
Price
Featured |
Pivot Featured |
|
Max Buy |
THO
-
NYSE
Thor Industries Inc
AUTOMOTIVE - Recreational Vehicles
|
$117.05
|
+2.11
1.84% |
$117.45
|
678,437
131.74% of 50 DAV
50 DAV is 515,000
|
$116.34
0.61%
|
8/14/2017
|
$106.67
|
PP = $110.01
|
|
MB = $115.51
|
 Most Recent Note - 9/25/2017 3:18:55 PM
Y - Quietly hitting a new 52-week high today. Current Relative Strength Rating of 81 is above the 80+ minimum guideline for buy candidates under the fact-based investment system. Due to report Jul '17 quarterly earnings news on 9/27/17, and volume and volatility often increase near earnings news.
>>> FEATURED STOCK ARTICLE : Wedged to New High Then Ended the Session Weak - 9/18/2017 |
View all notes |
Set NEW NOTE alert |
Company Profile |
SEC
News |
Chart |
Request a new note
C
A
S
I |
AVGO
-
NASDAQ
Avago Technologies Ltd
ELECTRONICS - Semiconductor - Broad Line
|
$235.51
|
-3.73
-1.56% |
$237.81
|
3,868,063
156.28% of 50 DAV
50 DAV is 2,475,100
|
$259.36
-9.20%
|
8/24/2017
|
$252.44
|
PP = $256.89
|
|
MB = $269.73
|
Most Recent Note - 9/21/2017 4:34:36 PM
G - Raised more concerns today while slumping further below its 50 DMA line ($249) and enduring distributional pressure, and its color code is changed to green. Recent lows define the next important support in the $238-240 area. Subsequent violations would trigger more worrisome technical sell signals. See the latest FSU analysis for more details and a new annotated graph.
>>> FEATURED STOCK ARTICLE : Technical Deterioration Raises Concerns - 9/21/2017 |
View all notes |
Set NEW NOTE alert |
Company Profile |
SEC
News |
Chart |
Request a new note
C
A
S
I |
EW
-
NYSE
Edwards Lifesciences Cp
HEALTH SERVICES - Medical Appliances and Equipment
|
$110.46
|
-0.18
-0.16% |
$110.76
|
858,876
66.12% of 50 DAV
50 DAV is 1,299,000
|
$121.75
-9.27%
|
7/11/2017
|
$117.23
|
PP = $121.85
|
|
MB = $127.94
|
Most Recent Note - 9/19/2017 7:06:11 PM
G - A rebound above its downward sloping 50 DMA line ($114.73) is needed for its outlook to improve. Met resistance at its 50 DMA line and it has been pulling back with light volume. It is only -8.6% off its all-time high, but its Relative Strength Rating has slumped to 52, below the 80+ minimum guideline for buy candidates. Fundamentals remain strong.
>>> FEATURED STOCK ARTICLE : Positive Reversal After Slumping to New Lows - 9/6/2017 |
View all notes |
Set NEW NOTE alert |
Company Profile |
SEC
News |
Chart |
Request a new note
C
A
S
I |
YY
-
NASDAQ
YY Inc Ads
INTERNET - Internet Service Providers
|
$77.47
|
-3.05
-3.79% |
$82.50
|
3,023,984
179.57% of 50 DAV
50 DAV is 1,684,000
|
$83.00
-6.66%
|
9/25/2017
|
$80.26
|
PP = $83.10
|
|
MB = $87.26
|
Most Recent Note - 9/25/2017 6:13:08 PM
Y - Encountered distributional pressure today, finishing with a loss on higher volume after highlighted in yellow with a pivot point cited based on its 8/10/17 high plus 10 cents in the mid-day report. Subsequent volume-driven gains for new highs may trigger a technical buy signal. This Chinese Internet - Content firm found support in recent weeks above its 50 DMA line and rebounded to challenge its 52-week high. Completed a new Public Offering on 8/16/17. Reported Jun '17 quarterly earnings +53% on +29% sales revenues, its 4th consecutive strong quarterly report above the +25% minimum (C criteria). See the latest FSU analysis for more details and a new annotated graph.
>>> FEATURED STOCK ARTICLE : Perched at High After Triggering Technical Buy Signal - 9/5/2014 |
View all notes |
Set NEW NOTE alert |
Company Profile |
SEC
News |
Chart |
Request a new note
C
A
S
I |
STMP
-
NASDAQ
Stamps.com Inc
INTERNET - Internet Software and Services
|
$205.15
|
-5.15
-2.45% |
$212.65
|
378,269
82.95% of 50 DAV
50 DAV is 456,000
|
$220.25
-6.86%
|
9/11/2017
|
$193.65
|
PP = $220.35
|
|
MB = $231.37
|
Most Recent Note - 9/25/2017 3:12:34 PM
Y - Reversed into the red today after 6 consecutive gains marked by light volume. The new pivot point cited was based on its 8/07/17 high plus 10 cents. Faces some near-term resistance. Subsequent volume-driven gains above the pivot point are needed to trigger a new (or add-on) technical buy signal. Recent low ($185.80 on 9/05/17) and its 50 DMA line ($188) define important near-term support where violations would trigger technical sell signals. Fundamentals remain strong.
>>> FEATURED STOCK ARTICLE : New Base Being Built After Considerable Gap Higher - 9/11/2017 |
View all notes |
Set NEW NOTE alert |
Company Profile |
SEC
News |
Chart |
Request a new note
C
A
S
I |
Symbol/Exchange
Company Name
Industry Group |
PRICE |
CHANGE
(%Change) |
Day High |
Volume
(% DAV)
(% 50 day avg vol) |
52 Wk Hi
% From Hi |
Featured
Date |
Price
Featured |
Pivot Featured |
|
Max Buy |
HTHT
-
NASDAQ
China Lodging Group Ads
LEISURE - Lodging
|
$116.70
|
-3.66
-3.04% |
$120.86
|
327,899
91.34% of 50 DAV
50 DAV is 359,000
|
$126.29
-7.59%
|
9/29/2016
|
$46.12
|
PP = $47.82
|
|
MB = $50.21
|
Most Recent Note - 9/25/2017 3:13:42 PM
G - Pulling back from its all-time high with today's 4th consecutive loss, still very extended from any sound base. Recently reported earnings +19% on +18% sales revenues for the Jun '17 quarter, below the +25% minimum earnings guideline (C criteria). Its 50 DMA line ($106.51) defines near-term support.
>>> FEATURED STOCK ARTICLE : Considerable Rally However Fundamental Concerns Were Raised - 9/12/2017 |
View all notes |
Set NEW NOTE alert |
Company Profile |
SEC
News |
Chart |
Request a new note
C
A
S
I |
LMAT
-
NASDAQ
Lemaitre Vascular Inc
Medical-Products
|
$36.97
|
-0.28
-0.75% |
$37.52
|
172,971
81.21% of 50 DAV
50 DAV is 213,000
|
$39.29
-5.91%
|
7/28/2017
|
$33.50
|
PP = $33.32
|
|
MB = $34.99
|
Most Recent Note - 9/22/2017 5:51:44 PM
G - Pulled back for a 4th consecutive small loss on light volume. The 50 DMA line ($34.33) defines near-term support to watch above prior highs in the $33 area. See the latest FSU analysis for more details and a new annotated graph.
>>> FEATURED STOCK ARTICLE : Quietly Pulling Back From High After More Volume-Driven Gains - 9/22/2017 |
View all notes |
Set NEW NOTE alert |
Company Profile |
SEC
News |
Chart |
Request a new note
C
A
S
I |
ESNT
-
NYSE
Essent Group Ltd
Finance-MrtgandRel Svc
|
$38.99
|
-0.56
-1.42% |
$39.45
|
368,445
53.01% of 50 DAV
50 DAV is 695,000
|
$41.44
-5.91%
|
7/3/2017
|
$38.05
|
PP = $39.60
|
|
MB = $41.58
|
Most Recent Note - 9/25/2017 3:15:18 PM
Y - Still quietly consolidating just above its 50 DMA line ($38.57), and little resistance remains due to overhead supply. Completed a new Public Offering on 8/08/17.
>>> FEATURED STOCK ARTICLE : Undercut 50-Day Moving Average in Slump Toward Prior Lows - 9/5/2017 |
View all notes |
Set NEW NOTE alert |
Company Profile |
SEC
News |
Chart |
Request a new note
C
A
S
I |
OLED
-
NASDAQ
Universal Display Corp
Elec-Misc Products
|
$124.95
|
-7.75
-5.84% |
$131.70
|
1,439,460
166.80% of 50 DAV
50 DAV is 863,000
|
$145.30
-14.01%
|
8/31/2017
|
$128.22
|
PP = $127.78
|
|
MB = $134.17
|
Most Recent Note - 9/25/2017 12:35:44 PM
Y - Today's 4th consecutive loss with volume running at an above average pace is raising concerns while undercutting prior highs in the $127-130 area. Its 50 DMA line ($122.07) defines the next important support to watch.
>>> FEATURED STOCK ARTICLE : Rallied Near Pivot Point But Confirming Gains Are Still Needed - 8/31/2017 |
View all notes |
Set NEW NOTE alert |
Company Profile |
SEC
News |
Chart |
Request a new note
C
A
S
I |
ANET
-
NYSE
Arista Networks Inc
TELECOMMUNICATIONS - Communication Equipment
|
$180.83
|
-10.22
-5.35% |
$193.24
|
1,274,449
152.81% of 50 DAV
50 DAV is 834,000
|
$192.08
-5.86%
|
8/4/2017
|
$173.31
|
PP = $163.07
|
|
MB = $171.22
|
Most Recent Note - 9/25/2017 3:10:58 PM
G - Reversed into the red today after hitting yet another new all-time high. extended from any sound base and its 50 DMA line ($168.75) defines important near-term support to watch. Fundamentals remain very strong.
>>> FEATURED STOCK ARTICLE : Extended From Any Sound Base After Additional Volume-Driven Gains - 9/19/2017 |
View all notes |
Set NEW NOTE alert |
Company Profile |
SEC
News |
Chart |
Request a new note
C
A
S
I |
Symbol/Exchange
Company Name
Industry Group |
PRICE |
CHANGE
(%Change) |
Day High |
Volume
(% DAV)
(% 50 day avg vol) |
52 Wk Hi
% From Hi |
Featured
Date |
Price
Featured |
Pivot Featured |
|
Max Buy |
GRUB
-
NYSE
Grubhub Inc
COMPUTER SOFTWARE and SERVICES - Technical and System Software
|
$51.69
|
+0.00
0.00% |
$51.79
|
1,374,828
72.74% of 50 DAV
50 DAV is 1,890,000
|
$57.61
-10.28%
|
6/21/2017
|
$47.33
|
PP = $46.94
|
|
MB = $49.29
|
Most Recent Note - 9/22/2017 12:13:07 PM
G - Gapped down today violating its 50 DMA line ($52.30) then found prompt support, rebounding near that important short-term average. More damaging losses would raise greater concerns. The next near-term support is prior highs in the $47 area. Recently reported earnings +13% on +32% sales revenues for the Jun '17 quarter, below the +25% minimum earnings guideline (C criteria) raising fundamental concerns.
>>> FEATURED STOCK ARTICLE : Touched New High With Quiet Gain From Brief Consolidation - 9/7/2017 |
View all notes |
Set NEW NOTE alert |
Company Profile |
SEC
News |
Chart |
Request a new note
C
A
S
I |
IBP
-
NYSE
Installed Building Prod
DIVERSIFIED SERVICES - Business/Management Services
|
$59.80
|
-0.15
-0.25% |
$60.00
|
218,796
175.04% of 50 DAV
50 DAV is 125,000
|
$60.08
-0.46%
|
9/19/2017
|
$59.15
|
PP = $60.10
|
|
MB = $63.11
|
Most Recent Note - 9/25/2017 5:51:26 PM
Y - Churned above average volume today without making price progress, encountering distributional pressure at its all-time high. Its 50 DMA line ($56.12) and prior highs in the $55 area define important support to watch on pullbacks. New pivot point cited was based on its 8/04/17 high plus 10 cents. Subsequent volume-driven gains for new highs may trigger a new (or add-on) technical buy signal.
>>> FEATURED STOCK ARTICLE : Found Prompt Support Near Prior Highs and 50 Day Average - 9/13/2017 |
View all notes |
Set NEW NOTE alert |
Company Profile |
SEC
News |
Chart |
Request a new note
C
A
S
I |
NCOM
-
NASDAQ
National Commerce Corporation
BANKING - Regional - Southeast Banks
|
$40.70
|
+0.20
0.49% |
$40.70
|
52,940
162.89% of 50 DAV
50 DAV is 32,500
|
$41.25
-1.33%
|
4/25/2017
|
$38.95
|
PP = $40.09
|
|
MB = $42.09
|
Most Recent Note - 9/25/2017 12:31:03 PM
G - Trading above its 50 DMA line ($39.80) and still perched near its 52-week high. Relative Strength rating is currently 79, just below the 80+ minimum guideline for buy candidates. Recently reported Jun '17 earnings +23% on +45% sales revenues, below the +25% minimum earnings guideline (C criteria), raising fundamental concerns.
>>> FEATURED STOCK ARTICLE : Relative Strength Rating Fell Below 80+ Minimum Guideline - 9/14/2017 |
View all notes |
Set NEW NOTE alert |
Company Profile |
SEC
News |
Chart |
Request a new note
C
A
S
I |
OLLI
-
NASDAQ
Ollie's Bargain Outlet
Retail-DiscountandVariety
|
$45.05
|
-0.75
-1.64% |
$45.75
|
859,817
155.48% of 50 DAV
50 DAV is 553,000
|
$46.25
-2.59%
|
9/8/2017
|
$45.20
|
PP = $46.18
|
|
MB = $48.49
|
Most Recent Note - 9/21/2017 4:02:19 PM
Y - Stubbornly holding its ground, still quietly hovering near its all-time high. New pivot point cited was based on its 8/01/17 high plus 10 cents. Recent gains above the 50 DMA line helped its outlook improve. Subsequent gains above the latest pivot point with at least the minimum +40% above average volume may trigger a proper new (or add-on) technical buy signal. Fundamentals remain strong.
>>> FEATURED STOCK ARTICLE : New Pivot Point Cited After Rebound From Below 50-Day Average - 9/8/2017 |
View all notes |
Set NEW NOTE alert |
Company Profile |
SEC
News |
Chart |
Request a new note
C
A
S
I |
HLI
-
NYSE
Houlihan Lokey Inc Cl A
Finance-Invest Bnk/Bkrs
|
$37.51
|
-0.56
-1.47% |
$38.09
|
108,276
46.67% of 50 DAV
50 DAV is 232,000
|
$39.68
-5.47%
|
9/18/2017
|
$37.04
|
PP = $39.78
|
|
MB = $41.77
|
Most Recent Note - 9/25/2017 3:16:20 PM
Y - While consolidating above its 50 DMA line ($36.42) a new pivot point was cited based on its 7/26/17 plus 10 cents. Subsequent volume-driven gains for new highs may trigger a new (or add-on) technical buy signal. Subsequent losses below the recent low ($34.41 on 8/18/17) would raise more serious concerns and trigger a technical sell signal.
>>> FEATURED STOCK ARTICLE : Consolidating Near 50-Day Moving Average - 8/29/2017 |
View all notes |
Set NEW NOTE alert |
Company Profile |
SEC
News |
Chart |
Request a new note
C
A
S
I |
Symbol/Exchange
Company Name
Industry Group |
PRICE |
CHANGE
(%Change) |
Day High |
Volume
(% DAV)
(% 50 day avg vol) |
52 Wk Hi
% From Hi |
Featured
Date |
Price
Featured |
Pivot Featured |
|
Max Buy |
|
|
|
THESE ARE NOT BUY RECOMMENDATIONS!
Comments contained in the body of this report are technical
opinions only. The material herein has been obtained
from sources believed to be reliable and accurate, however,
its accuracy and completeness cannot be guaranteed.
This site is not an investment advisor, hence it does
not endorse or recommend any securities or other investments.
Any recommendation contained in this report may not
be suitable for all investors and it is not to be deemed
an offer or solicitation on our part with respect to
the purchase or sale of any securities. All trademarks,
service marks and trade names appearing in this report
are the property of their respective owners, and are
likewise used for identification purposes only.
This report is a service available
only to active Paid Premium Members.
You may opt-out of receiving report notifications
at any time. Questions or comments may be submitted
by writing to Premium Membership Services 665 S.E. 10 Street, Suite 201 Deerfield Beach, FL 33441-5634 or by calling 1-800-965-8307
or 954-785-1121.
|
|
|