You are not logged in.
This means you
CAN ONLY VIEW reports that were published prior to Thursday, March 20, 2025.
You
MUST UPGRADE YOUR MEMBERSHIP if you want to see any current reports.
AFTER MARKET UPDATE - THURSDAY, SEPTEMBER 28TH, 2017
Previous After Market Report Next After Market Report >>>
|
|
|
|
DOW |
+40.49 |
22,381.20 |
+0.18% |
|
Volume |
767,134,830 |
-8% |
|
Volume |
1,874,358,100 |
-8% |
|
NASDAQ |
+0.19 |
6,453.45 |
+0.00% |
|
Advancers |
1,733 |
59% |
|
Advancers |
1,526 |
57% |
|
S&P 500 |
+3.02 |
2,510.06 |
+0.12% |
|
Decliners |
1,182 |
41% |
|
Decliners |
1,144 |
43% |
|
Russell 2000 |
+3.97 |
1,488.79 |
+0.27% |
|
52 Wk Highs |
146 |
|
|
52 Wk Highs |
214 |
|
|
S&P 600 |
+2.37 |
901.95 |
+0.26% |
|
52 Wk Lows |
14 |
|
|
52 Wk Lows |
25 |
|
|
 |
Breadth Positive as Indices Remain Near Record Highs
Kenneth J. Gruneisen - Passed the CAN SLIM® Master's Exam
Stocks traded in a narrow range on Thursday. The Dow gained 40 points to 22381. The S&P added 3 points to 2508. The Nasdaq Composite finished flat at 6453. Volume totals reported were lighter than the prior session totals on the NYSE and on the Nasdaq exchange. Breadth was positive as advancers led decliners by a 3-2 margin on the NYSE and by a 4-3 margin on the Nasdaq exchange. There were 84 high-ranked companies from the Leaders List that made new 52-week highs and were listed on the BreakOuts Page, versus the total of 120 on the prior session. New 52-week highs totals outnumbered new 52-week lows totals on the Nasdaq exchange and on the NYSE. The Featured Stocks Page provides the latest analysis on noteworthy high-ranked leaders. Charts used courtesy of www.stockcharts.com
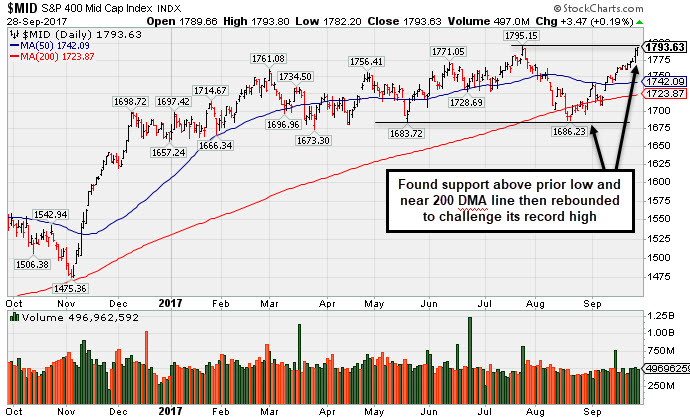 PICTURED: The S&P 400 Mid-Cap Index has rebounded near its record high. In mid-August it found support above the prior low and near its 200-day moving average (DMA) line.
The major averages' (M criteria) uptrend endured recent pressure however leadership has remained healthy. Investors should buy stocks meeting all key criteria of the fact-based investment system on a case-by-case basis as they trigger technical buy signals.
Major averages were little changed as investors digested the GOP tax reform outline, including measures to reduce the number of tax brackets, and cut the corporate tax rate. The Russell 2000 index hit an all-time high on optimism that small-cap companies could see an outsized benefit from the plan. On the data front, second-quarter GDP was revised to show a 3.1% annualized increase from the previously reported 3.0%. A separate report showed weekly jobless claims rose to 272,000, slightly above consensus estimates.
Nine of 11 S&P 500 sectors were positive on the day. In Healthcare news, AbbVie (ABBV +4.97%) rose on reports the company settled a patent dispute with Amgen (AMGN +0.31%). In earnings, spice maker McCormick (MKC +5.39%) rose on its improved full-year outlook. ConAgra (CAG +1.83%) rose after topping consensus sales estimates. McDonalds (MCD +2.23%) on favorable analyst commentary.
Treasuries prices finished the day slightly lower, with the yield on the benchmark 10-year note unchanged at 2.30%. In commodities, NYMEX WTI crude slipped 1.1% to $51.59/barrel. COMEX gold finished up 0.1% to $1285.50/ounce. In FOREX the U.S. dollar index was off 0.2% following its best three day gain of 2017. |
 Kenneth J. Gruneisen started out as a licensed stockbroker in August 1987, a couple of months prior to the historic stock market crash that took the Dow Jones Industrial Average down -22.6% in a single day. He has published daily fact-based fundamental and technical analysis on high-ranked stocks online for two decades. Through FACTBASEDINVESTING.COM, Kenneth provides educational articles, news, market commentary, and other information regarding proven investment systems that work in good times and bad.
Comments contained in the body of this report are technical opinions only and are not necessarily those of Gruneisen Growth Corp. The material herein has been obtained from sources believed to be reliable and accurate, however, its accuracy and completeness cannot be guaranteed. Our firm, employees, and customers may effect transactions, including transactions contrary to any recommendation herein, or have positions in the securities mentioned herein or options with respect thereto. Any recommendation contained in this report may not be suitable for all investors and it is not to be deemed an offer or solicitation on our part with respect to the purchase or sale of any securities. |
|
 |
Financial, Retail, Semiconductor, Biotech, and Gold & Silver Indexes Rose
Kenneth J. Gruneisen - Passed the CAN SLIM® Master's Exam
On Thursday the Broker/Dealer Index ($XBD +0.39%) and the Bank Index ($BKX +0.14%) both posted small gains along with the Retail Index ($RLX +0.25%). The tech sector was led by the Semiconductor Index ($SOX +0.75%) and the Biotechnology Index ($BTK +0.52%) but the Networking Index ($NWX -0.38%) edged lower. The Gold & Silver Index ($XAU +1.11%) posted a modest gain, meanwhile energy-linked groups were mixed and little changed, with the Oil Services Index ($OSX -0.12%) inching lower and the Integrated Oil Index ($XOI +0.09%) eking out a tiny gain. Charts courtesy www.stockcharts.com
 PICTURED: The Semiconductor Index ($SOX +0.75%) has recently been rallying into new high territory above its June high.
| Oil Services |
$OSX |
141.56 |
-0.17 |
-0.12% |
-22.98% |
| Integrated Oil |
$XOI |
1,214.17 |
+1.06 |
+0.09% |
-4.24% |
| Semiconductor |
$SOX |
1,161.69 |
+8.69 |
+0.75% |
+28.16% |
| Networking |
$NWX |
461.48 |
-1.74 |
-0.38% |
+3.45% |
| Broker/Dealer |
$XBD |
240.10 |
+0.92 |
+0.39% |
+16.96% |
| Retail |
$RLX |
1,515.80 |
+3.71 |
+0.25% |
+12.87% |
| Gold & Silver |
$XAU |
85.69 |
+0.94 |
+1.11% |
+8.66% |
| Bank |
$BKX |
98.69 |
+0.14 |
+0.14% |
+7.52% |
| Biotech |
$BTK |
4,181.80 |
+21.43 |
+0.52% |
+35.99% |
|
|
|
 |
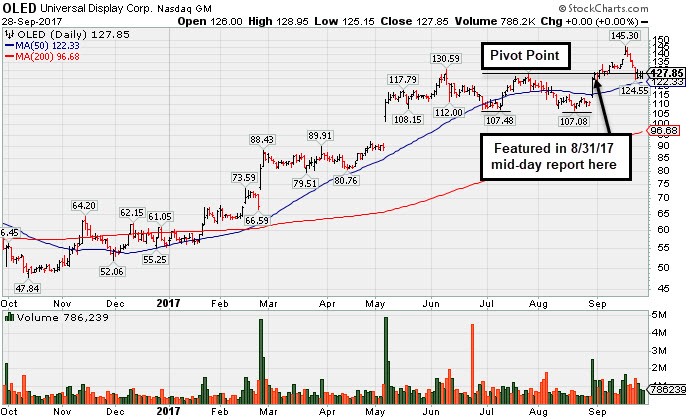
Consolidating Near Prior Highs Following Recent Breakout
Kenneth J. Gruneisen - Passed the CAN SLIM® Master's Exam
Universal Display Corp (OLED $127.85) has been holding its ground after pulling back near prior highs in the $127-130 area. Its 50-day moving average (DMA) line ($122.33) defines the next important support to watch.
OLED was highlighted in yellow with new pivot point cited based on its 7/26/17 high in the 8/31/17 mid-day report (read here) while trying to rally from a 12-week "double bottom" base pattern. It was last shown in this FSU section on 8/31/17 with an annotated graph under the headline, " Rallied Near Pivot Point But Confirming Gains Are Still Needed". Subsequent gains backed by above average volume triggered a technical buy signal and helped it rally above its "max buy" level, but it abruptly retreated.
Recently it reported +115% earnings on +59% sales revenues for the Jun '17 quarter, its 3rd consecutive strong quarter above the +25% minimum guideline (C criteria), helping it better match with the fact-based investment system's fundamental guidelines. Annual earnings (A criteria) history has been strong.
The high-ranked Electronic Products firm has earned a current Timeliness rating of B and a Sponsorship rating of C. The number of top-rated funds owning its shares rose from 355 in Sep '16 to 392 in Jun '17. Its current Up/Down Volume Ratio of 1.1 is an unbiased indication its shares have been under slight accumulation over the past 50 days (I criteria). Its small supply of only 40.9 million shares (S criteria) in the public float can contribute to greater volatility in the event of institutional buying or selling. |
|
|
Color Codes Explained :
Y - Better candidates highlighted by our
staff of experts.
G - Previously featured
in past reports as yellow but may no longer be buyable under the
guidelines.
***Last / Change / Volume data in this table is the closing quote data***
Symbol/Exchange
Company Name
Industry Group |
PRICE |
CHANGE
(%Change) |
Day High |
Volume
(% DAV)
(% 50 day avg vol) |
52 Wk Hi
% From Hi |
Featured
Date |
Price
Featured |
Pivot Featured |
|
Max Buy |
MPX
-
NYSE
Marine Products Corp
AUTOMOTIVE - Recreational Vehicles
|
$16.93
|
-0.05
-0.29% |
$17.06
|
22,465
62.40% of 50 DAV
50 DAV is 36,000
|
$17.12
-1.11%
|
9/26/2017
|
$16.30
|
PP = $16.35
|
|
MB = $17.17
|
Most Recent Note - 9/27/2017 5:19:38 PM
Y - Hit yet another new high with today's 6th consecutive gain, however, volume was only +13% above average, not indicative of heavy institutional buying demand. It was highlighted in yellow with pivot point cited based on its 7/12/17 high plus 10 cents in the 9/26/17 mid-day report. Gains above the pivot point must be backed by at least +40% above average volume to clinch a convincing technical buy signal. See the latest FSU analysis for more details and an annotated graph.
>>> FEATURED STOCK ARTICLE : Powerboat Maker Hit Another New 52-Week High - 9/26/2017 |
View all notes |
Set NEW NOTE alert |
Company Profile |
SEC
News |
Chart |
Request a new note
C
A
S
I |
THO
-
NYSE
Thor Industries Inc
AUTOMOTIVE - Recreational Vehicles
|
$123.07
|
+3.08
2.57% |
$124.16
|
2,503,779
450.32% of 50 DAV
50 DAV is 556,000
|
$120.41
2.21%
|
8/14/2017
|
$106.67
|
PP = $110.01
|
|
MB = $115.51
|
 Most Recent Note - 9/28/2017 1:03:25 PM
G - Hit yet another new 52-week high with today's 4th consecutive volume-driven gain, getting extended from the previously noted base. Prior highs in the $115 area define initial support to watch on pullbacks. Fundamentals remain strong.
>>> FEATURED STOCK ARTICLE : Wedged to New High Then Ended the Session Weak - 9/18/2017 |
View all notes |
Set NEW NOTE alert |
Company Profile |
SEC
News |
Chart |
Request a new note
C
A
S
I |
AVGO
-
NASDAQ
Broadcom Limited
ELECTRONICS - Semiconductor - Broad Line
|
$242.94
|
+2.36
0.98% |
$243.36
|
2,177,629
84.05% of 50 DAV
50 DAV is 2,591,000
|
$259.36
-6.33%
|
8/24/2017
|
$252.44
|
PP = $256.89
|
|
MB = $269.73
|
Most Recent Note - 9/26/2017 6:15:21 PM
G - Halted its slide with a volume-driven gain today. Found support after undercutting recent lows in the $238-240 area with volume-driven losses triggering more worrisome technical sell signals. A rebound above the 50 DMA line ($248) is needed for its outlook to improve.
>>> FEATURED STOCK ARTICLE : Technical Deterioration Raises Concerns - 9/21/2017 |
View all notes |
Set NEW NOTE alert |
Company Profile |
SEC
News |
Chart |
Request a new note
C
A
S
I |
YY
-
NASDAQ
YY Inc Ads
INTERNET - Internet Service Providers
|
$85.82
|
+0.74
0.87% |
$86.98
|
1,376,333
78.96% of 50 DAV
50 DAV is 1,743,000
|
$86.80
-1.13%
|
9/25/2017
|
$80.26
|
PP = $83.10
|
|
MB = $87.26
|
Most Recent Note - 9/27/2017 1:27:57 PM
Y - Hitting another new 52-week high with today's 2nd consecutive volume-driven gain. Encountered distributional pressure on 9/25/17 after highlighted in yellow with pivot point based on its 8/10/17 high plus 10 cents. Gains above the pivot point must be backed by at least +40% above average volume to trigger a proper technical buy signal. This Chinese Internet - Content firm found support in recent weeks above its 50 DMA line. Completed a new Public Offering on 8/16/17. Reported Jun '17 quarterly earnings +53% on +29% sales revenues, its 4th consecutive strong quarterly report above the +25% minimum (C criteria). See the latest FSU analysis for more details and an annotated graph.
>>> FEATURED STOCK ARTICLE : Encountered Distributional Pressure When Challenging Prior HIgh - 9/25/2017 |
View all notes |
Set NEW NOTE alert |
Company Profile |
SEC
News |
Chart |
Request a new note
C
A
S
I |
STMP
-
NASDAQ
Stamps.com Inc
INTERNET - Internet Software and Services
|
$200.15
|
-3.80
-1.86% |
$204.60
|
338,780
75.96% of 50 DAV
50 DAV is 446,000
|
$220.25
-9.13%
|
9/11/2017
|
$193.65
|
PP = $220.35
|
|
MB = $231.37
|
Most Recent Note - 9/25/2017 3:12:34 PM
Y - Reversed into the red today after 6 consecutive gains marked by light volume. The new pivot point cited was based on its 8/07/17 high plus 10 cents. Faces some near-term resistance. Subsequent volume-driven gains above the pivot point are needed to trigger a new (or add-on) technical buy signal. Recent low ($185.80 on 9/05/17) and its 50 DMA line ($188) define important near-term support where violations would trigger technical sell signals. Fundamentals remain strong.
>>> FEATURED STOCK ARTICLE : New Base Being Built After Considerable Gap Higher - 9/11/2017 |
View all notes |
Set NEW NOTE alert |
Company Profile |
SEC
News |
Chart |
Request a new note
C
A
S
I |
Symbol/Exchange
Company Name
Industry Group |
PRICE |
CHANGE
(%Change) |
Day High |
Volume
(% DAV)
(% 50 day avg vol) |
52 Wk Hi
% From Hi |
Featured
Date |
Price
Featured |
Pivot Featured |
|
Max Buy |
HTHT
-
NASDAQ
China Lodging Group Ads
LEISURE - Lodging
|
$120.24
|
-3.10
-2.51% |
$123.90
|
177,909
49.97% of 50 DAV
50 DAV is 356,000
|
$126.29
-4.79%
|
9/29/2016
|
$46.12
|
PP = $47.82
|
|
MB = $50.21
|
Most Recent Note - 9/25/2017 3:13:42 PM
G - Pulling back from its all-time high with today's 4th consecutive loss, still very extended from any sound base. Recently reported earnings +19% on +18% sales revenues for the Jun '17 quarter, below the +25% minimum earnings guideline (C criteria). Its 50 DMA line ($106.51) defines near-term support.
>>> FEATURED STOCK ARTICLE : Considerable Rally However Fundamental Concerns Were Raised - 9/12/2017 |
View all notes |
Set NEW NOTE alert |
Company Profile |
SEC
News |
Chart |
Request a new note
C
A
S
I |
LMAT
-
NASDAQ
Lemaitre Vascular Inc
Medical-Products
|
$37.66
|
-0.02
-0.05% |
$37.94
|
101,495
48.10% of 50 DAV
50 DAV is 211,000
|
$39.29
-4.16%
|
7/28/2017
|
$33.50
|
PP = $33.32
|
|
MB = $34.99
|
Most Recent Note - 9/27/2017 5:36:00 PM
G - Posted a 2nd consecutive gain today on light volume. The 50 DMA line ($34.81) defines near-term support to watch above prior highs in the $33 area.
>>> FEATURED STOCK ARTICLE : Quietly Pulling Back From High After More Volume-Driven Gains - 9/22/2017 |
View all notes |
Set NEW NOTE alert |
Company Profile |
SEC
News |
Chart |
Request a new note
C
A
S
I |
ESNT
-
NYSE
Essent Group Ltd
Finance-MrtgandRel Svc
|
$40.52
|
+0.27
0.67% |
$40.62
|
802,321
113.00% of 50 DAV
50 DAV is 710,000
|
$41.44
-2.22%
|
7/3/2017
|
$38.05
|
PP = $39.60
|
|
MB = $41.58
|
Most Recent Note - 9/25/2017 3:15:18 PM
Y - Still quietly consolidating just above its 50 DMA line ($38.57), and little resistance remains due to overhead supply. Completed a new Public Offering on 8/08/17.
>>> FEATURED STOCK ARTICLE : Undercut 50-Day Moving Average in Slump Toward Prior Lows - 9/5/2017 |
View all notes |
Set NEW NOTE alert |
Company Profile |
SEC
News |
Chart |
Request a new note
C
A
S
I |
OLED
-
NASDAQ
Universal Display Corp
Elec-Misc Products
|
$127.85
|
+0.00
0.00% |
$128.95
|
786,239
89.65% of 50 DAV
50 DAV is 877,000
|
$145.30
-12.01%
|
8/31/2017
|
$128.22
|
PP = $127.78
|
|
MB = $134.17
|
Most Recent Note - 9/28/2017 6:00:43 PM
Y - Holding its ground after pulling back near prior highs in the $127-130 area. Its 50 DMA line ($122.36) defines the next important support to watch. See the latest FSU analysis for more details and a new annotated graph
>>> FEATURED STOCK ARTICLE : Consolidating Near Prior Highs Following Recent Breakout - 9/28/2017 |
View all notes |
Set NEW NOTE alert |
Company Profile |
SEC
News |
Chart |
Request a new note
C
A
S
I |
ANET
-
NYSE
Arista Networks Inc
TELECOMMUNICATIONS - Communication Equipment
|
$187.55
|
+1.00
0.54% |
$188.23
|
585,344
67.83% of 50 DAV
50 DAV is 863,000
|
$193.24
-2.94%
|
8/4/2017
|
$173.31
|
PP = $163.07
|
|
MB = $171.22
|
Most Recent Note - 9/25/2017 3:10:58 PM
G - Reversed into the red today after hitting yet another new all-time high. extended from any sound base and its 50 DMA line ($168.75) defines important near-term support to watch. Fundamentals remain very strong.
>>> FEATURED STOCK ARTICLE : Extended From Any Sound Base After Additional Volume-Driven Gains - 9/19/2017 |
View all notes |
Set NEW NOTE alert |
Company Profile |
SEC
News |
Chart |
Request a new note
C
A
S
I |
Symbol/Exchange
Company Name
Industry Group |
PRICE |
CHANGE
(%Change) |
Day High |
Volume
(% DAV)
(% 50 day avg vol) |
52 Wk Hi
% From Hi |
Featured
Date |
Price
Featured |
Pivot Featured |
|
Max Buy |
GRUB
-
NYSE
Grubhub Inc
COMPUTER SOFTWARE and SERVICES - Technical and System Software
|
$51.78
|
+0.17
0.33% |
$51.99
|
582,964
30.19% of 50 DAV
50 DAV is 1,931,000
|
$57.61
-10.12%
|
6/21/2017
|
$47.33
|
PP = $46.94
|
|
MB = $49.29
|
Most Recent Note - 9/27/2017 5:34:44 PM
G - Posted a gain today with lighter volume. A rebound above its 50 DMA line ($52.63) is needed for its outlook to improve. More damaging losses below the recent low ($49.60 on 9/22/17) would raise greater concerns. The next near-term support is prior highs in the $47 area. Recently reported earnings +13% on +32% sales revenues for the Jun '17 quarter, below the +25% minimum earnings guideline (C criteria) raising fundamental concerns.
>>> FEATURED STOCK ARTICLE : Touched New High With Quiet Gain From Brief Consolidation - 9/7/2017 |
View all notes |
Set NEW NOTE alert |
Company Profile |
SEC
News |
Chart |
Request a new note
C
A
S
I |
IBP
-
NYSE
Installed Building Prod
DIVERSIFIED SERVICES - Business/Management Services
|
$63.90
|
-0.10
-0.16% |
$65.60
|
764,704
554.13% of 50 DAV
50 DAV is 138,000
|
$64.95
-1.62%
|
9/19/2017
|
$59.15
|
PP = $60.10
|
|
MB = $63.11
|
Most Recent Note - 9/28/2017 12:34:39 PM
Y - There was a "negative reversal" after early gains into new high territory today following 2 consecutive volume-driven gains. Color code is changed to yellow after retreating below its "max buy" level. Prior highs in the $60 area define initial support after the technical breakout this week.
>>> FEATURED STOCK ARTICLE : Found Prompt Support Near Prior Highs and 50 Day Average - 9/13/2017 |
View all notes |
Set NEW NOTE alert |
Company Profile |
SEC
News |
Chart |
Request a new note
C
A
S
I |
NCOM
-
NASDAQ
National Commerce Corp
BANKING - Regional - Southeast Banks
|
$42.90
|
+0.65
1.54% |
$42.95
|
60,741
173.55% of 50 DAV
50 DAV is 35,000
|
$42.40
1.18%
|
4/25/2017
|
$38.95
|
PP = $40.09
|
|
MB = $42.09
|
Most Recent Note - 9/27/2017 5:27:12 PM
G - Hit another new 52-week high with today's 4th consecutive gain adding to an impressive spurt of volume-driven gains. Recently reported Jun '17 earnings +23% on +45% sales revenues, below the +25% minimum earnings guideline (C criteria), raising fundamental concerns.
>>> FEATURED STOCK ARTICLE : Relative Strength Rating Fell Below 80+ Minimum Guideline - 9/14/2017 |
View all notes |
Set NEW NOTE alert |
Company Profile |
SEC
News |
Chart |
Request a new note
C
A
S
I |
OLLI
-
NASDAQ
Ollie's Bargain Outlet
Retail-DiscountandVariety
|
$45.80
|
-0.15
-0.33% |
$46.00
|
574,367
103.12% of 50 DAV
50 DAV is 557,000
|
$46.25
-0.97%
|
9/8/2017
|
$45.20
|
PP = $46.18
|
|
MB = $48.49
|
Most Recent Note - 9/27/2017 5:31:21 PM
Y - Found support at its 50 DMA line ($44.40) and posted a solid gain today ending near its session high and near its all-time high. New pivot point cited was based on its 8/01/17 high plus 10 cents. Subsequent gains above the latest pivot point with at least the minimum +40% above average volume may trigger a proper new (or add-on) technical buy signal. Fundamentals remain strong.
>>> FEATURED STOCK ARTICLE : New Pivot Point Cited After Rebound From Below 50-Day Average - 9/8/2017 |
View all notes |
Set NEW NOTE alert |
Company Profile |
SEC
News |
Chart |
Request a new note
C
A
S
I |
HLI
-
NYSE
Houlihan Lokey Inc Cl A
Finance-Invest Bnk/Bkrs
|
$39.31
|
+0.76
1.97% |
$39.34
|
206,929
89.19% of 50 DAV
50 DAV is 232,000
|
$39.68
-0.93%
|
9/18/2017
|
$37.04
|
PP = $39.78
|
|
MB = $41.77
|
Most Recent Note - 9/27/2017 5:15:36 PM
Y - Rebounded further above its 50 DMA line ($36.48) today and finished near the session high. Approaching the new pivot point cited based on its 7/26/17 plus 10 cents. Subsequent volume-driven gains for new highs may trigger a new (or add-on) technical buy signal. Subsequent losses below the recent low ($34.41 on 8/18/17) would raise more serious concerns and trigger a technical sell signal. See the latest FSU analysis for more details and a new annotated graph.
>>> FEATURED STOCK ARTICLE : Rebounding Toward Prior High and New Pivot Point - 9/27/2017 |
View all notes |
Set NEW NOTE alert |
Company Profile |
SEC
News |
Chart |
Request a new note
C
A
S
I |
Symbol/Exchange
Company Name
Industry Group |
PRICE |
CHANGE
(%Change) |
Day High |
Volume
(% DAV)
(% 50 day avg vol) |
52 Wk Hi
% From Hi |
Featured
Date |
Price
Featured |
Pivot Featured |
|
Max Buy |
|
|
|
THESE ARE NOT BUY RECOMMENDATIONS!
Comments contained in the body of this report are technical
opinions only. The material herein has been obtained
from sources believed to be reliable and accurate, however,
its accuracy and completeness cannot be guaranteed.
This site is not an investment advisor, hence it does
not endorse or recommend any securities or other investments.
Any recommendation contained in this report may not
be suitable for all investors and it is not to be deemed
an offer or solicitation on our part with respect to
the purchase or sale of any securities. All trademarks,
service marks and trade names appearing in this report
are the property of their respective owners, and are
likewise used for identification purposes only.
This report is a service available
only to active Paid Premium Members.
You may opt-out of receiving report notifications
at any time. Questions or comments may be submitted
by writing to Premium Membership Services 665 S.E. 10 Street, Suite 201 Deerfield Beach, FL 33441-5634 or by calling 1-800-965-8307
or 954-785-1121.
|
|
|