You are not logged in.
This means you
CAN ONLY VIEW reports that were published prior to Wednesday, April 16, 2025.
You
MUST UPGRADE YOUR MEMBERSHIP if you want to see any current reports.
AFTER MARKET UPDATE - TUESDAY, SEPTEMBER 19TH, 2017
Previous After Market Report Next After Market Report >>>
|
|
|
|
DOW |
+39.45 |
22,370.80 |
+0.18% |
|
Volume |
809,287,810 |
-2% |
|
Volume |
1,812,857,370 |
-3% |
|
NASDAQ |
+6.68 |
6,461.32 |
+0.10% |
|
Advancers |
1,522 |
53% |
|
Advancers |
1,283 |
48% |
|
S&P 500 |
+2.78 |
2,506.65 |
+0.11% |
|
Decliners |
1,374 |
47% |
|
Decliners |
1,378 |
52% |
|
Russell 2000 |
-0.68 |
1,440.40 |
-0.05% |
|
52 Wk Highs |
164 |
|
|
52 Wk Highs |
203 |
|
|
S&P 600 |
-1.17 |
865.98 |
-0.13% |
|
52 Wk Lows |
18 |
|
|
52 Wk Lows |
30 |
|
|
 |
Indices Rose With Mixed Breadth and Less Leadership
Kenneth J. Gruneisen - Passed the CAN SLIM® Master's Exam
Stocks extended their winning streak Tuesday. The Dow rose for a sixth straight session, gaining 39 points to a record 22370. The S&P 500 added 3 points to an all-time high at 2506. The Nasdaq Composite increased 7 points to 6461. Volume totals reported were lighter than the prior session totals on the NYSE and on the Nasdaq exchange. Breadth was mixed, with a slightly positive bias on the NYSE, but decliners edged out advancing issues on the Nasdaq exchange. There were 72 high-ranked companies from the Leaders List that made new 52-week highs and were listed on the BreakOuts Page, versus the total of 84 on the prior session. New 52-week highs totals solidly outnumbered new 52-week lows totals on the Nasdaq exchange and on the NYSE. The Featured Stocks Page provides the latest analysis on noteworthy high-ranked leaders. Charts used courtesy of www.stockcharts.com
 PICTURED: The Nasdaq Composite Index is perched at a record high after tallying gains in 6 of the past 7 sessions.
The major averages' (M criteria) uptrend endured recent pressure however leadership has remained healthy. Investors should buy stocks meeting all key criteria of the fact-based investment system on a case-by-case basis as they trigger technical buy signals.
The major averages advanced as the Fed convened its policy meeting. While expectations are for no change in interest rates, investors are anticipating the central bank will announce plans to start unwinding its $4.5 trillion balance sheet. Geopolitical tension was a focus as President Trump went before the UN to rally support for harsher sanctions against North Korea. Also garnering attention was Hurricane Maria approaching the Caribbean and a 7.1 magnitude earthquake hitting Southern Mexico. On the economic front, import prices rose 0.6% in August versus a projected 0.2% increase. Housing starts unexpectedly fell 0.8% while building permits rose 5.7% last month.
Telecom was the best performing sector on the session. Sprint (S +6.77%) and T-Mobile (TMUS +5.86%) both rallied on reports the two resumed merger talks. American Tower (AMT -2.62%) fell on the news. Post Holdings (POST +0.6%) edged higher after the cereal maker agreed to buy Bob Evans (BOBE +6.14%) for $1.5 billion. AutoZone (AZO -5.01%) fell despite posting positive quarterly results.
Treasuries were lower with the 10-year off 4/32 to yield 2.24%. In commodities, NYMEX WTI crude lost 0.6% to $49.59/barrel. COMEX gold was up 0.3% to $1311.00/ounce. |
 Kenneth J. Gruneisen started out as a licensed stockbroker in August 1987, a couple of months prior to the historic stock market crash that took the Dow Jones Industrial Average down -22.6% in a single day. He has published daily fact-based fundamental and technical analysis on high-ranked stocks online for two decades. Through FACTBASEDINVESTING.COM, Kenneth provides educational articles, news, market commentary, and other information regarding proven investment systems that work in good times and bad.
Comments contained in the body of this report are technical opinions only and are not necessarily those of Gruneisen Growth Corp. The material herein has been obtained from sources believed to be reliable and accurate, however, its accuracy and completeness cannot be guaranteed. Our firm, employees, and customers may effect transactions, including transactions contrary to any recommendation herein, or have positions in the securities mentioned herein or options with respect thereto. Any recommendation contained in this report may not be suitable for all investors and it is not to be deemed an offer or solicitation on our part with respect to the purchase or sale of any securities. |
|
 |
Financial Indexes Underpinned Major Indices' Gains
Kenneth J. Gruneisen - Passed the CAN SLIM® Master's Exam
On Tuesday the Retail Index ($RLX -0.46%) again edged lower while the Bank Index ($BKX +0.88%) and the Broker/Dealer Index ($XBD +0.53%) both posted solid gains. The tech sector was led by the Semiconductor Index ($SOX +0.35%), but the Networking Index ($NWX -0.33%) and the Biotechnology Index ($BTK -0.92%) both fell. Energy-linked groups were mixed as the Oil Services Index ($OSX -0.64%) edged lower and the Integrated Oil Index ($XOI +0.540%) posted a modest gain. The Gold & Silver Index ($XAU +0.45%) also ended slightly higher. Charts courtesy www.stockcharts.com
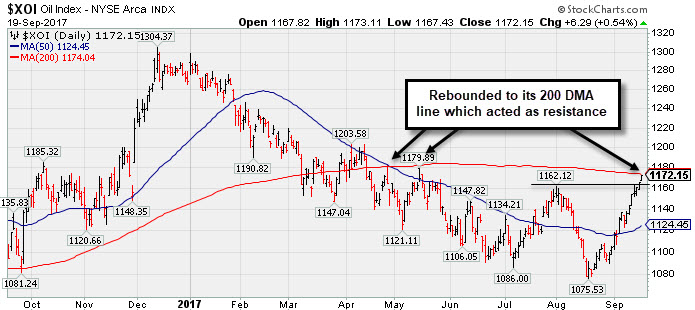 PICTURED: The Integrated Oil Index ($XOI +0.540%) has rebounded to its 200-day moving average (DMA) line. That long-term average acted as resistance in late-April and May, during its ongoing consolidation since its peak in Dec '16.
| Oil Services |
$OSX |
134.01 |
-0.86 |
-0.64% |
-27.09% |
| Integrated Oil |
$XOI |
1,172.15 |
+6.29 |
+0.54% |
-7.56% |
| Semiconductor |
$SOX |
1,164.98 |
+4.08 |
+0.35% |
+28.52% |
| Networking |
$NWX |
454.81 |
-1.49 |
-0.33% |
+1.95% |
| Broker/Dealer |
$XBD |
230.43 |
+1.21 |
+0.53% |
+12.25% |
| Retail |
$RLX |
1,503.54 |
-6.90 |
-0.46% |
+11.96% |
| Gold & Silver |
$XAU |
87.22 |
+0.38 |
+0.44% |
+10.60% |
| Bank |
$BKX |
95.86 |
+0.84 |
+0.88% |
+4.43% |
| Biotech |
$BTK |
4,140.37 |
-38.34 |
-0.92% |
+34.65% |
|
|
|
 |
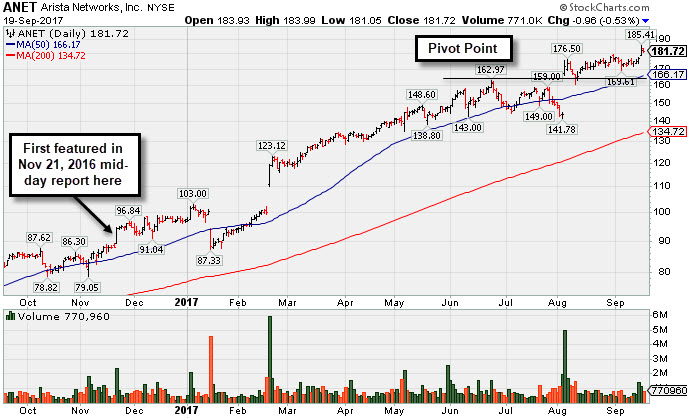
Extended From Any Sound Base After Additional Volume-Driven Gains
Kenneth J. Gruneisen - Passed the CAN SLIM® Master's Exam
Arista Networks Inc (ANET -$0.96 or -0.53% to $181.72) is perched near its all-time high following additional volume-driven gains, extended from any sound base. Its 50-day moving average (DMA) line ($166.17) and prior highs in the $162 area define important near-term support to watch on pullbacks. Fundamentals remain very strong.
It was last shown in this FSU section on 8/23/17 with an annotated graph under the headline, "Gapped Up After Earnings Repairing 50-Day Moving Average Violation". Strength returned and it gapped up for new highs on 8/04/17 after it reported Jun '17 earnings rose +81% on +51% sales revenues versus the year ago period. ANET has shown strong and steady increases in quarterly sales revenues while earnings have routinely been well above the +25% minimum guideline (C criteria). Its annual earnings (A criteria) growth has been strong, however, its history is limited since its $43 IPO in June of 2014.
ANET traded up as much as +97.6% since first highlighted at $93.80 in yellow with pivot point cited based on its 2015 high plus 10 cents in the 11/21/16 mid-day report (read here).
The number of top-rated funds owning its shares rose from 360 in Dec '15 to 590 Jun '17, a reassuring sign concerning the I criteria. The high-ranked Computer - Networking firm has a Timeliness Rating of A and a Sponsorship Rating of B. Its small supply of 45 million shares (S criteria) in the public float may contribute to greater volatility in the event of institutional buying or selling.
|
|
|
Color Codes Explained :
Y - Better candidates highlighted by our
staff of experts.
G - Previously featured
in past reports as yellow but may no longer be buyable under the
guidelines.
***Last / Change / Volume data in this table is the closing quote data***
Symbol/Exchange
Company Name
Industry Group |
PRICE |
CHANGE
(%Change) |
Day High |
Volume
(% DAV)
(% 50 day avg vol) |
52 Wk Hi
% From Hi |
Featured
Date |
Price
Featured |
Pivot Featured |
|
Max Buy |
THO
-
NYSE
Thor Industries Inc
AUTOMOTIVE - Recreational Vehicles
|
$114.90
|
+0.92
0.81% |
$115.04
|
387,269
76.08% of 50 DAV
50 DAV is 509,000
|
$115.80
-0.78%
|
8/14/2017
|
$106.67
|
PP = $110.01
|
|
MB = $115.51
|
Most Recent Note - 9/18/2017 6:14:05 PM
Y - Quietly touched a new 52-week high but ended the session weak. Current Relative Strength Rating of 79 is just below the 80+ minimum guideline for buy candidates under the fact-based investment system. Very little resistance remains due to overhead supply up to its $115.74 all-time high. See the latest FSU analysis for more details and a new annotated graph.
>>> FEATURED STOCK ARTICLE : Wedged to New High Then Ended the Session Weak - 9/18/2017 |
View all notes |
Set NEW NOTE alert |
Company Profile |
SEC
News |
Chart |
Request a new note
C
A
S
I |
AVGO
-
NASDAQ
Broadcom Limited
ELECTRONICS - Semiconductor - Broad Line
|
$249.76
|
-0.06
-0.02% |
$251.85
|
2,193,511
91.59% of 50 DAV
50 DAV is 2,395,000
|
$259.36
-3.70%
|
8/24/2017
|
$252.44
|
PP = $256.89
|
|
MB = $269.73
|
 Most Recent Note - 9/19/2017 7:04:13 PM
Y - Still consolidating in a tight range near its 50 DMA line ($249) after enduring distributional pressure. Recent lows define the next important support in the $238-240 area. Subsequent violations would trigger more worrisome technical sell signals. Fundamentals remain strong. It has not produced volume-driven gains since highlighted in the 8/24/17 mid-day report - "Subsequent volume-driven gains above the pivot and for new highs may trigger a technical buy signal."
>>> FEATURED STOCK ARTICLE : Pullback Followed Latest Strong Earnings Report From Tech Leader - 8/25/2017 |
View all notes |
Set NEW NOTE alert |
Company Profile |
SEC
News |
Chart |
Request a new note
C
A
S
I |
EW
-
NYSE
Edwards Lifesciences Cp
HEALTH SERVICES - Medical Appliances and Equipment
|
$111.28
|
-1.41
-1.25% |
$112.93
|
973,723
75.42% of 50 DAV
50 DAV is 1,291,000
|
$121.75
-8.60%
|
7/11/2017
|
$117.23
|
PP = $121.85
|
|
MB = $127.94
|
Most Recent Note - 9/19/2017 7:06:11 PM
G - A rebound above its downward sloping 50 DMA line ($114.73) is needed for its outlook to improve. Met resistance at its 50 DMA line and it has been pulling back with light volume. It is only -8.6% off its all-time high, but its Relative Strength Rating has slumped to 52, below the 80+ minimum guideline for buy candidates. Fundamentals remain strong.
>>> FEATURED STOCK ARTICLE : Positive Reversal After Slumping to New Lows - 9/6/2017 |
View all notes |
Set NEW NOTE alert |
Company Profile |
SEC
News |
Chart |
Request a new note
C
A
S
I |
STMP
-
NASDAQ
Stamps.com Inc
INTERNET - Internet Software and Services
|
$208.20
|
+3.20
1.56% |
$208.45
|
213,158
46.04% of 50 DAV
50 DAV is 463,000
|
$220.25
-5.47%
|
9/11/2017
|
$193.65
|
PP = $220.35
|
|
MB = $231.37
|
Most Recent Note - 9/18/2017 6:12:15 PM
Y - Gapped up today for a gain with light volume. The new pivot point cited was based on its 8/07/17 high plus 10 cents. Faces some near-term resistance. Subsequent volume-driven gains above the pivot point are needed to trigger a new (or add-on) technical buy signal. Recent low ($185.80 on 9/05/17) and its 50 DMA line ($182.53) define important near-term support where violations would trigger technical sell signals. Fundamentals remain strong.
>>> FEATURED STOCK ARTICLE : New Base Being Built After Considerable Gap Higher - 9/11/2017 |
View all notes |
Set NEW NOTE alert |
Company Profile |
SEC
News |
Chart |
Request a new note
C
A
S
I |
HTHT
-
NASDAQ
China Lodging Group Ads
LEISURE - Lodging
|
$125.31
|
+10.26
8.92% |
$125.57
|
843,724
251.11% of 50 DAV
50 DAV is 336,000
|
$118.00
6.19%
|
9/29/2016
|
$46.12
|
PP = $47.82
|
|
MB = $50.21
|
Most Recent Note - 9/19/2017 12:54:27 PM
G - Hitting another new all-time high with today's big volume-driven gain, very extended from any sound base. Recently reported earnings +19% on +18% sales revenues for the Jun '17 quarter, below the +25% minimum earnings guideline (C criteria). Its 50 DMA line ($103) defines near-term support.
>>> FEATURED STOCK ARTICLE : Considerable Rally However Fundamental Concerns Were Raised - 9/12/2017 |
View all notes |
Set NEW NOTE alert |
Company Profile |
SEC
News |
Chart |
Request a new note
C
A
S
I |
Symbol/Exchange
Company Name
Industry Group |
PRICE |
CHANGE
(%Change) |
Day High |
Volume
(% DAV)
(% 50 day avg vol) |
52 Wk Hi
% From Hi |
Featured
Date |
Price
Featured |
Pivot Featured |
|
Max Buy |
LMAT
-
NASDAQ
Lemaitre Vascular Inc
Medical-Products
|
$38.40
|
-0.73
-1.87% |
$39.28
|
138,055
60.29% of 50 DAV
50 DAV is 229,000
|
$39.29
-2.27%
|
7/28/2017
|
$33.50
|
PP = $33.32
|
|
MB = $34.99
|
Most Recent Note - 9/18/2017 6:28:01 PM
G - Inched higher for yet another new all-time high with today's gain backed by near average volume. Prior highs and the 50 DMA line define near-term support to watch in the $33 area.
>>> FEATURED STOCK ARTICLE : Volume-Driven Gain for New High And Strong Finish Bode Well - 8/28/2017 |
View all notes |
Set NEW NOTE alert |
Company Profile |
SEC
News |
Chart |
Request a new note
C
A
S
I |
ESNT
-
NYSE
Essent Group Ltd
Finance-MrtgandRel Svc
|
$39.73
|
+0.33
0.84% |
$39.90
|
471,954
67.04% of 50 DAV
50 DAV is 704,000
|
$41.44
-4.13%
|
7/3/2017
|
$38.05
|
PP = $39.60
|
|
MB = $41.58
|
Most Recent Note - 9/18/2017 6:08:14 PM
Y - Color code is changed to yellow after recent gains above its 50 DMA line ($38.50) helped its outlook to improve. Completed a new Public Offering on 8/08/17.
>>> FEATURED STOCK ARTICLE : Undercut 50-Day Moving Average in Slump Toward Prior Lows - 9/5/2017 |
View all notes |
Set NEW NOTE alert |
Company Profile |
SEC
News |
Chart |
Request a new note
C
A
S
I |
OLED
-
NASDAQ
Universal Display Corp
Elec-Misc Products
|
$142.20
|
+5.50
4.02% |
$145.30
|
1,678,845
201.30% of 50 DAV
50 DAV is 834,000
|
$137.10
3.72%
|
8/31/2017
|
$128.22
|
PP = $127.78
|
|
MB = $134.17
|
Most Recent Note - 9/19/2017 1:07:48 PM
G - Gapped up today hitting new all time highs, adding to a spurt of volume-driven gains. Disciplined investors avoid chasing stocks extended more than +5% from a sound base pattern. Prior highs in the $127-130 area define initial support to watch on pullbacks.
>>> FEATURED STOCK ARTICLE : Rallied Near Pivot Point But Confirming Gains Are Still Needed - 8/31/2017 |
View all notes |
Set NEW NOTE alert |
Company Profile |
SEC
News |
Chart |
Request a new note
C
A
S
I |
VEEV
-
NYSE
Veeva Systems Inc Cl A
Computer Sftwr-Medical
|
$56.19
|
+0.02
0.04% |
$56.36
|
1,125,416
78.30% of 50 DAV
50 DAV is 1,437,400
|
$68.07
-17.45%
|
7/24/2017
|
$65.91
|
PP = $68.17
|
|
MB = $71.58
|
Most Recent Note - 9/14/2017 5:29:39 PM
G - A rebound above the 50 DMA line ($61.72) is still needed for its outlook to improve. Prior low ($55.11 on 8/25/17) and the 200 DMA line define the next support to watch. Disciplined investors following the fact-based system limit losses by selling any stock that falls more than -7% below their purchase price.
>>> FEATURED STOCK ARTICLE : Rebounding After gap Down Violated 50-Day Average and Prior Lows - 9/1/2017 |
View all notes |
Set NEW NOTE alert |
Company Profile |
SEC
News |
Chart |
Request a new note
C
A
S
I |
ANET
-
NYSE
Arista Networks Inc
TELECOMMUNICATIONS - Communication Equipment
|
$181.72
|
-0.96
-0.53% |
$183.99
|
770,960
94.83% of 50 DAV
50 DAV is 813,000
|
$185.41
-1.99%
|
8/4/2017
|
$173.31
|
PP = $163.07
|
|
MB = $171.22
|
Most Recent Note - 9/19/2017 7:02:46 PM
G - Perched near its all-time high following additional volume-driven gains after stubbornly holding its ground in recent weeks. Its 50 DMA line ($166) and prior highs in the $162 area define important near-term support to watch on pullbacks. Fundamentals remain very strong. See the latest FSU analysis for more details and a new annotated graph.
>>> FEATURED STOCK ARTICLE : Extended From Any Sound Base After Additional Volume-Driven Gains - 9/19/2017 |
View all notes |
Set NEW NOTE alert |
Company Profile |
SEC
News |
Chart |
Request a new note
C
A
S
I |
Symbol/Exchange
Company Name
Industry Group |
PRICE |
CHANGE
(%Change) |
Day High |
Volume
(% DAV)
(% 50 day avg vol) |
52 Wk Hi
% From Hi |
Featured
Date |
Price
Featured |
Pivot Featured |
|
Max Buy |
GRUB
-
NYSE
Grubhub Inc
COMPUTER SOFTWARE and SERVICES - Technical and System Software
|
$54.35
|
+1.35
2.55% |
$54.38
|
1,729,937
91.29% of 50 DAV
50 DAV is 1,895,000
|
$57.61
-5.66%
|
6/21/2017
|
$47.33
|
PP = $46.94
|
|
MB = $49.29
|
Most Recent Note - 9/18/2017 12:16:02 PM
G - Pulling back today for a 3rd consecutive volume-driven loss. Its 50 DMA line ($51.59) defines near-term support above prior highs in the $46-47 area. Recently reported earnings +13% on +32% sales revenues for the Jun '17 quarter, below the +25% minimum earnings guideline (C criteria) raising fundamental concerns.
>>> FEATURED STOCK ARTICLE : Touched New High With Quiet Gain From Brief Consolidation - 9/7/2017 |
View all notes |
Set NEW NOTE alert |
Company Profile |
SEC
News |
Chart |
Request a new note
C
A
S
I |
IBP
-
NYSE
Installed Building Prod
DIVERSIFIED SERVICES - Business/Management Services
|
$59.85
|
+1.25
2.13% |
$60.08
|
327,617
280.01% of 50 DAV
50 DAV is 117,000
|
$60.00
-0.25%
|
9/19/2017
|
$59.15
|
PP = $60.10
|
|
MB = $63.11
|
Most Recent Note - 9/19/2017 1:02:46 PM
Y - New pivot point is cited based on its 8/04/17 high plus 10 cents. Subsequent volume-driven gains for new highs may trigger a new (or add-on) technical buy signal. Perched within close striking distance of its all-time high after finding support near its 50 DMA line ($55.50) and prior highs.
>>> FEATURED STOCK ARTICLE : Found Prompt Support Near Prior Highs and 50 Day Average - 9/13/2017 |
View all notes |
Set NEW NOTE alert |
Company Profile |
SEC
News |
Chart |
Request a new note
C
A
S
I |
NCOM
-
NASDAQ
National Commerce Corporation
BANKING - Regional - Southeast Banks
|
$40.35
|
+0.15
0.37% |
$40.45
|
68,988
237.07% of 50 DAV
50 DAV is 29,100
|
$41.25
-2.18%
|
4/25/2017
|
$38.95
|
PP = $40.09
|
|
MB = $42.09
|
Most Recent Note - 9/18/2017 12:22:15 PM
G - Consolidating in a tight range near its 50 DMA line ($39.79). Its Relative Strength rating is currently 75, below the minimum guideline for buy candidates. Recently reported Jun '17 earnings +23% on +45% sales revenues, below the +25% minimum earnings guideline (C criteria), raising fundamental concerns. See the latest FSU analysis for more details and an annotated graph.
>>> FEATURED STOCK ARTICLE : Relative Strength Rating Fell Below 80+ Minimum Guideline - 9/14/2017 |
View all notes |
Set NEW NOTE alert |
Company Profile |
SEC
News |
Chart |
Request a new note
C
A
S
I |
OLLI
-
NASDAQ
Ollie's Bargain Outlet
Retail-DiscountandVariety
|
$46.05
|
+0.05
0.11% |
$46.15
|
768,063
133.11% of 50 DAV
50 DAV is 577,000
|
$46.25
-0.43%
|
9/8/2017
|
$45.20
|
PP = $46.18
|
|
MB = $48.49
|
Most Recent Note - 9/14/2017 5:27:58 PM
Y - Quietly hovering near its all-time high. New pivot point cited is based on its 8/01/17 high plus 10 cents. Recent gains above the 50 DMA line helped its outlook improve. Subsequent gains above the latest pivot point with at least the minimum +40% above average volume may trigger a proper new (or add-on) technical buy signal. Fundamentals remain strong.
>>> FEATURED STOCK ARTICLE : New Pivot Point Cited After Rebound From Below 50-Day Average - 9/8/2017 |
View all notes |
Set NEW NOTE alert |
Company Profile |
SEC
News |
Chart |
Request a new note
C
A
S
I |
HLI
-
NYSE
Houlihan Lokey Inc Cl A
Finance-Invest Bnk/Bkrs
|
$37.50
|
+0.46
1.24% |
$37.54
|
230,678
98.58% of 50 DAV
50 DAV is 234,000
|
$39.68
-5.49%
|
9/18/2017
|
$37.04
|
PP = $39.78
|
|
MB = $41.77
|
Most Recent Note - 9/18/2017 6:26:48 PM
Y - A new pivot point is cited based on its 7/26/17 plus 10 cents. Subsequent volume-driven gains for new highs may trigger a new (or add-on) technical buy signal. Consolidating above its 50 DMA line ($36.32). Subsequent losses below the recent low ($34.41 on 8/18/17) would raise more serious concerns and trigger a technical sell signal.
>>> FEATURED STOCK ARTICLE : Consolidating Near 50-Day Moving Average - 8/29/2017 |
View all notes |
Set NEW NOTE alert |
Company Profile |
SEC
News |
Chart |
Request a new note
C
A
S
I |
Symbol/Exchange
Company Name
Industry Group |
PRICE |
CHANGE
(%Change) |
Day High |
Volume
(% DAV)
(% 50 day avg vol) |
52 Wk Hi
% From Hi |
Featured
Date |
Price
Featured |
Pivot Featured |
|
Max Buy |
|
|
|
THESE ARE NOT BUY RECOMMENDATIONS!
Comments contained in the body of this report are technical
opinions only. The material herein has been obtained
from sources believed to be reliable and accurate, however,
its accuracy and completeness cannot be guaranteed.
This site is not an investment advisor, hence it does
not endorse or recommend any securities or other investments.
Any recommendation contained in this report may not
be suitable for all investors and it is not to be deemed
an offer or solicitation on our part with respect to
the purchase or sale of any securities. All trademarks,
service marks and trade names appearing in this report
are the property of their respective owners, and are
likewise used for identification purposes only.
This report is a service available
only to active Paid Premium Members.
You may opt-out of receiving report notifications
at any time. Questions or comments may be submitted
by writing to Premium Membership Services 665 S.E. 10 Street, Suite 201 Deerfield Beach, FL 33441-5634 or by calling 1-800-965-8307
or 954-785-1121.
|
|
|