You are not logged in.
This means you
CAN ONLY VIEW reports that were published prior to Friday, April 11, 2025.
You
MUST UPGRADE YOUR MEMBERSHIP if you want to see any current reports.
AFTER MARKET UPDATE - TUESDAY, SEPTEMBER 26TH, 2017
Previous After Market Report Next After Market Report >>>
|
|
|
|
DOW |
-11.77 |
22,284.32 |
-0.05% |
|
Volume |
737,657,740 |
-12% |
|
Volume |
1,920,458,806 |
-7% |
|
NASDAQ |
+9.57 |
6,380.16 |
+0.15% |
|
Advancers |
1,637 |
56% |
|
Advancers |
1,553 |
58% |
|
S&P 500 |
+0.18 |
2,496.84 |
+0.01% |
|
Decliners |
1,274 |
44% |
|
Decliners |
1,116 |
42% |
|
Russell 2000 |
+4.91 |
1,456.86 |
+0.34% |
|
52 Wk Highs |
143 |
|
|
52 Wk Highs |
155 |
|
|
S&P 600 |
+4.47 |
881.77 |
+0.51% |
|
52 Wk Lows |
10 |
|
|
52 Wk Lows |
28 |
|
|
 |
Major Indices Were Little Changed, Remaining Near Record Highs
Kenneth J. Gruneisen - Passed the CAN SLIM® Master's Exam
On Tuesday the Dow fell 11 points to 22284. The S&P 500 was unchanged at 2496. The Nasdaq was up 9 points to 6380. Volume totals reported were lighter than the prior session totals on the NYSE and on the Nasdaq exchange. Breadth was positive as advancers led decliners by a 4-3 margin on the NYSE and on the Nasdaq exchange. There were 64 high-ranked companies from the Leaders List that made new 52-week highs and were listed on the BreakOuts Page, versus the total of 40 on the prior session. New 52-week highs totals expanded and solidly outnumbered new 52-week lows totals on the Nasdaq exchange and on the NYSE. The Featured Stocks Page provides the latest analysis on noteworthy high-ranked leaders. Charts used courtesy of www.stockcharts.com
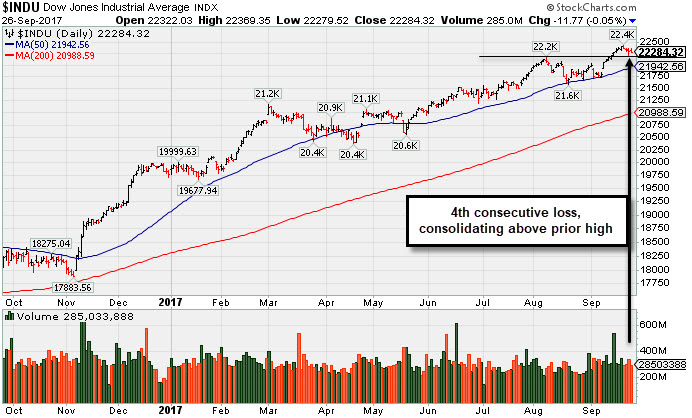 PICTURED: The Dow Jones Industrial Average pulled back for a 4th consecutive loss, consolidating above prior highs and well above its 50-day moving average (DMA) line.
The major averages' (M criteria) uptrend endured recent pressure however leadership has remained healthy. Investors should buy stocks meeting all key criteria of the fact-based investment system on a case-by-case basis as they trigger technical buy signals.
U.S. equities were mixed as investors reacted to central bank and earnings news. Political proceedings were also relevant as the Senate is reportedly tabling health care talks in favor of focusing on tax reform. In Fed news, Chair Janet Yellen warned against raising rates too slowly in a speech Tuesday but also hinted that the central bank’s outlook could change if inflation proves persistent. On the data front, new home sales unexpectedly slipped 3.4% in August to an eight-month low. A separate release revealed consumer confidence slipped in September to 119.8, but remains near a 16-year high.
Eight of 11 sectors in the S&P 500 finished in the red with Materials and Energy lagging. Technology outperformed with Apple (AAPL +1.72%) rebounding. In earnings news, Red Hat (RHT +4.08%) rose to new multi-year highs as quarterly results topped consensus estimates. Darden Restaurants (DRI -6.53%) fell below its 200 DMA line as same store sales were below forecasts. Carnival Corp (CCL +2.87%) rose after beating analyst profit projections.
Treasuries prices were lower with the yield on the 10-year note rising one basis point to 2.23%. In commodities, NYMEX WTI crude slipped 0.6% to $51.89/barrel as traders took profits after the recent rally. The Dollar Index added another 0.3% against its currency peers. |
 Kenneth J. Gruneisen started out as a licensed stockbroker in August 1987, a couple of months prior to the historic stock market crash that took the Dow Jones Industrial Average down -22.6% in a single day. He has published daily fact-based fundamental and technical analysis on high-ranked stocks online for two decades. Through FACTBASEDINVESTING.COM, Kenneth provides educational articles, news, market commentary, and other information regarding proven investment systems that work in good times and bad.
Comments contained in the body of this report are technical opinions only and are not necessarily those of Gruneisen Growth Corp. The material herein has been obtained from sources believed to be reliable and accurate, however, its accuracy and completeness cannot be guaranteed. Our firm, employees, and customers may effect transactions, including transactions contrary to any recommendation herein, or have positions in the securities mentioned herein or options with respect thereto. Any recommendation contained in this report may not be suitable for all investors and it is not to be deemed an offer or solicitation on our part with respect to the purchase or sale of any securities. |
|
 |
Financials, Networking, and Oil Services Index Rose
Kenneth J. Gruneisen - Passed the CAN SLIM® Master's Exam
On Tuesday the Broker/Dealer Index ($XBD +0.45%) and the Bank Index ($BKX +0.20%) both edged higher as the Retail Index ($RLX +0.09%) finished flat. The tech sector was led by the Networking Index ($NWX +0.20%) but the Semiconductor Index ($SOX -0.05%) finished flat and the Biotechnology Index ($BTK -1.10%) fell. The Gold & Silver Index ($XAU -1.78%) fell while the Oil Services Index ($OSX +0.47%) posted a small gain and the Integrated Oil Index ($XOI -0.01%) finished flat. Charts courtesy www.stockcharts.com
 PICTURED: The Bank Index ($BKX +0.20%) is consolidating within striking distance of prior highs. It found support above prior lows and promptly repaired a 200-day moving average (DMA) line violation, then rebounded above the 50 DMA line. Healthier action in recent weeks from the financial indexes is reassuring because they have been reliable leading indicators for the market.
| Oil Services |
$OSX |
140.61 |
+0.66 |
+0.47% |
-23.49% |
| Integrated Oil |
$XOI |
1,209.24 |
-0.13 |
-0.01% |
-4.63% |
| Semiconductor |
$SOX |
1,126.40 |
-0.54 |
-0.05% |
+24.26% |
| Networking |
$NWX |
458.07 |
+0.90 |
+0.20% |
+2.68% |
| Broker/Dealer |
$XBD |
234.21 |
+1.06 |
+0.45% |
+14.09% |
| Retail |
$RLX |
1,500.27 |
+1.28 |
+0.09% |
+11.71% |
| Gold & Silver |
$XAU |
85.86 |
-1.56 |
-1.78% |
+8.88% |
| Bank |
$BKX |
96.97 |
+0.19 |
+0.20% |
+5.64% |
| Biotech |
$BTK |
4,136.22 |
-46.06 |
-1.10% |
+34.51% |
|
|
|
 |
Powerboat Maker Hit Another New 52-Week High
Kenneth J. Gruneisen - Passed the CAN SLIM® Master's Exam
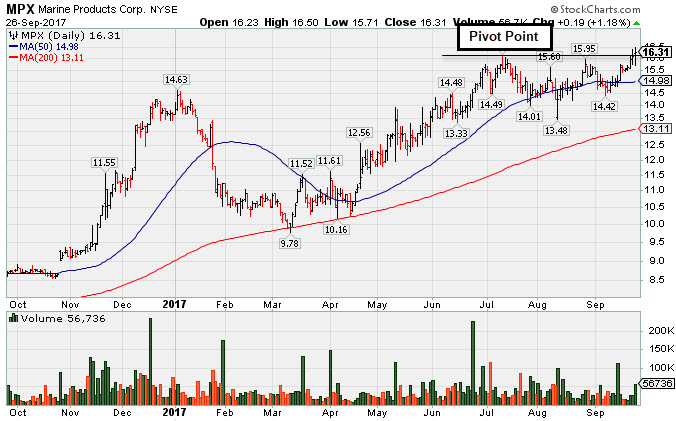
Marine Products Corp (MPX +$0.19 or +1.18% to $16.31) hit a new high with today's 5th consecutive gain on ever-increasing volume. In the earlier mid-day report it was highlighted in yellow with pivot point cited based on its 7/12/17 high plus 10 cents (read here). Subsequent gains above the pivot point backed by at least +40% above average volume and a strong close could help clinch a convincing technical buy signal.
MPX is a high-ranked leader in the Recreational Vehicles Industry Group. It found support near its 50-day moving average (DMA) line as it formed a sound base since noted in the 8/15/17 mid-day report - "Reported earnings +38% on +10% sales revenues for the Jun '17 quarter. Three of the past 4 quarterly earnings increases were above the +25% minimum guideline (C criteria), however sequential comparisons show sales revenues growth decelerating. Its annual earnings (A criteria) history has been good."
The number of top-rated funds owning its share rose from 116 in Sep '16 to 122 in Jun '17 (I criteria). Its current Up/Down Volume Ratio of 1.5 is an unbiased indication its shares have been under accumulation over the past 50 days. Its small supply of only 7.7 million shares in the public float and 34.9 million shares outstanding (S criteria) can contribute to greater price volatility in the event of institutional buying or selling. |
|
|
Color Codes Explained :
Y - Better candidates highlighted by our
staff of experts.
G - Previously featured
in past reports as yellow but may no longer be buyable under the
guidelines.
***Last / Change / Volume data in this table is the closing quote data***
Symbol/Exchange
Company Name
Industry Group |
PRICE |
CHANGE
(%Change) |
Day High |
Volume
(% DAV)
(% 50 day avg vol) |
52 Wk Hi
% From Hi |
Featured
Date |
Price
Featured |
Pivot Featured |
|
Max Buy |
MPX
-
NYSE
Marine Products Corp
AUTOMOTIVE - Recreational Vehicles
|
$16.31
|
+0.19
1.18% |
$16.50
|
56,724
162.07% of 50 DAV
50 DAV is 35,000
|
$16.44
-0.79%
|
9/26/2017
|
$16.30
|
PP = $16.35
|
|
MB = $17.17
|
 Most Recent Note - 9/26/2017 6:00:32 PM
Y - Hit a new high with today's 5th consecutive gain on ever-increasing volume. It was highlighted in yellow with pivot point cited based on its 7/12/17 high plus 10 cents in the earlier mid-day report. A volume-driven gains and strong close could help clinch a convincing technical buy signal. Found support near its 50 DMA line as it formed a sound base since noted in the 8/15/17 mid-day report - "Reported earnings +38% on +10% sales revenues for the Jun '17 quarter. Three of the past 4 quarterly earnings increases were above the +25% minimum guideline (C criteria), however sequential comparisons show sales revenues growth decelerating. Its annual earnings (A criteria) history has been good." See the latest FSU analysis for more details and an annotated graph.
>>> FEATURED STOCK ARTICLE : Powerboat Maker Hit Another New 52-Week High - 9/26/2017 |
View all notes |
Set NEW NOTE alert |
Company Profile |
SEC
News |
Chart |
Request a new note
C
A
S
I |
THO
-
NYSE
Thor Industries Inc
AUTOMOTIVE - Recreational Vehicles
|
$117.24
|
+0.19
0.16% |
$118.45
|
678,723
130.52% of 50 DAV
50 DAV is 520,000
|
$117.45
-0.18%
|
8/14/2017
|
$106.67
|
PP = $110.01
|
|
MB = $115.51
|
Most Recent Note - 9/25/2017 3:18:55 PM
Y - Quietly hitting a new 52-week high today. Current Relative Strength Rating of 81 is above the 80+ minimum guideline for buy candidates under the fact-based investment system. Due to report Jul '17 quarterly earnings news on 9/27/17, and volume and volatility often increase near earnings news.
>>> FEATURED STOCK ARTICLE : Wedged to New High Then Ended the Session Weak - 9/18/2017 |
View all notes |
Set NEW NOTE alert |
Company Profile |
SEC
News |
Chart |
Request a new note
C
A
S
I |
AVGO
-
NASDAQ
Avago Technologies Ltd
ELECTRONICS - Semiconductor - Broad Line
|
$237.27
|
+1.76
0.75% |
$239.95
|
3,875,201
153.55% of 50 DAV
50 DAV is 2,523,700
|
$259.36
-8.52%
|
8/24/2017
|
$252.44
|
PP = $256.89
|
|
MB = $269.73
|
Most Recent Note - 9/26/2017 6:15:21 PM
G - Halted its slide with a volume-driven gain today. Found support after undercutting recent lows in the $238-240 area with volume-driven losses triggering more worrisome technical sell signals. A rebound above the 50 DMA line ($248) is needed for its outlook to improve.
>>> FEATURED STOCK ARTICLE : Technical Deterioration Raises Concerns - 9/21/2017 |
View all notes |
Set NEW NOTE alert |
Company Profile |
SEC
News |
Chart |
Request a new note
C
A
S
I |
EW
-
NYSE
Edwards Lifesciences Cp
HEALTH SERVICES - Medical Appliances and Equipment
|
$110.59
|
+0.13
0.12% |
$111.70
|
830,641
63.95% of 50 DAV
50 DAV is 1,298,900
|
$121.75
-9.17%
|
7/11/2017
|
$117.23
|
PP = $121.85
|
|
MB = $127.94
|
Most Recent Note - 9/26/2017 6:07:19 PM
G - Met resistance at its 50 DMA line in recent weeks, and a rebound above its downward sloping 50 DMA line ($114.11) is needed for its outlook to improve. Its Relative Strength Rating has slumped to 45, below the 80+ minimum guideline for buy candidates, and it is -9.2% off its all-time high. Fundamentals remain strong.
>>> FEATURED STOCK ARTICLE : Positive Reversal After Slumping to New Lows - 9/6/2017 |
View all notes |
Set NEW NOTE alert |
Company Profile |
SEC
News |
Chart |
Request a new note
C
A
S
I |
YY
-
NASDAQ
YY Inc Ads
INTERNET - Internet Service Providers
|
$84.42
|
+6.95
8.97% |
$85.59
|
3,541,540
209.43% of 50 DAV
50 DAV is 1,691,000
|
$83.00
1.71%
|
9/25/2017
|
$80.26
|
PP = $83.10
|
|
MB = $87.26
|
Most Recent Note - 9/26/2017 1:08:11 PM
Y - Hitting a new 52-week high with today's considerable volume-driven gain. Encountered distributional pressure on the prior session after highlighted in yellow with pivot point based on its 8/10/17 high plus 10 cents. Gains above the pivot point must be backed by at least +40% above average volume to trigger a proper technical buy signal. This Chinese Internet - Content firm found support in recent weeks above its 50 DMA line. Completed a new Public Offering on 8/16/17. Reported Jun '17 quarterly earnings +53% on +29% sales revenues, its 4th consecutive strong quarterly report above the +25% minimum (C criteria). See the latest FSU analysis for more details and a new annotated graph.
>>> FEATURED STOCK ARTICLE : Encountered Distributional Pressure When Challenging Prior HIgh - 9/25/2017 |
View all notes |
Set NEW NOTE alert |
Company Profile |
SEC
News |
Chart |
Request a new note
C
A
S
I |
Symbol/Exchange
Company Name
Industry Group |
PRICE |
CHANGE
(%Change) |
Day High |
Volume
(% DAV)
(% 50 day avg vol) |
52 Wk Hi
% From Hi |
Featured
Date |
Price
Featured |
Pivot Featured |
|
Max Buy |
STMP
-
NASDAQ
Stamps.com Inc
INTERNET - Internet Software and Services
|
$203.00
|
-2.15
-1.05% |
$206.80
|
408,158
89.12% of 50 DAV
50 DAV is 458,000
|
$220.25
-7.83%
|
9/11/2017
|
$193.65
|
PP = $220.35
|
|
MB = $231.37
|
Most Recent Note - 9/25/2017 3:12:34 PM
Y - Reversed into the red today after 6 consecutive gains marked by light volume. The new pivot point cited was based on its 8/07/17 high plus 10 cents. Faces some near-term resistance. Subsequent volume-driven gains above the pivot point are needed to trigger a new (or add-on) technical buy signal. Recent low ($185.80 on 9/05/17) and its 50 DMA line ($188) define important near-term support where violations would trigger technical sell signals. Fundamentals remain strong.
>>> FEATURED STOCK ARTICLE : New Base Being Built After Considerable Gap Higher - 9/11/2017 |
View all notes |
Set NEW NOTE alert |
Company Profile |
SEC
News |
Chart |
Request a new note
C
A
S
I |
HTHT
-
NASDAQ
China Lodging Group Ads
LEISURE - Lodging
|
$118.36
|
+1.66
1.42% |
$122.76
|
470,493
130.33% of 50 DAV
50 DAV is 361,000
|
$126.29
-6.28%
|
9/29/2016
|
$46.12
|
PP = $47.82
|
|
MB = $50.21
|
Most Recent Note - 9/25/2017 3:13:42 PM
G - Pulling back from its all-time high with today's 4th consecutive loss, still very extended from any sound base. Recently reported earnings +19% on +18% sales revenues for the Jun '17 quarter, below the +25% minimum earnings guideline (C criteria). Its 50 DMA line ($106.51) defines near-term support.
>>> FEATURED STOCK ARTICLE : Considerable Rally However Fundamental Concerns Were Raised - 9/12/2017 |
View all notes |
Set NEW NOTE alert |
Company Profile |
SEC
News |
Chart |
Request a new note
C
A
S
I |
LMAT
-
NASDAQ
Lemaitre Vascular Inc
Medical-Products
|
$36.99
|
+0.02
0.05% |
$37.87
|
118,764
55.76% of 50 DAV
50 DAV is 213,000
|
$39.29
-5.86%
|
7/28/2017
|
$33.50
|
PP = $33.32
|
|
MB = $34.99
|
Most Recent Note - 9/22/2017 5:51:44 PM
G - Pulled back for a 4th consecutive small loss on light volume. The 50 DMA line ($34.33) defines near-term support to watch above prior highs in the $33 area. See the latest FSU analysis for more details and a new annotated graph.
>>> FEATURED STOCK ARTICLE : Quietly Pulling Back From High After More Volume-Driven Gains - 9/22/2017 |
View all notes |
Set NEW NOTE alert |
Company Profile |
SEC
News |
Chart |
Request a new note
C
A
S
I |
ESNT
-
NYSE
Essent Group Ltd
Finance-MrtgandRel Svc
|
$39.78
|
+0.79
2.03% |
$39.88
|
930,635
134.10% of 50 DAV
50 DAV is 694,000
|
$41.44
-4.01%
|
7/3/2017
|
$38.05
|
PP = $39.60
|
|
MB = $41.58
|
Most Recent Note - 9/25/2017 3:15:18 PM
Y - Still quietly consolidating just above its 50 DMA line ($38.57), and little resistance remains due to overhead supply. Completed a new Public Offering on 8/08/17.
>>> FEATURED STOCK ARTICLE : Undercut 50-Day Moving Average in Slump Toward Prior Lows - 9/5/2017 |
View all notes |
Set NEW NOTE alert |
Company Profile |
SEC
News |
Chart |
Request a new note
C
A
S
I |
OLED
-
NASDAQ
Universal Display Corp
Elec-Misc Products
|
$125.45
|
+0.50
0.40% |
$130.25
|
1,183,500
135.72% of 50 DAV
50 DAV is 872,000
|
$145.30
-13.66%
|
8/31/2017
|
$128.22
|
PP = $127.78
|
|
MB = $134.17
|
Most Recent Note - 9/25/2017 12:35:44 PM
Y - Today's 4th consecutive loss with volume running at an above average pace is raising concerns while undercutting prior highs in the $127-130 area. Its 50 DMA line ($122.07) defines the next important support to watch.
>>> FEATURED STOCK ARTICLE : Rallied Near Pivot Point But Confirming Gains Are Still Needed - 8/31/2017 |
View all notes |
Set NEW NOTE alert |
Company Profile |
SEC
News |
Chart |
Request a new note
C
A
S
I |
Symbol/Exchange
Company Name
Industry Group |
PRICE |
CHANGE
(%Change) |
Day High |
Volume
(% DAV)
(% 50 day avg vol) |
52 Wk Hi
% From Hi |
Featured
Date |
Price
Featured |
Pivot Featured |
|
Max Buy |
ANET
-
NYSE
Arista Networks Inc
TELECOMMUNICATIONS - Communication Equipment
|
$182.66
|
+1.83
1.01% |
$186.98
|
650,285
76.24% of 50 DAV
50 DAV is 853,000
|
$193.24
-5.48%
|
8/4/2017
|
$173.31
|
PP = $163.07
|
|
MB = $171.22
|
Most Recent Note - 9/25/2017 3:10:58 PM
G - Reversed into the red today after hitting yet another new all-time high. extended from any sound base and its 50 DMA line ($168.75) defines important near-term support to watch. Fundamentals remain very strong.
>>> FEATURED STOCK ARTICLE : Extended From Any Sound Base After Additional Volume-Driven Gains - 9/19/2017 |
View all notes |
Set NEW NOTE alert |
Company Profile |
SEC
News |
Chart |
Request a new note
C
A
S
I |
GRUB
-
NYSE
Grubhub Inc
COMPUTER SOFTWARE and SERVICES - Technical and System Software
|
$50.74
|
-0.95
-1.84% |
$52.12
|
2,000,315
105.22% of 50 DAV
50 DAV is 1,901,000
|
$57.61
-11.93%
|
6/21/2017
|
$47.33
|
PP = $46.94
|
|
MB = $49.29
|
Most Recent Note - 9/22/2017 12:13:07 PM
G - Gapped down today violating its 50 DMA line ($52.30) then found prompt support, rebounding near that important short-term average. More damaging losses would raise greater concerns. The next near-term support is prior highs in the $47 area. Recently reported earnings +13% on +32% sales revenues for the Jun '17 quarter, below the +25% minimum earnings guideline (C criteria) raising fundamental concerns.
>>> FEATURED STOCK ARTICLE : Touched New High With Quiet Gain From Brief Consolidation - 9/7/2017 |
View all notes |
Set NEW NOTE alert |
Company Profile |
SEC
News |
Chart |
Request a new note
C
A
S
I |
IBP
-
NYSE
Installed Building Prod
DIVERSIFIED SERVICES - Business/Management Services
|
$61.50
|
+1.70
2.84% |
$62.50
|
225,375
176.07% of 50 DAV
50 DAV is 128,000
|
$60.08
2.37%
|
9/19/2017
|
$59.15
|
PP = $60.10
|
|
MB = $63.11
|
Most Recent Note - 9/26/2017 12:28:07 PM
Y - Gain with volume running at an above average pace today has it rallying above the pivot point cited based on its 8/04/17 high plus 10 cents. Gains above a stock's pivot point must be backed by at least +40% above average volume to trigger a proper technical buy signal.
>>> FEATURED STOCK ARTICLE : Found Prompt Support Near Prior Highs and 50 Day Average - 9/13/2017 |
View all notes |
Set NEW NOTE alert |
Company Profile |
SEC
News |
Chart |
Request a new note
C
A
S
I |
NCOM
-
NASDAQ
National Commerce Corp
BANKING - Regional - Southeast Banks
|
$41.40
|
+0.70
1.72% |
$41.50
|
63,777
193.26% of 50 DAV
50 DAV is 33,000
|
$41.25
0.36%
|
4/25/2017
|
$38.95
|
PP = $40.09
|
|
MB = $42.09
|
Most Recent Note - 9/26/2017 12:44:24 PM
G - Hitting a new 52-week high with today's gain adding to a recent spurt of volume-driven gains. Relative Strength rating is currently 81, above the 80+ minimum guideline for buy candidates. Recently reported Jun '17 earnings +23% on +45% sales revenues, below the +25% minimum earnings guideline (C criteria), raising fundamental concerns.
>>> FEATURED STOCK ARTICLE : Relative Strength Rating Fell Below 80+ Minimum Guideline - 9/14/2017 |
View all notes |
Set NEW NOTE alert |
Company Profile |
SEC
News |
Chart |
Request a new note
C
A
S
I |
OLLI
-
NASDAQ
Ollie's Bargain Outlet
Retail-DiscountandVariety
|
$44.60
|
-0.45
-1.00% |
$45.40
|
551,808
98.36% of 50 DAV
50 DAV is 561,000
|
$46.25
-3.57%
|
9/8/2017
|
$45.20
|
PP = $46.18
|
|
MB = $48.49
|
Most Recent Note - 9/26/2017 6:16:58 PM
Y - Consolidating above its 50 DMA line ($44.37) and still perched near its all-time high. New pivot point cited was based on its 8/01/17 high plus 10 cents. Subsequent gains above the latest pivot point with at least the minimum +40% above average volume may trigger a proper new (or add-on) technical buy signal. Fundamentals remain strong.
>>> FEATURED STOCK ARTICLE : New Pivot Point Cited After Rebound From Below 50-Day Average - 9/8/2017 |
View all notes |
Set NEW NOTE alert |
Company Profile |
SEC
News |
Chart |
Request a new note
C
A
S
I |
Symbol/Exchange
Company Name
Industry Group |
PRICE |
CHANGE
(%Change) |
Day High |
Volume
(% DAV)
(% 50 day avg vol) |
52 Wk Hi
% From Hi |
Featured
Date |
Price
Featured |
Pivot Featured |
|
Max Buy |
HLI
-
NYSE
Houlihan Lokey Inc Cl A
Finance-Invest Bnk/Bkrs
|
$37.57
|
+0.06
0.16% |
$37.74
|
157,142
68.03% of 50 DAV
50 DAV is 231,000
|
$39.68
-5.32%
|
9/18/2017
|
$37.04
|
PP = $39.78
|
|
MB = $41.77
|
Most Recent Note - 9/25/2017 3:16:20 PM
Y - While consolidating above its 50 DMA line ($36.42) a new pivot point was cited based on its 7/26/17 plus 10 cents. Subsequent volume-driven gains for new highs may trigger a new (or add-on) technical buy signal. Subsequent losses below the recent low ($34.41 on 8/18/17) would raise more serious concerns and trigger a technical sell signal.
>>> FEATURED STOCK ARTICLE : Consolidating Near 50-Day Moving Average - 8/29/2017 |
View all notes |
Set NEW NOTE alert |
Company Profile |
SEC
News |
Chart |
Request a new note
C
A
S
I |
|
|
|
THESE ARE NOT BUY RECOMMENDATIONS!
Comments contained in the body of this report are technical
opinions only. The material herein has been obtained
from sources believed to be reliable and accurate, however,
its accuracy and completeness cannot be guaranteed.
This site is not an investment advisor, hence it does
not endorse or recommend any securities or other investments.
Any recommendation contained in this report may not
be suitable for all investors and it is not to be deemed
an offer or solicitation on our part with respect to
the purchase or sale of any securities. All trademarks,
service marks and trade names appearing in this report
are the property of their respective owners, and are
likewise used for identification purposes only.
This report is a service available
only to active Paid Premium Members.
You may opt-out of receiving report notifications
at any time. Questions or comments may be submitted
by writing to Premium Membership Services 665 S.E. 10 Street, Suite 201 Deerfield Beach, FL 33441-5634 or by calling 1-800-965-8307
or 954-785-1121.
|
|
|