***Last / Change / Volume data in this table is the closing quote data***
Symbol/Exchange
Company Name
Industry Group |
PRICE |
CHANGE
(%Change) |
Day High |
Volume
(% DAV)
(% 50 day avg vol) |
52 Wk Hi
% From Hi |
Featured
Date |
Price
Featured |
Pivot Featured |
|
Max Buy |
THO
-
NYSE
Thor Industries Inc
AUTOMOTIVE - Recreational Vehicles
|
$110.74
|
+1.73
1.59% |
$111.43
|
923,530
176.65% of 50 DAV
50 DAV is 522,800
|
$115.74
-4.32%
|
8/14/2017
|
$106.67
|
PP = $110.01
|
|
MB = $115.51
|
 Most Recent Note - 9/5/2017 7:13:55 PM
Y - Posted a gain backed by +77% above average volume and closed well above the previously cited pivot point triggering a technical buy signal. However, its current Relative Strength Rating of 77 is below the 80+ minimum guideline for buy candidates under the fact-based investment system. Very little resistance remains due to overhead supply up to its $115.74 all-time high.
>>> FEATURED STOCK ARTICLE : Slump Below 50-Day Average Hurt Technical Stance - 8/21/2017 |
View all notes |
Set NEW NOTE alert |
Company Profile |
SEC
News |
Chart |
Request a new note
C
A
S
I |
BERY
-
NYSE
Berry Plastics Group Inc
CONSUMER NON-DURABLES - Packaging and Containers
|
$56.27
|
-0.58
-1.02% |
$57.05
|
763,009
88.07% of 50 DAV
50 DAV is 866,400
|
$58.95
-4.55%
|
7/14/2017
|
$57.67
|
PP = $59.05
|
|
MB = $62.00
|
Most Recent Note - 9/1/2017 6:19:18 PM
G - Rebounded toward its 50 DMA line ($57.22) with today's gain backed by higher volume. Reported Jun '17 quarterly earnings +13% on +16% sales revenues, below the +25% minimum earnings guideline (C criteria), raising fundamental concerns.
>>> FEATURED STOCK ARTICLE : Fundamental Concerns Yet Rebound Helped Technical Stance - 8/14/2017 |
View all notes |
Set NEW NOTE alert |
Company Profile |
SEC
News |
Chart |
Request a new note
C
A
S
I |
HSKA
-
NASDAQ
Heska Corporation
DRUGS - Biotechnology
|
$99.10
|
-2.70
-2.65% |
$103.10
|
51,825
79.73% of 50 DAV
50 DAV is 65,000
|
$115.00
-13.83%
|
7/31/2017
|
$114.27
|
PP = $110.35
|
|
MB = $115.87
|
Most Recent Note - 9/5/2017 7:18:44 PM
G - Slumped back below its 50 DMA line ($100.73) closing near the session low today and its color code is changed to green. Recent lows in the $95 area define the next important support to watch
>>> FEATURED STOCK ARTICLE : Rally Above 50-Day Moving Average Line Improved Technical Stance - 8/30/2017 |
View all notes |
Set NEW NOTE alert |
Company Profile |
SEC
News |
Chart |
Request a new note
C
A
S
I |
AVGO
-
NASDAQ
Broadcom Limited
ELECTRONICS - Semiconductor - Broad Line
|
$249.05
|
-3.68
-1.46% |
$252.73
|
2,430,851
97.70% of 50 DAV
50 DAV is 2,488,000
|
$259.36
-3.98%
|
8/24/2017
|
$252.44
|
PP = $256.89
|
|
MB = $269.73
|
Most Recent Note - 9/5/2017 7:27:53 PM
Y - Color code is changed to yellow while consolidating near its 50 DMA line ($247) after enduring distributional pressure. Recent lows define the next important support in the $238-240 area. Subsequent violations would trigger more worrisome technical sell signals. Fundamentals remain strong. It has not produced volume-driven gains since highlighted in the 8/24/17 mid-day report - "Subsequent volume-driven gains above the pivot and for new highs may trigger a technical buy signal."
>>> FEATURED STOCK ARTICLE : Pullback Followed Latest Strong Earnings Report From Tech Leader - 8/25/2017 |
View all notes |
Set NEW NOTE alert |
Company Profile |
SEC
News |
Chart |
Request a new note
C
A
S
I |
EW
-
NYSE
Edwards Lifesciences Cp
HEALTH SERVICES - Medical Appliances and Equipment
|
$111.87
|
-1.44
-1.27% |
$113.53
|
1,805,310
150.52% of 50 DAV
50 DAV is 1,199,400
|
$121.75
-8.11%
|
7/11/2017
|
$117.23
|
PP = $121.85
|
|
MB = $127.94
|
Most Recent Note - 9/5/2017 7:29:22 PM
G - Slumped with higher (above average) volume today closing -8.1% off its all-time high. Relative Strength Rating has slumped to 71, below the 80+ minimum guideline for buy candidates. A rebound above its downward sloping 50 DMA line ($115.76) is needed for its outlook to improve. Fundamentals remain strong.
>>> FEATURED STOCK ARTICLE : Near 50-Day Moving Average Line, Yet Not Far Off High - 8/7/2017 |
View all notes |
Set NEW NOTE alert |
Company Profile |
SEC
News |
Chart |
Request a new note
C
A
S
I |
Symbol/Exchange
Company Name
Industry Group |
PRICE |
CHANGE
(%Change) |
Day High |
Volume
(% DAV)
(% 50 day avg vol) |
52 Wk Hi
% From Hi |
Featured
Date |
Price
Featured |
Pivot Featured |
|
Max Buy |
STMP
-
NASDAQ
Stamps.com Inc
INTERNET - Internet Software and Services
|
$190.50
|
-1.60
-0.83% |
$192.15
|
343,966
71.66% of 50 DAV
50 DAV is 480,000
|
$220.25
-13.51%
|
5/24/2017
|
$133.10
|
PP = $136.10
|
|
MB = $142.91
|
Most Recent Note - 8/31/2017 2:47:25 PM
G - Very extended from any sound base. Its 50 DMA line ($172) defines near-term support above prior highs in the $156 area. Fundamentals remain strong.
>>> FEATURED STOCK ARTICLE : Blasted Higher After Latest Strong Earnings Report - 8/11/2017 |
View all notes |
Set NEW NOTE alert |
Company Profile |
SEC
News |
Chart |
Request a new note
C
A
S
I |
HTHT
-
NASDAQ
China Lodging Group Ads
LEISURE - Lodging
|
$113.75
|
-1.87
-1.62% |
$116.26
|
243,497
77.79% of 50 DAV
50 DAV is 313,000
|
$118.00
-3.60%
|
9/29/2016
|
$46.12
|
PP = $47.82
|
|
MB = $50.21
|
Most Recent Note - 8/30/2017 6:34:47 PM
G - Rebounded toward its all-time high with today's gain on lighter volume. Very extended from any sound base. Recently reported earnings +19% on +18% sales revenues for the Jun '17 quarter, below the +25% minimum earnings guideline (C criteria). Its 50 DMA line ($94.61) defines support above prior highs in the $88 area.
>>> FEATURED STOCK ARTICLE : Extended From Sound Base With Earnings News Due Next Week - 8/9/2017 |
View all notes |
Set NEW NOTE alert |
Company Profile |
SEC
News |
Chart |
Request a new note
C
A
S
I |
LMAT
-
NASDAQ
Lemaitre Vascular Inc
Medical-Products
|
$37.17
|
+0.57
1.56% |
$37.90
|
314,175
150.32% of 50 DAV
50 DAV is 209,000
|
$37.50
-0.88%
|
7/28/2017
|
$33.50
|
PP = $33.32
|
|
MB = $34.99
|
Most Recent Note - 9/5/2017 7:22:38 PM
G - Hit another new all-time high with today's gain backed by +50% above average volume, getting more extended from any sound base. Prior highs and the 50 DMA line define near-term support to watch in the $33 area.
>>> FEATURED STOCK ARTICLE : Volume-Driven Gain for New High And Strong Finish Bode Well - 8/28/2017 |
View all notes |
Set NEW NOTE alert |
Company Profile |
SEC
News |
Chart |
Request a new note
C
A
S
I |
BEAT
-
NASDAQ
BioTelemetry Inc
Medical-Services
|
$37.75
|
+0.15
0.40% |
$38.25
|
257,335
61.43% of 50 DAV
50 DAV is 418,900
|
$37.78
-0.07%
|
2/14/2017
|
$25.10
|
PP = $24.55
|
|
MB = $25.78
|
Most Recent Note - 8/30/2017 6:37:59 PM
G - Posted a gain today on light volume for its second-best close ever. Fundamental concerns remain. Jun '17 quarterly earnings rose +10% on +10% sales revenues, its 2nd consecutive quarterly comparison below the +25% minimum earnings guideline (C criteria). Its 50 DMA line ($34.08) defines near-term support along with prior lows.
>>> FEATURED STOCK ARTICLE : Technically Strong Despite Recent Fundamental Concerns - 8/17/2017 |
View all notes |
Set NEW NOTE alert |
Company Profile |
SEC
News |
Chart |
Request a new note
C
A
S
I |
ESNT
-
NYSE
Essent Group Ltd
Finance-MrtgandRel Svc
|
$37.30
|
-1.68
-4.31% |
$38.83
|
532,670
84.15% of 50 DAV
50 DAV is 633,000
|
$41.44
-9.99%
|
7/3/2017
|
$38.05
|
PP = $39.60
|
|
MB = $41.58
|
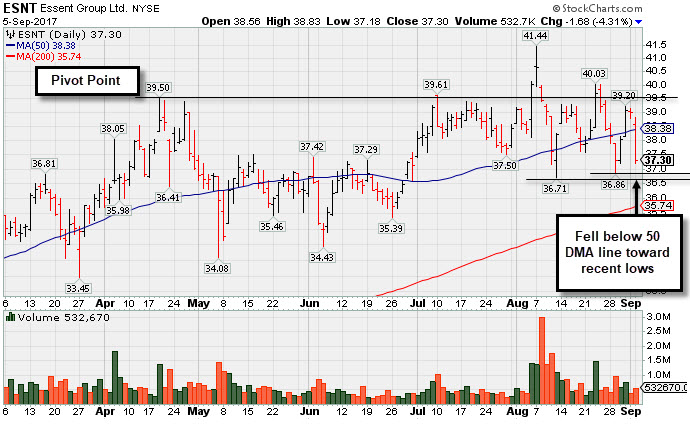
Most Recent Note - 9/5/2017 7:15:27 PM
G - Slumped below its 50 DMA line ($38.38) hurting its outlook and its color code is changed to green. Completed a new Public Offering on 8/08/17. Prior lows ($36.71 on 8/11/17) and its 200 DMA line define near-term support in the $35-36 area. See the latest FSU analysis for more details and a new annotated graph.
>>> FEATURED STOCK ARTICLE : Undercut 50-Day Moving Average in Slump Toward Prior Lows - 9/5/2017 |
View all notes |
Set NEW NOTE alert |
Company Profile |
SEC
News |
Chart |
Request a new note
C
A
S
I |
Symbol/Exchange
Company Name
Industry Group |
PRICE |
CHANGE
(%Change) |
Day High |
Volume
(% DAV)
(% 50 day avg vol) |
52 Wk Hi
% From Hi |
Featured
Date |
Price
Featured |
Pivot Featured |
|
Max Buy |
OLED
-
NASDAQ
Universal Display Corp
Elec-Misc Products
|
$129.70
|
+2.75
2.17% |
$130.00
|
1,320,501
153.01% of 50 DAV
50 DAV is 863,000
|
$130.65
-0.73%
|
8/31/2017
|
$128.22
|
PP = $127.78
|
|
MB = $134.17
|
Most Recent Note - 9/5/2017 7:35:36 PM
Y - Posted a big gain today with +53% above average volume for a best-ever close, rallying from a "double bottom" base and triggering a technical buy signal. Highlighted in yellow in the 8/31/17 mid-day report with a new pivot point cited based on its 7/26/17 high. No resistance remains due to overhead supply. See the latest FSU analysis for additional gains and an annotated graph.
>>> FEATURED STOCK ARTICLE : Rallied Near Pivot Point But Confirming Gains Are Still Needed - 8/31/2017 |
View all notes |
Set NEW NOTE alert |
Company Profile |
SEC
News |
Chart |
Request a new note
C
A
S
I |
VEEV
-
NYSE
Veeva Systems Inc Cl A
Computer Sftwr-Medical
|
$58.72
|
-1.00
-1.67% |
$59.55
|
1,715,884
127.10% of 50 DAV
50 DAV is 1,350,000
|
$68.07
-13.73%
|
7/24/2017
|
$65.91
|
PP = $68.17
|
|
MB = $71.58
|
Most Recent Note - 9/1/2017 6:15:08 PM
G - Posted a 5th consecutive gain. Gapped down on 8/25/17 violating its 50 DMA line and undercutting prior lows triggering technical sell signals. A rebound above the 50 DMA line ($62.37) is needed for its outlook to improve. Fundamentals remain strong. See the latest FSU analysis for more details and a new annotated graph.
>>> FEATURED STOCK ARTICLE : Rebounding After gap Down Violated 50-Day Average and Prior Lows - 9/1/2017 |
View all notes |
Set NEW NOTE alert |
Company Profile |
SEC
News |
Chart |
Request a new note
C
A
S
I |
ANET
-
NYSE
Arista Networks Inc
TELECOMMUNICATIONS - Communication Equipment
|
$175.23
|
-2.26
-1.27% |
$177.56
|
809,085
97.60% of 50 DAV
50 DAV is 829,000
|
$179.71
-2.49%
|
8/4/2017
|
$173.31
|
PP = $163.07
|
|
MB = $171.22
|
Most Recent Note - 8/30/2017 6:36:44 PM
G - Hit a new all-time high today. Stubbornly held its ground with recent volume totals cooling, a sign few investors are headed for the exit. Prior highs in the $162 area define initial support to watch above its 50 DMA line ($160). Fundamentals remain very strong.
>>> FEATURED STOCK ARTICLE : Gapped Up After Earnings Repairing 50-Day Moving Average Violation - 8/23/2017 |
View all notes |
Set NEW NOTE alert |
Company Profile |
SEC
News |
Chart |
Request a new note
C
A
S
I |
GRUB
-
NYSE
Grubhub Inc
COMPUTER SOFTWARE and SERVICES - Technical and System Software
|
$56.30
|
+0.24
0.43% |
$57.29
|
1,559,314
84.56% of 50 DAV
50 DAV is 1,844,000
|
$57.28
-1.71%
|
6/21/2017
|
$47.33
|
PP = $46.94
|
|
MB = $49.29
|
Most Recent Note - 8/30/2017 6:31:59 PM
G - Posted a big gain today with below average volume for its second-best close ever. Stubbornly held its ground near its all-time high. Its 50 DMA line ($48.87) defines near-term support above prior highs in the $46-47 area. Recently reported earnings +13% on +32% sales revenues for the Jun '17 quarter, below the +25% minimum earnings guideline (C criteria) raising fundamental concerns.
>>> FEATURED STOCK ARTICLE : Spiked Into New High Territory Despite Sub Par Earnings News - 8/8/2017 |
View all notes |
Set NEW NOTE alert |
Company Profile |
SEC
News |
Chart |
Request a new note
C
A
S
I |
IBP
-
NYSE
Installed Building Prod
DIVERSIFIED SERVICES - Business/Management Services
|
$55.25
|
-1.60
-2.81% |
$57.40
|
197,549
177.97% of 50 DAV
50 DAV is 111,000
|
$60.00
-7.92%
|
6/13/2017
|
$54.25
|
PP = $55.55
|
|
MB = $58.33
|
Most Recent Note - 9/5/2017 7:20:18 PM
Y - Down with higher volume today while falling toward its 50 DMA line ($54.45) and prior lows defining near-term support. More damaging losses would raise greater concerns.
>>> FEATURED STOCK ARTICLE : Consolidating Near Prior High Following Breakout - 8/18/2017 |
View all notes |
Set NEW NOTE alert |
Company Profile |
SEC
News |
Chart |
Request a new note
C
A
S
I |
Symbol/Exchange
Company Name
Industry Group |
PRICE |
CHANGE
(%Change) |
Day High |
Volume
(% DAV)
(% 50 day avg vol) |
52 Wk Hi
% From Hi |
Featured
Date |
Price
Featured |
Pivot Featured |
|
Max Buy |
NCOM
-
NASDAQ
National Commerce Corp
BANKING - Regional - Southeast Banks
|
$39.30
|
-0.55
-1.38% |
$39.85
|
28,732
95.77% of 50 DAV
50 DAV is 30,000
|
$41.25
-4.73%
|
4/25/2017
|
$38.95
|
PP = $40.09
|
|
MB = $42.09
|
Most Recent Note - 8/31/2017 2:43:12 PM
G - Consolidating in a tight range near its 50 DMA line ($39.78). Recently reported Jun '17 earnings +23% on +45% sales revenues, below the +25% minimum earnings guideline (C criteria), raising fundamental concerns.
>>> FEATURED STOCK ARTICLE : Consolidating Near 50-day Moving Average Line - 8/16/2017 |
View all notes |
Set NEW NOTE alert |
Company Profile |
SEC
News |
Chart |
Request a new note
C
A
S
I |
OLLI
-
NASDAQ
Ollie's Bargain Outlet
Retail-DiscountandVariety
|
$43.35
|
+0.65
1.52% |
$43.80
|
652,864
96.29% of 50 DAV
50 DAV is 678,000
|
$46.08
-5.91%
|
7/17/2017
|
$43.96
|
PP = $44.18
|
|
MB = $46.39
|
Most Recent Note - 9/1/2017 6:17:33 PM
G - Quietly rebounded toward its 50 DMA line ($43.32) today, but it needs gains above that important short-term average for its outlook to improve. Reported earnings +29% on +21% sales revenues for the Jul '17 quarter, continuing its strong earnings track record. In recent weeks it failed to produce confirming gains above the latest pivot point backed by at least the minimum +40% above average volume necessary to trigger a proper new (or add-on) technical buy signal.
>>> FEATURED STOCK ARTICLE : Quietly Consolidating Above 50 Day Moving Average Near High - 8/10/2017 |
View all notes |
Set NEW NOTE alert |
Company Profile |
SEC
News |
Chart |
Request a new note
C
A
S
I |
HLI
-
NYSE
Houlihan Lokey Inc Cl A
Finance-Invest Bnk/Bkrs
|
$35.70
|
-0.57
-1.57% |
$36.26
|
289,669
150.87% of 50 DAV
50 DAV is 192,000
|
$39.68
-10.03%
|
5/10/2017
|
$35.85
|
PP = $35.05
|
|
MB = $36.80
|
Most Recent Note - 9/5/2017 7:31:20 PM
G - Volume was higher behind today's loss while slumping back below its 50 DMA line ($36.09) and its color code is changed to green. Subsequent damaging losses below the recent low ($34.41 on 8/18/17) would raise more serious concerns and trigger a technical sell signal.
>>> FEATURED STOCK ARTICLE : Consolidating Near 50-Day Moving Average - 8/29/2017 |
View all notes |
Set NEW NOTE alert |
Company Profile |
SEC
News |
Chart |
Request a new note
C
A
S
I |