You are not logged in.
This means you
CAN ONLY VIEW reports that were published prior to Thursday, March 20, 2025.
You
MUST UPGRADE YOUR MEMBERSHIP if you want to see any current reports.
AFTER MARKET UPDATE - TUESDAY, AUGUST 29TH, 2017
Previous After Market Report Next After Market Report >>>
|
|
|
|
DOW |
+56.97 |
21,865.37 |
+0.26% |
|
Volume |
680,681,680 |
-3% |
|
Volume |
1,636,227,979 |
+5% |
|
NASDAQ |
+18.87 |
6,301.89 |
+0.30% |
|
Advancers |
1,408 |
48% |
|
Advancers |
1,443 |
52% |
|
S&P 500 |
+2.06 |
2,446.30 |
+0.08% |
|
Decliners |
1,496 |
51% |
|
Decliners |
1,348 |
48% |
|
Russell 2000 |
+1.45 |
1,383.68 |
+0.11% |
|
52 Wk Highs |
67 |
|
|
52 Wk Highs |
70 |
|
|
S&P 600 |
+0.12 |
828.26 |
+0.01% |
|
52 Wk Lows |
69 |
|
|
52 Wk Lows |
51 |
|
|
 |
Major Indices Finished Near Session Highs After Positive Reversal
Kenneth J. Gruneisen - Passed the CAN SLIM® Master's Exam
Stocks recovered from early losses to finish in positive territory Tuesday. The Dow, which fell as many as 135 points ended the day with a gain of 57 to close at 21865. The S&P 500 rebounded from down 16 to up 2 points at 2446. The Nasdaq Composite erased a 54 point loss to close 19 higher at 6301. Volume totals reported were mixed, lighter than the prior session totals on the NYSE and higher on the Nasdaq exchange. Breadth was nearly even but advancers very narrowly trailed decliners on the NYSE while advancers slightly outnumbered decliners on the Nasdaq exchange. There were 30 high-ranked companies from the Leaders List that made new 52-week highs and were listed on the BreakOuts Page, versus the total of 34 on the prior session. New 52-week highs outnumbered new 52-week lows on the Nasdaq exchange but new lows slightly outnumbered new highs on the NYSE. The Featured Stocks Page provides the latest analysis on noteworthy high-ranked leaders. Charts used courtesy of www.stockcharts.com
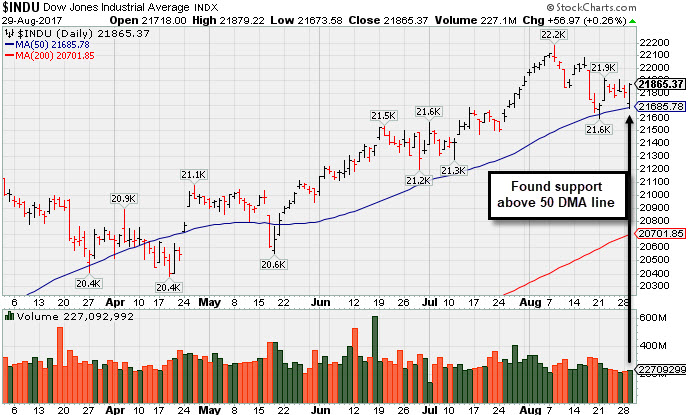 PICTURED: The Dow Jones Industrial Average found support above its 50-day moving average (DMA) line after damaging volume-driven losses. The recent low defines important near-term support to watch. The major averages' (M criteria) prior uptrend has been under pressure while leadership has been thinning. Investors should be ready to raise cash and reduce exposure to stocks by selling individual issues on a case-by-case basis as they trigger technical sell signals.
U.S. equities ended a choppy session higher amid renewed geopolitical concerns after North Korea launched a missile over Japan. Investors also spent the day weighing the impact of Hurricane Harvey in Texas. On the economic front, reports showed consumer confidence unexpectedly increased to 122.9 in August and home prices in 20-major U.S. cities grew 5.65% year-over-year in June.
In earnings news, Best Buy (BBY -11.93%) fell despite posting better-than-expected results and an improved outlook. Finish Line (FINL -18.43%) sank following the sporting goods store’s reduced guidance. Industrials were the best performing group. United Technologies (UTX +2.9%) and Rockwell Collins (COL +2.15%) on reports the two are close to reaching a merger agreement. Materials were the down the most with miner Freeport McMoRan (FCX -2.05%) falling.
Treasuries advanced but off their best levels of the day. The 10-year note was up 8/32 to yield 2.13%. In commodities, NYMEX WTI crude ended a choppy session down 0.4% to $46.37/barrel. COMEX gold was up 0.3% to $1313.10/ounce.
|
 Kenneth J. Gruneisen started out as a licensed stockbroker in August 1987, a couple of months prior to the historic stock market crash that took the Dow Jones Industrial Average down -22.6% in a single day. He has published daily fact-based fundamental and technical analysis on high-ranked stocks online for two decades. Through FACTBASEDINVESTING.COM, Kenneth provides educational articles, news, market commentary, and other information regarding proven investment systems that work in good times and bad.
Comments contained in the body of this report are technical opinions only and are not necessarily those of Gruneisen Growth Corp. The material herein has been obtained from sources believed to be reliable and accurate, however, its accuracy and completeness cannot be guaranteed. Our firm, employees, and customers may effect transactions, including transactions contrary to any recommendation herein, or have positions in the securities mentioned herein or options with respect thereto. Any recommendation contained in this report may not be suitable for all investors and it is not to be deemed an offer or solicitation on our part with respect to the purchase or sale of any securities. |
|
 |
Biotech, Semiconductor, and Commodity-Linked Groups Rose
Kenneth J. Gruneisen - Passed the CAN SLIM® Master's Exam
On Tuesday the Broker/Dealer Index ($XBD -0.48%) and Bank Index ($BKX -0.75%) both created a drag on the major averages while the Retail Index ($RLX -0.02%) held its ground. The tech sector was led by the Biotechnology Index ($BTK +1.17%), and the Semiconductor Index ($SOX +0.21%) inched higher, but the Networking Index ($NWX -0.08%) finsihed flat. The Gold & Silver Index ($XAU +0.22%) and Oil Services Index ($OSX +0.57%%) each posted a small gain as the Integrated Oil Index ($XOI -0.25%) edged lower. Charts courtesy www.stockcharts.com
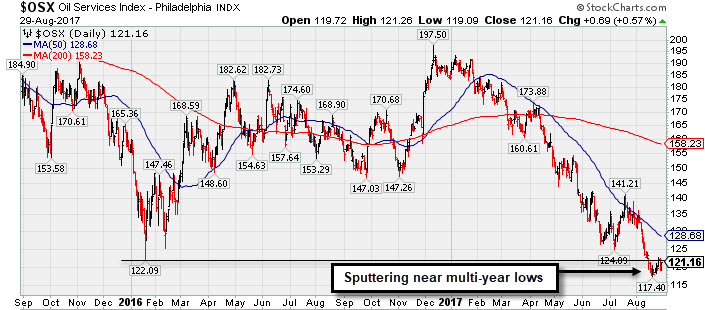 PICTURED: The Oil Services Index ($OSX +0.57%) is sputtering at multi-year lows well below its 50-day and 200-day moving average (DMA) lines.
| Oil Services |
$OSX |
121.16 |
+0.68 |
+0.56% |
-34.08% |
| Integrated Oil |
$XOI |
1,096.89 |
-2.72 |
-0.25% |
-13.49% |
| Semiconductor |
$SOX |
1,084.86 |
+2.24 |
+0.21% |
+19.68% |
| Networking |
$NWX |
455.79 |
-0.36 |
-0.08% |
+2.17% |
| Broker/Dealer |
$XBD |
225.00 |
-1.09 |
-0.48% |
+9.61% |
| Retail |
$RLX |
1,450.01 |
-0.35 |
-0.02% |
+7.97% |
| Gold & Silver |
$XAU |
89.38 |
+0.20 |
+0.22% |
+13.34% |
| Bank |
$BKX |
92.98 |
-0.70 |
-0.75% |
+1.30% |
| Biotech |
$BTK |
4,046.30 |
+46.86 |
+1.17% |
+31.59% |
|
|
|
 |
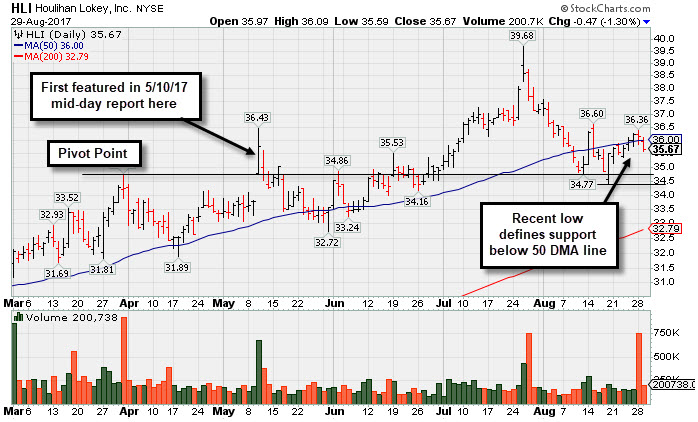
Consolidating Near 50-Day Moving Average
Kenneth J. Gruneisen - Passed the CAN SLIM® Master's Exam
Houlihan Lokey Inc (HLI -$0.47 or -1.30% to $35.67) ended lower today and volume was heavy behind its prior loss. It has been consolidating near its 50-day moving average (DMA) line ($35.99). Subsequent damaging losses below the recent low ($34.41 on 8/18/17) would raise serious concerns and trigger a technical sell signal.
HLI was last shown in this FSU section on 7/27/17 with an annotated graph, "Extended Leader Encounters Distributional Pressure". It was highlighted in yellow in the 5/10/17 mid-day report (read here) with pivot point cited based on its 3/31/17 high plus 10 cents after an orderly flat base. Its considerable gain backed by +174% above average volume had triggered a technical buy signal.
The high ranked Finance - Invest Bank//Broker firm reported earnings +43% on +20% sales revenues for the Jun '17 quarter, and 3 of the past 4 quarterly comparisons were above the +25% minimum earning guideline (C criteria). Annual earnings growth (A criteria) history is a good match with the fact-based investment system's guidelines. It has an Earnings Per share rating of 97.
It has a Timeliness rating of B and a Sponsorship rating of C. The number of top-rated funds owning its shares rose from 165 in Jun '16 to 263 in Jun '17, a reassuring sign concerning the I criteria. Its small supply of only 23.1 million shares (S criteria) in the public float can contribute to greater price volatility in the event of institutional buying or selling.
|
|
|
Color Codes Explained :
Y - Better candidates highlighted by our
staff of experts.
G - Previously featured
in past reports as yellow but may no longer be buyable under the
guidelines.
***Last / Change / Volume data in this table is the closing quote data***
Symbol/Exchange
Company Name
Industry Group |
PRICE |
CHANGE
(%Change) |
Day High |
Volume
(% DAV)
(% 50 day avg vol) |
52 Wk Hi
% From Hi |
Featured
Date |
Price
Featured |
Pivot Featured |
|
Max Buy |
THO
-
NYSE
Thor Industries Inc
AUTOMOTIVE - Recreational Vehicles
|
$107.37
|
-1.34
-1.23% |
$108.60
|
589,709
110.85% of 50 DAV
50 DAV is 532,000
|
$115.74
-7.23%
|
8/14/2017
|
$106.67
|
PP = $110.01
|
|
MB = $115.51
|
Most Recent Note - 8/28/2017 1:38:51 PM
Y - Gapped up today rebounding above its 50 DMA line ($105) helping its technical stance and outlook improve and its color code is changed to yellow. Encountered distributional pressure after earlier gains lifted it above the previously cited pivot point and challenged its all-time high. A strong finish may help clinch a convincing new (or add-on) technical buy signal, however its current Relative Strength Rating of 79 is just below the 80+ minimum guideline for buy candidates under the fact-based investment system.
>>> FEATURED STOCK ARTICLE : Slump Below 50-Day Average Hurt Technical Stance - 8/21/2017 |
View all notes |
Set NEW NOTE alert |
Company Profile |
SEC
News |
Chart |
Request a new note
C
A
S
I |
BERY
-
NYSE
Berry Plastics Group Inc
CONSUMER NON-DURABLES - Packaging and Containers
|
$55.52
|
-0.17
-0.31% |
$56.08
|
1,196,096
139.19% of 50 DAV
50 DAV is 859,300
|
$58.95
-5.82%
|
7/14/2017
|
$57.67
|
PP = $59.05
|
|
MB = $62.00
|
Most Recent Note - 8/28/2017 6:08:56 PM
G - Testing the recent low that defines important near-term support ($55.60 on 8/03/17), it slumped further below its 50 DMA line ($57.35) today and finished near the session low with a loss on higher volume, raising concerns. Reported Jun '17 quarterly earnings +13% on +16% sales revenues, below the +25% minimum earnings guideline (C criteria), raising fundamental concerns.
>>> FEATURED STOCK ARTICLE : Fundamental Concerns Yet Rebound Helped Technical Stance - 8/14/2017 |
View all notes |
Set NEW NOTE alert |
Company Profile |
SEC
News |
Chart |
Request a new note
C
A
S
I |
HSKA
-
NASDAQ
Heska Corporation
DRUGS - Biotechnology
|
$99.21
|
+1.53
1.57% |
$99.45
|
57,936
90.53% of 50 DAV
50 DAV is 64,000
|
$115.00
-13.73%
|
7/31/2017
|
$114.27
|
PP = $110.35
|
|
MB = $115.87
|
Most Recent Note - 8/28/2017 6:11:36 PM
G - Sputtering below its 50 DMA line ($100.33) which recently acted as resistance when rebounding. Encountered distributional pressure since highlighted in yellow in the 7/31/17 mid-day report with pivot point cited based on its high hit on 5/01/17 plus 10 cents. Failed to produce confirming gains since repeatedly noted - "Subsequent gains and a strong finish above its pivot point may clinch a convincing technical buy signal. Small supply of only 6 million shares in the public float (S criteria) can contribute to greater price volatility in the event of institutional buying or selling."
>>> FEATURED STOCK ARTICLE : Small Supply of Shares and Closed In Lower Half of Intra-day Range - 7/31/2017 |
View all notes |
Set NEW NOTE alert |
Company Profile |
SEC
News |
Chart |
Request a new note
C
A
S
I |
AVGO
-
NASDAQ
Broadcom Limited
ELECTRONICS - Semiconductor - Broad Line
|
$241.73
|
-1.52
-0.62% |
$244.58
|
3,334,397
134.18% of 50 DAV
50 DAV is 2,485,000
|
$259.36
-6.80%
|
8/24/2017
|
$252.44
|
PP = $256.89
|
|
MB = $269.73
|
 Most Recent Note - 8/29/2017 12:34:23 PM
G - Prior low ($238.70) on 8/11/17) defines the next technical support level to watch. Volume-driven losses violated its 50 DMA line ($246) raising concerns and triggering a technical sell signal. Reported earnings +42% on +18% sales revenues for the Jul '17 quarter. Volume and volatility often increase near earnings news. It was highlighted in the 8/24/17 mid-day report - "Subsequent volume-driven gains above the pivot and for new highs may trigger a technical buy signal. Prior quarterly and annual earnings history (C and A criteria) is a good match with the fact-based investment system's fundamental guidelines." See the latest FSU analysis for more details and an annotated graph.
>>> FEATURED STOCK ARTICLE : Pullback Followed Latest Strong Earnings Report From Tech Leader - 8/25/2017 |
View all notes |
Set NEW NOTE alert |
Company Profile |
SEC
News |
Chart |
Request a new note
C
A
S
I |
EW
-
NYSE
Edwards Lifesciences Cp
HEALTH SERVICES - Medical Appliances and Equipment
|
$111.83
|
-1.28
-1.13% |
$113.25
|
1,365,951
112.76% of 50 DAV
50 DAV is 1,211,400
|
$121.75
-8.15%
|
7/11/2017
|
$117.23
|
PP = $121.85
|
|
MB = $127.94
|
Most Recent Note - 8/29/2017 5:55:31 PM
G - Slumped with higher (near average) volume today closing -8.1% off its all-time high. Relative Strength Rating has slumped to 71, below the 80+ minimum guideline for buy candidates. A rebound above its downward sloping 50 DMA line ($116) is needed for its outlook to improve. Fundamentals remain strong.
>>> FEATURED STOCK ARTICLE : Near 50-Day Moving Average Line, Yet Not Far Off High - 8/7/2017 |
View all notes |
Set NEW NOTE alert |
Company Profile |
SEC
News |
Chart |
Request a new note
C
A
S
I |
Symbol/Exchange
Company Name
Industry Group |
PRICE |
CHANGE
(%Change) |
Day High |
Volume
(% DAV)
(% 50 day avg vol) |
52 Wk Hi
% From Hi |
Featured
Date |
Price
Featured |
Pivot Featured |
|
Max Buy |
STMP
-
NASDAQ
Stamps.com Inc
INTERNET - Internet Software and Services
|
$191.60
|
+1.00
0.52% |
$194.00
|
223,979
46.37% of 50 DAV
50 DAV is 483,000
|
$220.25
-13.01%
|
5/24/2017
|
$133.10
|
PP = $136.10
|
|
MB = $142.91
|
Most Recent Note - 8/29/2017 5:58:59 PM
G - Retreated from its all-time high, and it is still very extended from any sound base. Its 50 DMA line ($170) defines near-term support above prior highs in the $156 area. Fundamentals remain strong.
>>> FEATURED STOCK ARTICLE : Blasted Higher After Latest Strong Earnings Report - 8/11/2017 |
View all notes |
Set NEW NOTE alert |
Company Profile |
SEC
News |
Chart |
Request a new note
C
A
S
I |
HTHT
-
NASDAQ
China Lodging Group Ads
LEISURE - Lodging
|
$107.15
|
+0.84
0.79% |
$107.61
|
311,178
99.10% of 50 DAV
50 DAV is 314,000
|
$118.00
-9.19%
|
9/29/2016
|
$46.12
|
PP = $47.82
|
|
MB = $50.21
|
Most Recent Note - 8/28/2017 1:13:13 PM
G - Above average volume is behind today's 4th consecutive loss. Retreating from its all-time high after repeatedly noted - "Very extended from any sound base. Last week it reported earnings +19% on +18% sales revenues for the Jun '17 quarter, below the +25% minimum earnings guideline (C criteria). Its 50 DMA line ($91.34) defines support above prior highs in the $88 area."
>>> FEATURED STOCK ARTICLE : Extended From Sound Base With Earnings News Due Next Week - 8/9/2017 |
View all notes |
Set NEW NOTE alert |
Company Profile |
SEC
News |
Chart |
Request a new note
C
A
S
I |
LMAT
-
NASDAQ
Lemaitre Vascular Inc
Medical-Products
|
$36.99
|
+0.20
0.54% |
$37.16
|
271,878
133.27% of 50 DAV
50 DAV is 204,000
|
$37.11
-0.32%
|
7/28/2017
|
$33.50
|
PP = $33.32
|
|
MB = $34.99
|
Most Recent Note - 8/28/2017 6:06:29 PM
G - Gapped up today hitting another new all-time high with a big gain backed by +134% above average volume after a brief consolidation. Color code was changed to green after rising more than +5% above the previous pivot point cited. See the latest FSU analysis for more details and a new annotated graph.
>>> FEATURED STOCK ARTICLE : Volume-Driven Gain for New High And Strong Finish Bode Well - 8/28/2017 |
View all notes |
Set NEW NOTE alert |
Company Profile |
SEC
News |
Chart |
Request a new note
C
A
S
I |
BEAT
-
NASDAQ
BioTelemetry Inc
Medical-Services
|
$36.20
|
-0.05
-0.14% |
$36.20
|
295,231
69.22% of 50 DAV
50 DAV is 426,500
|
$37.50
-3.47%
|
2/14/2017
|
$25.10
|
PP = $24.55
|
|
MB = $25.78
|
Most Recent Note - 8/25/2017 2:21:30 PM
G - Consolidating near its 52-week high. Fundamental concerns remain. Jun '17 quarterly earnings rose +10% on +10% sales revenues, its 2nd consecutive quarterly comparison below the +25% minimum earnings guideline (C criteria). Its 50 DMA line ($33.65) defines near-term support along with prior lows.
>>> FEATURED STOCK ARTICLE : Technically Strong Despite Recent Fundamental Concerns - 8/17/2017 |
View all notes |
Set NEW NOTE alert |
Company Profile |
SEC
News |
Chart |
Request a new note
C
A
S
I |
ESNT
-
NYSE
Essent Group Ltd
Finance-MrtgandRel Svc
|
$37.31
|
-0.82
-2.15% |
$37.90
|
969,261
161.54% of 50 DAV
50 DAV is 600,000
|
$41.44
-9.97%
|
7/3/2017
|
$38.05
|
PP = $39.60
|
|
MB = $41.58
|
Most Recent Note - 8/29/2017 12:57:54 PM
G - Today's 4th consecutive loss has it violating its 50 DMA line ($38.20) raising concerns and triggering a technical sell signal and its color code is changed to green. Only a prompt rebound above the 50 DMA line would help its outlook. Completed a new Public Offering on 8/08/17. Prior lows ($36.71 on 8/11/17) and its 200 DMA line define near-term support in the $34-35 area.
>>> FEATURED STOCK ARTICLE : Perched Within Close Striking Distance of a New High - 8/1/2017 |
View all notes |
Set NEW NOTE alert |
Company Profile |
SEC
News |
Chart |
Request a new note
C
A
S
I |
Symbol/Exchange
Company Name
Industry Group |
PRICE |
CHANGE
(%Change) |
Day High |
Volume
(% DAV)
(% 50 day avg vol) |
52 Wk Hi
% From Hi |
Featured
Date |
Price
Featured |
Pivot Featured |
|
Max Buy |
VEEV
-
NYSE
Veeva Systems Inc Cl A
Computer Sftwr-Medical
|
$57.13
|
+0.00
0.00% |
$57.50
|
1,919,921
143.49% of 50 DAV
50 DAV is 1,338,000
|
$68.07
-16.07%
|
7/24/2017
|
$65.91
|
PP = $68.17
|
|
MB = $71.58
|
Most Recent Note - 8/28/2017 6:14:07 PM
G - Posted a solid gain with above average volume today. On the prior session it gapped down violating its 50 DMA line and undercutting prior lows with a damaging volume-driven loss triggering technical sell signals and its color code was changed to green. A prompt rebound above the 50 DMA line is needed for its outlook to improve. Reported Jul '17 earnings +53% on +27% sales revenues. Members were recently reminded, "Volume and volatility often increase near earnings news."
>>> FEATURED STOCK ARTICLE : Slump Below 50-Day Moving Average Line Raises Concerns - 8/2/2017 |
View all notes |
Set NEW NOTE alert |
Company Profile |
SEC
News |
Chart |
Request a new note
C
A
S
I |
ANET
-
NYSE
Arista Networks Inc
TELECOMMUNICATIONS - Communication Equipment
|
$173.28
|
-0.83
-0.48% |
$174.66
|
420,081
50.01% of 50 DAV
50 DAV is 840,000
|
$176.88
-2.04%
|
8/4/2017
|
$173.31
|
PP = $163.07
|
|
MB = $171.22
|
Most Recent Note - 8/29/2017 5:53:50 PM
G - Stubbornly holding its ground with volume totals cooling, a sign few investors are headed for the exit. Prior highs in the $162 area define initial support to watch above its 50 DMA line ($159.61). Fundamentals remain very strong.
>>> FEATURED STOCK ARTICLE : Gapped Up After Earnings Repairing 50-Day Moving Average Violation - 8/23/2017 |
View all notes |
Set NEW NOTE alert |
Company Profile |
SEC
News |
Chart |
Request a new note
C
A
S
I |
GRUB
-
NYSE
Grubhub Inc
COMPUTER SOFTWARE and SERVICES - Technical and System Software
|
$54.71
|
+0.58
1.07% |
$55.24
|
1,093,799
55.24% of 50 DAV
50 DAV is 1,980,000
|
$57.26
-4.45%
|
6/21/2017
|
$47.33
|
PP = $46.94
|
|
MB = $49.29
|
Most Recent Note - 8/25/2017 2:23:48 PM
G - Volume totals have been cooling while stubbornly holding its ground near its all-time high. Prior highs and its 50 DMA line define near-term support in the $47-48 area. Recently reported earnings +13% on +32% sales revenues for the Jun '17 quarter, below the +25% minimum earnings guideline (C criteria) raising fundamental concerns.
>>> FEATURED STOCK ARTICLE : Spiked Into New High Territory Despite Sub Par Earnings News - 8/8/2017 |
View all notes |
Set NEW NOTE alert |
Company Profile |
SEC
News |
Chart |
Request a new note
C
A
S
I |
IBP
-
NYSE
Installed Building Prod
DIVERSIFIED SERVICES - Business/Management Services
|
$54.15
|
-0.15
-0.28% |
$54.35
|
122,718
112.59% of 50 DAV
50 DAV is 109,000
|
$60.00
-9.75%
|
6/13/2017
|
$54.25
|
PP = $55.55
|
|
MB = $58.33
|
Most Recent Note - 8/29/2017 5:57:28 PM
Y - Pulled back today for a 6th consecutive loss, undercutting prior highs in the $55 area while testing its 50 DMA line ($54.24). More damaging losses would raise greater concerns.
>>> FEATURED STOCK ARTICLE : Consolidating Near Prior High Following Breakout - 8/18/2017 |
View all notes |
Set NEW NOTE alert |
Company Profile |
SEC
News |
Chart |
Request a new note
C
A
S
I |
NCOM
-
NASDAQ
National Commerce Corp
BANKING - Regional - Southeast Banks
|
$39.75
|
+0.05
0.13% |
$39.90
|
19,044
63.48% of 50 DAV
50 DAV is 30,000
|
$41.25
-3.64%
|
4/25/2017
|
$38.95
|
PP = $40.09
|
|
MB = $42.09
|
Most Recent Note - 8/25/2017 2:25:33 PM
G - Rebounded above its 50 DMA line ($39.70) this week, helping its technical stance and outlook improve. Reported Jun '17 earnings +23% on +45% sales revenues, below the +25% minimum earnings guideline (C criteria), raising fundamental concerns.
>>> FEATURED STOCK ARTICLE : Consolidating Near 50-day Moving Average Line - 8/16/2017 |
View all notes |
Set NEW NOTE alert |
Company Profile |
SEC
News |
Chart |
Request a new note
C
A
S
I |
Symbol/Exchange
Company Name
Industry Group |
PRICE |
CHANGE
(%Change) |
Day High |
Volume
(% DAV)
(% 50 day avg vol) |
52 Wk Hi
% From Hi |
Featured
Date |
Price
Featured |
Pivot Featured |
|
Max Buy |
OLLI
-
NASDAQ
Ollie's Bargain Outlet
Retail-DiscountandVariety
|
$43.30
|
-0.55
-1.25% |
$43.95
|
915,489
136.84% of 50 DAV
50 DAV is 669,000
|
$46.08
-6.02%
|
7/17/2017
|
$43.96
|
PP = $44.18
|
|
MB = $46.39
|
Most Recent Note - 8/25/2017 2:28:58 PM
Y - Consolidating just above support at its 50 DMA line ($43.08) and recent low ($42.81 on 8/11/17). Due to release its financial results for the second quarter of fiscal 2017 on Tuesday, August 29, 2017 after the market close. Confirming gains and a strong close above the pivot point backed by at least +40% above average volume may trigger a new (or add-on) technical buy signal.
>>> FEATURED STOCK ARTICLE : Quietly Consolidating Above 50 Day Moving Average Near High - 8/10/2017 |
View all notes |
Set NEW NOTE alert |
Company Profile |
SEC
News |
Chart |
Request a new note
C
A
S
I |
HLI
-
NYSE
Houlihan Lokey Inc Cl A
Finance-Invest Bnk/Bkrs
|
$35.67
|
-0.47
-1.30% |
$36.09
|
200,738
106.21% of 50 DAV
50 DAV is 189,000
|
$39.68
-10.11%
|
5/10/2017
|
$35.85
|
PP = $35.05
|
|
MB = $36.80
|
Most Recent Note - 8/29/2017 5:50:35 PM
Y - Volume was heavy behind today's small loss while still consolidating near its 50 DMA line ($35.98). Subsequent damaging losses below the recent low ($34.41 on 8/18/17) would raise serious concerns and trigger a technical sell signal. See the latest FSU analysis for more details and a new annotated graph.
>>> FEATURED STOCK ARTICLE : Consolidating Near 50-Day Moving Average - 8/29/2017 |
View all notes |
Set NEW NOTE alert |
Company Profile |
SEC
News |
Chart |
Request a new note
C
A
S
I |
|
|
|
THESE ARE NOT BUY RECOMMENDATIONS!
Comments contained in the body of this report are technical
opinions only. The material herein has been obtained
from sources believed to be reliable and accurate, however,
its accuracy and completeness cannot be guaranteed.
This site is not an investment advisor, hence it does
not endorse or recommend any securities or other investments.
Any recommendation contained in this report may not
be suitable for all investors and it is not to be deemed
an offer or solicitation on our part with respect to
the purchase or sale of any securities. All trademarks,
service marks and trade names appearing in this report
are the property of their respective owners, and are
likewise used for identification purposes only.
This report is a service available
only to active Paid Premium Members.
You may opt-out of receiving report notifications
at any time. Questions or comments may be submitted
by writing to Premium Membership Services 665 S.E. 10 Street, Suite 201 Deerfield Beach, FL 33441-5634 or by calling 1-800-965-8307
or 954-785-1121.
|
|
|