You are not logged in.
This means you
CAN ONLY VIEW reports that were published prior to Thursday, March 20, 2025.
You
MUST UPGRADE YOUR MEMBERSHIP if you want to see any current reports.
AFTER MARKET UPDATE - TUESDAY, SEPTEMBER 12TH, 2017
Previous After Market Report Next After Market Report >>>
|
|
|
|
DOW |
+61.49 |
22,118.86 |
+0.28% |
|
Volume |
767,352,020 |
-3% |
|
Volume |
1,743,756,540 |
-4% |
|
NASDAQ |
+22.02 |
6,454.28 |
+0.34% |
|
Advancers |
1,848 |
64% |
|
Advancers |
1,698 |
62% |
|
S&P 500 |
+8.37 |
2,496.48 |
+0.34% |
|
Decliners |
1,049 |
36% |
|
Decliners |
1,036 |
38% |
|
Russell 2000 |
+8.64 |
1,423.46 |
+0.61% |
|
52 Wk Highs |
169 |
|
|
52 Wk Highs |
196 |
|
|
S&P 600 |
+6.18 |
853.91 |
+0.73% |
|
52 Wk Lows |
7 |
|
|
52 Wk Lows |
20 |
|
|
 |
Major Indices Rose With Lighter Volume and Less Leadership
Kenneth J. Gruneisen - Passed the CAN SLIM® Master's Exam
Stocks finished higher on Tuesday. The Dow added 61 points to 22118. The S&P gained 8 points to a record level of 2496. The Nasdaq Composite was up 22 points to an all-time high at 6454. Volume totals reported lower than the prior session totals on the NYSE and on the Nasdaq exchange. Breadth was solidly positive as advancers led decliners by about a 3-2 margin on the NYSE and on the Nasdaq exchange. There were 65 high-ranked companies from the Leaders List that made new 52-week highs and were listed on the BreakOuts Page, versus the total of 84 on the prior session. New 52-week highs totals solidly outnumbered shrinking new 52-week lows totals on the Nasdaq exchange and on the NYSE. The Featured Stocks Page provides the latest analysis on noteworthy high-ranked leaders. Charts used courtesy of www.stockcharts.com
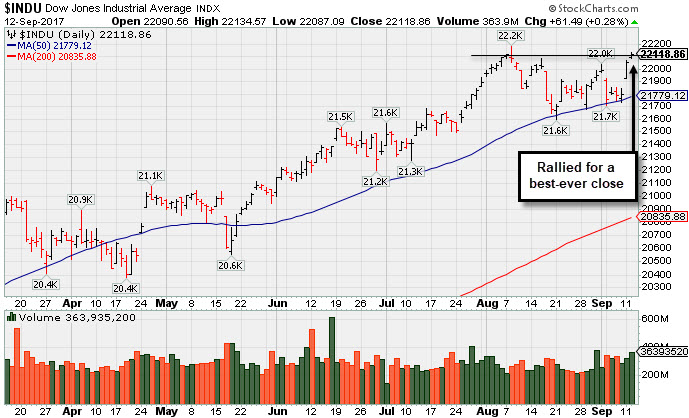 PICTURED: The Dow Jones Industrial Average posted a third consecutive solid gain, rallying for a best-ever close.
The major averages' (M criteria) uptrend endured recent pressure however leadership has remained healthy. Investors should buy stocks meeting all key criteria of the fact-based investment system on a case-by-case basis as they trigger technical buy signals.
The major averages advanced for a second day as geopolitical tensions and concerns over Hurricane Irma eased. Investors also appeared encouraged by Treasury Secretary Steven Mnuchin suggesting tax reform could come by year end. On the economic front, a survey showed small business optimism climbed to 105.3 in August from 105.2 in the prior month. The Labor Department said job openings climbed to 6.17 million in July, above expectations of 6 million.
Financials was the best performing sector led by banks. Comerica (CMA +3.67%) and Bank of America (BAC +2.53%) rose. Over in tech, Apple (AAPL -0.40%) gave back early gains, finishing down after the company’s unveiling of the iPhone 8 met market expectations. Utilities were down the most on the session with Ameren (AEE -2.40%) retreating. McDonald’s (MCD -3.22%) was a notable decliner, falling on concerns Hurricane Harvey and Irma would negatively impact third quarter sales.
Treasuries were lower with the 10-year note off 10/32 to yield 2.17%. In commodities, NYMEX WTI crude was up 0.4% to $48.27/barrel as OPEC said production fell for the first time in four months in August. COMEX gold was essentially flat at $1332.10/ounce. |
 Kenneth J. Gruneisen started out as a licensed stockbroker in August 1987, a couple of months prior to the historic stock market crash that took the Dow Jones Industrial Average down -22.6% in a single day. He has published daily fact-based fundamental and technical analysis on high-ranked stocks online for two decades. Through FACTBASEDINVESTING.COM, Kenneth provides educational articles, news, market commentary, and other information regarding proven investment systems that work in good times and bad.
Comments contained in the body of this report are technical opinions only and are not necessarily those of Gruneisen Growth Corp. The material herein has been obtained from sources believed to be reliable and accurate, however, its accuracy and completeness cannot be guaranteed. Our firm, employees, and customers may effect transactions, including transactions contrary to any recommendation herein, or have positions in the securities mentioned herein or options with respect thereto. Any recommendation contained in this report may not be suitable for all investors and it is not to be deemed an offer or solicitation on our part with respect to the purchase or sale of any securities. |
|
 |
Financial, Tech, Retail, and Commodity-Linked Groups Rose
Kenneth J. Gruneisen - Passed the CAN SLIM® Master's Exam
On Tuesday the Broker/Dealer Index ($XBD +1.20%) and the Bank Index ($BKX +1.64%) both posted solid gains while the Retail Index ($RLX +0.92%) also ended higher. The tech sector had a positive bias as the Semiconductor Index ($SOX +0.42%), Networking Index ($NWX +0.58%) both outpaced the Biotechnology Index ($BTK +0.14%). The Gold & Silver Index ($XAU +0.66%) and Integrated Oil Index ($XOI +0.39%) posted modest gains while the Oil Services Index ($OSX +2.33%) was a standout gainer. Charts courtesy www.stockcharts.com
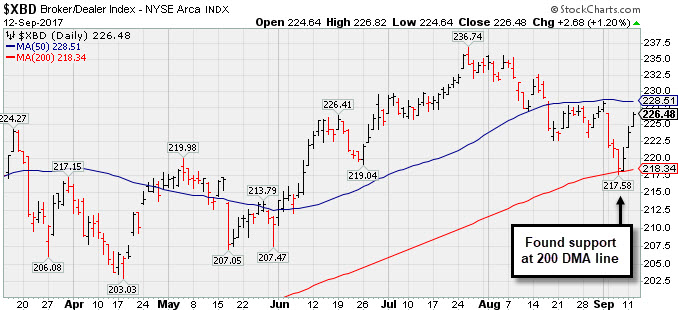 PICTURED: The Broker/Dealer Index ($XBD +1.20%) recently found support at its 200-day moving average line. It rebounded near its 50 DMA line which acted as resistance in recent weeks. The financial indexes are reliable "leading indicators", so further deterioration would be very bad news for the broader market outlook, meanwhile, a rebound above the 50 DMA line would be a reassuring sign.
| Oil Services |
$OSX |
129.52 |
+2.94 |
+2.32% |
-29.53% |
| Integrated Oil |
$XOI |
1,140.76 |
+4.42 |
+0.39% |
-10.03% |
| Semiconductor |
$SOX |
1,120.20 |
+4.74 |
+0.42% |
+23.61% |
| Networking |
$NWX |
454.75 |
+2.61 |
+0.58% |
+1.94% |
| Broker/Dealer |
$XBD |
226.48 |
+2.68 |
+1.20% |
+10.33% |
| Retail |
$RLX |
1,518.79 |
+13.82 |
+0.92% |
+13.09% |
| Gold & Silver |
$XAU |
90.20 |
+0.59 |
+0.66% |
+14.38% |
| Bank |
$BKX |
93.51 |
+1.51 |
+1.64% |
+1.87% |
| Biotech |
$BTK |
4,209.69 |
+5.78 |
+0.14% |
+36.90% |
|
|
|
 |
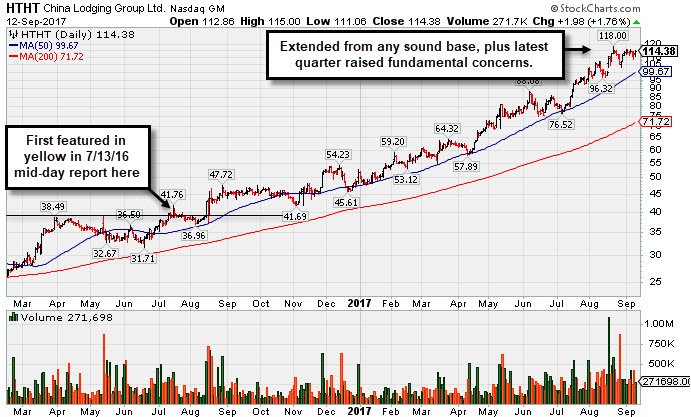
Considerable Rally However Fundamental Concerns Were Raised
Kenneth J. Gruneisen - Passed the CAN SLIM® Master's Exam
China Lodging Group Ads (HTHT +$1.98 or +1.76% to $114.38) is perched near its all-time high, very extended from any sound base. Its 50-day moving average (DMA) line ($99.67) defines near-term support above prior highs in the $88 area. Recently it reported earnings +19% on +18% sales revenues for the Jun '17 quarter, below the +25% minimum earnings guideline (C criteria), raising fundamental concerns. Nonetheless, bullish action has continued after it was last shown in this FSU section on 8/09/17 with an annotated graph under the headline, "Extended From Sound Base With Earnings News Due Next Week".
HTHT traded up as much as +203.5% since first featured in yellow in the 7/13/16 mid-day report (read here). The number of top-rated funds owing its shares rose from 87 in Sep '15 to 177 in Jun '17 a reassuring sign concerning the I criteria. Currently the high-ranked Leisure- Lodging firm has an A Timeliness rating and a C Sponsorship rating. Its small supply of 27.2 million shares (S criteria) in the public float may contribute to greater price volatility in the event of institutional buying or selling.
|
|
|
Color Codes Explained :
Y - Better candidates highlighted by our
staff of experts.
G - Previously featured
in past reports as yellow but may no longer be buyable under the
guidelines.
***Last / Change / Volume data in this table is the closing quote data***
Symbol/Exchange
Company Name
Industry Group |
PRICE |
CHANGE
(%Change) |
Day High |
Volume
(% DAV)
(% 50 day avg vol) |
52 Wk Hi
% From Hi |
Featured
Date |
Price
Featured |
Pivot Featured |
|
Max Buy |
THO
-
NYSE
Thor Industries Inc
AUTOMOTIVE - Recreational Vehicles
|
$110.75
|
+0.92
0.84% |
$110.81
|
412,312
81.44% of 50 DAV
50 DAV is 506,300
|
$115.74
-4.31%
|
8/14/2017
|
$106.67
|
PP = $110.01
|
|
MB = $115.51
|
 Most Recent Note - 9/12/2017 7:05:03 PM
Y - Stubbornly holding its ground perched within striking distance of its 52-week high following volume-driven gains. Current Relative Strength Rating of 79 is just below the 80+ minimum guideline for buy candidates under the fact-based investment system. Very little resistance remains due to overhead supply up to its $115.74 all-time high.
>>> FEATURED STOCK ARTICLE : Slump Below 50-Day Average Hurt Technical Stance - 8/21/2017 |
View all notes |
Set NEW NOTE alert |
Company Profile |
SEC
News |
Chart |
Request a new note
C
A
S
I |
HSKA
-
NASDAQ
Heska Corporation
DRUGS - Biotechnology
|
$97.28
|
-3.12
-3.11% |
$101.07
|
70,824
110.66% of 50 DAV
50 DAV is 64,000
|
$115.00
-15.41%
|
7/31/2017
|
$114.27
|
PP = $110.35
|
|
MB = $115.87
|
Most Recent Note - 9/12/2017 6:59:34 PM
G - Slumping below its 50 DMA line ($100.67) closing near the session low today. Recent lows in the $95 area define the next important support to watch above its 200 DMA line.
>>> FEATURED STOCK ARTICLE : Rally Above 50-Day Moving Average Line Improved Technical Stance - 8/30/2017 |
View all notes |
Set NEW NOTE alert |
Company Profile |
SEC
News |
Chart |
Request a new note
C
A
S
I |
AVGO
-
NASDAQ
Broadcom Limited
ELECTRONICS - Semiconductor - Broad Line
|
$247.14
|
-0.60
-0.24% |
$249.74
|
1,840,107
78.40% of 50 DAV
50 DAV is 2,347,000
|
$259.36
-4.71%
|
8/24/2017
|
$252.44
|
PP = $256.89
|
|
MB = $269.73
|
Most Recent Note - 9/12/2017 7:02:40 PM
Y - Volume totals have been cooling while consolidating near its 50 DMA line ($248) after enduring distributional pressure. Recent lows define the next important support in the $238-240 area. Subsequent violations would trigger more worrisome technical sell signals. Fundamentals remain strong. It has not produced volume-driven gains since highlighted in the 8/24/17 mid-day report - "Subsequent volume-driven gains above the pivot and for new highs may trigger a technical buy signal."
>>> FEATURED STOCK ARTICLE : Pullback Followed Latest Strong Earnings Report From Tech Leader - 8/25/2017 |
View all notes |
Set NEW NOTE alert |
Company Profile |
SEC
News |
Chart |
Request a new note
C
A
S
I |
EW
-
NYSE
Edwards Lifesciences Cp
HEALTH SERVICES - Medical Appliances and Equipment
|
$114.69
|
-0.44
-0.38% |
$115.61
|
966,603
76.47% of 50 DAV
50 DAV is 1,264,100
|
$121.75
-5.80%
|
7/11/2017
|
$117.23
|
PP = $121.85
|
|
MB = $127.94
|
Most Recent Note - 9/6/2017 5:30:21 PM
G - Managed a "positive reversal" after slumping to new 16-week lows today, closing with a gain backed by above average volume.It is only -7.8% off its all-time high, but its Relative Strength Rating has slumped to 70, below the 80+ minimum guideline for buy candidates. A rebound above its downward sloping 50 DMA line ($115.64) is needed for its outlook to improve. Fundamentals remain strong.
>>> FEATURED STOCK ARTICLE : Positive Reversal After Slumping to New Lows - 9/6/2017 |
View all notes |
Set NEW NOTE alert |
Company Profile |
SEC
News |
Chart |
Request a new note
C
A
S
I |
STMP
-
NASDAQ
Stamps.com Inc
INTERNET - Internet Software and Services
|
$199.15
|
+5.50
2.84% |
$199.51
|
258,475
54.30% of 50 DAV
50 DAV is 476,000
|
$220.25
-9.58%
|
9/11/2017
|
$193.65
|
PP = $220.35
|
|
MB = $231.37
|
Most Recent Note - 9/11/2017 6:42:41 PM
Y - Color code is changed to yellow with new pivot point cited based on its 8/07/17 high plus 10 cents. Faces some near-term resistance, and subsequent volume-driven gains above the pivot point are needed to trigger a new (or add-on) technical buy signal. Its 50 DMA line ($177) defines near-term support above prior highs in the $156 area. Fundamentals remain strong. See the latest FSU analysis for more details and a new annotated graph.
>>> FEATURED STOCK ARTICLE : New Base Being Built After Considerable Gap Higher - 9/11/2017 |
View all notes |
Set NEW NOTE alert |
Company Profile |
SEC
News |
Chart |
Request a new note
C
A
S
I |
Symbol/Exchange
Company Name
Industry Group |
PRICE |
CHANGE
(%Change) |
Day High |
Volume
(% DAV)
(% 50 day avg vol) |
52 Wk Hi
% From Hi |
Featured
Date |
Price
Featured |
Pivot Featured |
|
Max Buy |
HTHT
-
NASDAQ
China Lodging Group Ads
LEISURE - Lodging
|
$114.38
|
+1.98
1.76% |
$115.00
|
271,698
85.44% of 50 DAV
50 DAV is 318,000
|
$118.00
-3.07%
|
9/29/2016
|
$46.12
|
PP = $47.82
|
|
MB = $50.21
|
Most Recent Note - 9/12/2017 7:06:46 PM
G - Hovering near its all-time high, extended from any sound base. Recently reported earnings +19% on +18% sales revenues for the Jun '17 quarter, below the +25% minimum earnings guideline (C criteria). Its 50 DMA line ($99.67) defines support above prior highs in the $88 area. See the latest FSU analysis for more details and a new annotated graph.
>>> FEATURED STOCK ARTICLE : Considerable Rally However Fundamental Concerns Were Raised - 9/12/2017 |
View all notes |
Set NEW NOTE alert |
Company Profile |
SEC
News |
Chart |
Request a new note
C
A
S
I |
LMAT
-
NASDAQ
Lemaitre Vascular Inc
Medical-Products
|
$38.24
|
+0.19
0.50% |
$38.48
|
109,891
51.11% of 50 DAV
50 DAV is 215,000
|
$38.25
-0.03%
|
7/28/2017
|
$33.50
|
PP = $33.32
|
|
MB = $34.99
|
Most Recent Note - 9/12/2017 7:00:53 PM
G - Inched higher for yet another new all-time high with today's gain backed by below average volume. Very extended from any sound base. Prior highs and the 50 DMA line define near-term support to watch in the $33 area.
>>> FEATURED STOCK ARTICLE : Volume-Driven Gain for New High And Strong Finish Bode Well - 8/28/2017 |
View all notes |
Set NEW NOTE alert |
Company Profile |
SEC
News |
Chart |
Request a new note
C
A
S
I |
BEAT
-
NASDAQ
BioTelemetry Inc
Medical-Services
|
$37.85
|
-0.10
-0.26% |
$38.10
|
301,375
73.61% of 50 DAV
50 DAV is 409,400
|
$39.20
-3.44%
|
2/14/2017
|
$25.10
|
PP = $24.55
|
|
MB = $25.78
|
Most Recent Note - 9/6/2017 5:20:10 PM
G - Posted a 5th consecutive small gain today on light volume. Fundamental concerns remain. Jun '17 quarterly earnings rose +10% on +10% sales revenues, its 2nd consecutive quarterly comparison below the +25% minimum earnings guideline (C criteria). Its 50 DMA line ($34.69) defines near-term support along with prior lows.
>>> FEATURED STOCK ARTICLE : Technically Strong Despite Recent Fundamental Concerns - 8/17/2017 |
View all notes |
Set NEW NOTE alert |
Company Profile |
SEC
News |
Chart |
Request a new note
C
A
S
I |
ESNT
-
NYSE
Essent Group Ltd
Finance-MrtgandRel Svc
|
$39.01
|
+1.52
4.05% |
$39.03
|
765,195
113.65% of 50 DAV
50 DAV is 673,300
|
$41.44
-5.86%
|
7/3/2017
|
$38.05
|
PP = $39.60
|
|
MB = $41.58
|
Most Recent Note - 9/11/2017 6:45:35 PM
G - Posted a 2nd consecutive gain today after testing support at its 200 DMA line. A rebound above its 50 DMA line ($38.41) is needed for its outlook to improve. Completed a new Public Offering on 8/08/17.
>>> FEATURED STOCK ARTICLE : Undercut 50-Day Moving Average in Slump Toward Prior Lows - 9/5/2017 |
View all notes |
Set NEW NOTE alert |
Company Profile |
SEC
News |
Chart |
Request a new note
C
A
S
I |
OLED
-
NASDAQ
Universal Display Corp
Elec-Misc Products
|
$132.40
|
+0.10
0.08% |
$134.89
|
1,379,013
171.09% of 50 DAV
50 DAV is 806,000
|
$133.50
-0.82%
|
8/31/2017
|
$128.22
|
PP = $127.78
|
|
MB = $134.17
|
Most Recent Note - 9/12/2017 12:50:33 PM
Y - Posted another solid gain on the prior session with +56% above average volume and finished near the session high for a best-ever close. Rallying from a "double bottom" base with confirming gains triggering a technical buy signal. Highlighted in yellow in the 8/31/17 mid-day report with a new pivot point cited based on its 7/26/17 high. No resistance remains due to overhead supply.
>>> FEATURED STOCK ARTICLE : Rallied Near Pivot Point But Confirming Gains Are Still Needed - 8/31/2017 |
View all notes |
Set NEW NOTE alert |
Company Profile |
SEC
News |
Chart |
Request a new note
C
A
S
I |
Symbol/Exchange
Company Name
Industry Group |
PRICE |
CHANGE
(%Change) |
Day High |
Volume
(% DAV)
(% 50 day avg vol) |
52 Wk Hi
% From Hi |
Featured
Date |
Price
Featured |
Pivot Featured |
|
Max Buy |
VEEV
-
NYSE
Veeva Systems Inc Cl A
Computer Sftwr-Medical
|
$57.31
|
-0.47
-0.81% |
$57.99
|
1,484,006
108.96% of 50 DAV
50 DAV is 1,362,000
|
$68.07
-15.81%
|
7/24/2017
|
$65.91
|
PP = $68.17
|
|
MB = $71.58
|
Most Recent Note - 9/8/2017 7:59:49 PM
G - A rebound above the 50 DMA line ($62.03) is still needed for its outlook to improve. Prior lows and the 200 DMA line define the next support to watch. Disciplined investors following the fact-based system limit losses by selling any stock that falls more than -7% below their purchase price.
>>> FEATURED STOCK ARTICLE : Rebounding After gap Down Violated 50-Day Average and Prior Lows - 9/1/2017 |
View all notes |
Set NEW NOTE alert |
Company Profile |
SEC
News |
Chart |
Request a new note
C
A
S
I |
ANET
-
NYSE
Arista Networks Inc
TELECOMMUNICATIONS - Communication Equipment
|
$173.82
|
-1.49
-0.85% |
$176.80
|
421,817
53.19% of 50 DAV
50 DAV is 793,000
|
$179.71
-3.28%
|
8/4/2017
|
$173.31
|
PP = $163.07
|
|
MB = $171.22
|
Most Recent Note - 9/6/2017 5:18:45 PM
G - Perched near its all-time high, stubbornly holding its ground. Prior highs in the $162 area define initial support to watch above its 50 DMA line ($161). Fundamentals remain very strong.
>>> FEATURED STOCK ARTICLE : Gapped Up After Earnings Repairing 50-Day Moving Average Violation - 8/23/2017 |
View all notes |
Set NEW NOTE alert |
Company Profile |
SEC
News |
Chart |
Request a new note
C
A
S
I |
GRUB
-
NYSE
Grubhub Inc
COMPUTER SOFTWARE and SERVICES - Technical and System Software
|
$56.04
|
-0.36
-0.64% |
$57.05
|
2,325,234
136.78% of 50 DAV
50 DAV is 1,700,000
|
$57.61
-2.73%
|
6/21/2017
|
$47.33
|
PP = $46.94
|
|
MB = $49.29
|
Most Recent Note - 9/11/2017 6:53:31 PM
G - Perched near its all-time high after posting a small gain today with above average volume. Its 50 DMA line ($50.46) defines near-term support above prior highs in the $46-47 area. Recently reported earnings +13% on +32% sales revenues for the Jun '17 quarter, below the +25% minimum earnings guideline (C criteria) raising fundamental concerns.
>>> FEATURED STOCK ARTICLE : Touched New High With Quiet Gain From Brief Consolidation - 9/7/2017 |
View all notes |
Set NEW NOTE alert |
Company Profile |
SEC
News |
Chart |
Request a new note
C
A
S
I |
IBP
-
NYSE
Installed Building Prod
DIVERSIFIED SERVICES - Business/Management Services
|
$58.20
|
+0.75
1.31% |
$58.30
|
72,276
69.50% of 50 DAV
50 DAV is 104,000
|
$60.00
-3.00%
|
6/13/2017
|
$54.25
|
PP = $55.55
|
|
MB = $58.33
|
Most Recent Note - 9/12/2017 6:57:49 PM
Y - Perched within close striking distance of its all-time high after finding support near its 50 DMA line ($54.88) and prior highs. More damaging losses would raise greater concerns.
>>> FEATURED STOCK ARTICLE : Consolidating Near Prior High Following Breakout - 8/18/2017 |
View all notes |
Set NEW NOTE alert |
Company Profile |
SEC
News |
Chart |
Request a new note
C
A
S
I |
NCOM
-
NASDAQ
National Commerce Corporation
BANKING - Regional - Southeast Banks
|
$39.95
|
+0.20
0.50% |
$40.03
|
38,904
155.62% of 50 DAV
50 DAV is 25,000
|
$41.25
-3.15%
|
4/25/2017
|
$38.95
|
PP = $40.09
|
|
MB = $42.09
|
Most Recent Note - 9/12/2017 12:48:36 PM
G - Consolidating in a tight range near its 50 DMA line ($39.84). Its Relative Strength rating is currently 79, just below the 80+ minimum guideline for buy candidates. Recently reported Jun '17 earnings +23% on +45% sales revenues, below the +25% minimum earnings guideline (C criteria), raising fundamental concerns.
>>> FEATURED STOCK ARTICLE : Consolidating Near 50-day Moving Average Line - 8/16/2017 |
View all notes |
Set NEW NOTE alert |
Company Profile |
SEC
News |
Chart |
Request a new note
C
A
S
I |
Symbol/Exchange
Company Name
Industry Group |
PRICE |
CHANGE
(%Change) |
Day High |
Volume
(% DAV)
(% 50 day avg vol) |
52 Wk Hi
% From Hi |
Featured
Date |
Price
Featured |
Pivot Featured |
|
Max Buy |
OLLI
-
NASDAQ
Ollie's Bargain Outlet
Retail-DiscountandVariety
|
$45.90
|
+0.85
1.89% |
$45.95
|
507,521
86.61% of 50 DAV
50 DAV is 586,000
|
$46.08
-0.38%
|
9/8/2017
|
$45.20
|
PP = $46.18
|
|
MB = $48.49
|
Most Recent Note - 9/8/2017 7:49:40 PM
Y - Color code is changed to yellow with new pivot point cited based on its 8/01/17 high plus 10 cents. Recent gains above the 50 DMA line helped its outlook improve. Subsequent gains above the latest pivot point with at least the minimum +40% above average volume may trigger a proper new (or add-on) technical buy signal. Fundamentals remain strong. See the latest FSU analysis for more details and a new annotated graph.
>>> FEATURED STOCK ARTICLE : New Pivot Point Cited After Rebound From Below 50-Day Average - 9/8/2017 |
View all notes |
Set NEW NOTE alert |
Company Profile |
SEC
News |
Chart |
Request a new note
C
A
S
I |
HLI
-
NYSE
Houlihan Lokey Inc Cl A
Finance-Invest Bnk/Bkrs
|
$36.94
|
+0.84
2.33% |
$37.01
|
857,497
416.26% of 50 DAV
50 DAV is 206,000
|
$39.68
-6.91%
|
5/10/2017
|
$35.85
|
PP = $35.05
|
|
MB = $36.80
|
Most Recent Note - 9/12/2017 12:35:57 PM
Y - Volume is higher behind today's big gain while rebounding above its 50 DMA line ($36.23) and its color code is changed to yellow. Subsequent damaging losses below the recent low ($34.41 on 8/18/17) would raise more serious concerns and trigger a technical sell signal.
>>> FEATURED STOCK ARTICLE : Consolidating Near 50-Day Moving Average - 8/29/2017 |
View all notes |
Set NEW NOTE alert |
Company Profile |
SEC
News |
Chart |
Request a new note
C
A
S
I |
|
|
|
THESE ARE NOT BUY RECOMMENDATIONS!
Comments contained in the body of this report are technical
opinions only. The material herein has been obtained
from sources believed to be reliable and accurate, however,
its accuracy and completeness cannot be guaranteed.
This site is not an investment advisor, hence it does
not endorse or recommend any securities or other investments.
Any recommendation contained in this report may not
be suitable for all investors and it is not to be deemed
an offer or solicitation on our part with respect to
the purchase or sale of any securities. All trademarks,
service marks and trade names appearing in this report
are the property of their respective owners, and are
likewise used for identification purposes only.
This report is a service available
only to active Paid Premium Members.
You may opt-out of receiving report notifications
at any time. Questions or comments may be submitted
by writing to Premium Membership Services 665 S.E. 10 Street, Suite 201 Deerfield Beach, FL 33441-5634 or by calling 1-800-965-8307
or 954-785-1121.
|
|
|