You are not logged in.
This means you
CAN ONLY VIEW reports that were published prior to Thursday, March 20, 2025.
You
MUST UPGRADE YOUR MEMBERSHIP if you want to see any current reports.
AFTER MARKET UPDATE - FRIDAY, SEPTEMBER 8TH, 2017
Previous After Market Report Next After Market Report >>>
|
|
|
|
DOW |
+13.01 |
21,797.79 |
+0.06% |
|
Volume |
801,151,650 |
+2% |
|
Volume |
1,790,088,670 |
-11% |
|
NASDAQ |
-37.68 |
6,360.19 |
-0.59% |
|
Advancers |
1,377 |
47% |
|
Advancers |
1,376 |
52% |
|
S&P 500 |
-3.67 |
2,461.43 |
-0.15% |
|
Decliners |
1,546 |
53% |
|
Decliners |
1,258 |
48% |
|
Russell 2000 |
+0.76 |
1,399.43 |
+0.05% |
|
52 Wk Highs |
156 |
|
|
52 Wk Highs |
186 |
|
|
S&P 600 |
+1.51 |
838.92 |
+0.18% |
|
52 Wk Lows |
61 |
|
|
52 Wk Lows |
64 |
|
|
 |
Major Indices Ended the Holiday-Shortened Week Lower
Kenneth J. Gruneisen - Passed the CAN SLIM® Master's Exam
For the holiday shortened week, the Dow was down 0.9%, the S&P 500 fell 0.6% and the Nasdaq Composite declined 1.2%. U.S. Stocks were down broadly Friday. The Dow rose 13 points to 21797. The S&P 500 slipped 4 points to 2461 and the Nasdaq Composite fell 38 points to 6360. Volume totals reported were mixed, higher than the prior session total on the NYSE and lower on the Nasdaq exchange. Breadth was fairly even but decliners led advancers by narrow margin on the NYSE, while advancers led decliners by a narrow margin on the Nasdaq exchange. There were 48 high-ranked companies from the Leaders List that made new 52-week highs and were listed on the BreakOuts Page, versus the total of 49 on the prior session. New 52-week highs totals expanded and solidly outnumbered new 52-week lows on the Nasdaq exchange and on the NYSE. The Featured Stocks Page provides the latest analysis on noteworthy high-ranked leaders. Charts used courtesy of www.stockcharts.com
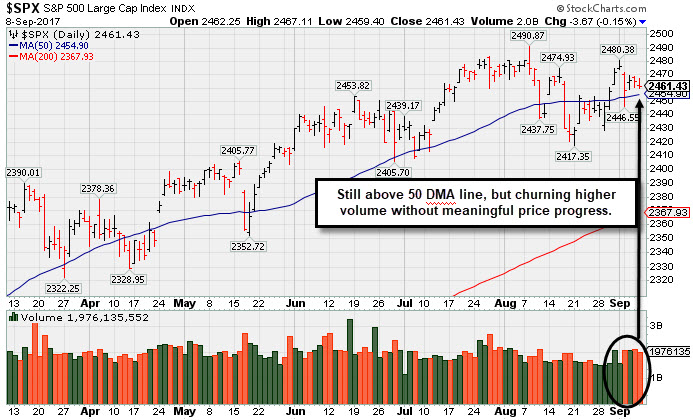 PICTURED: The S&P 500 Index is consolidating above its 50-day moving average (DMA) line. That important short-term average and recent lows define near-term support to watch. Higher volume without meaningful price progress recently is action indicative of distributional pressure.
The major averages' (M criteria) uptrend endured recent pressure however leadership has remained healthy. Investors should buy stocks meeting all key criteria of the fact-based investment system on a case-by-case basis as they trigger technical buy signals.
U.S. equities were mostly lower as investors digested economic and political updates. Shortly after the open, a report showed wholesale inventories rose 0.6% for July above consensus estimates of a 0.4% increase. The House is expected to pass a three month extension of the debt ceiling and government funding for Hurricane Harvey and expectation for Hurricane Irma to reach Florida this weekend. Geopolitical risk remained in focus with the possibility of another North Korean missile launch this weekend.
Energy and Technology were the worst performing groups on the session as shares of Chevron (CVX -0.91%) and Apple (AAPL -1.63%) edged lower. Financials were up the most, as insurers rebounded from early losses. Chubb (CB +4.43%) and XL Group Ltd (XL +5.84%) increased. Shares of Kroger (KR -7.51%) dropped after the grocer stated it would no longer provide forward guidance. Equifax (EFX -13.66%) sank after revealing it was a victim of a massive data breach.
Treasuries were down with the 10-year note off 4/32 to yield 2.05%. In commodities, NYMEX WTI crude retreated 3.1% to $47.58/barrel. COMEX gold was up 0.1% to $1347.40/ounce. |
 Kenneth J. Gruneisen started out as a licensed stockbroker in August 1987, a couple of months prior to the historic stock market crash that took the Dow Jones Industrial Average down -22.6% in a single day. He has published daily fact-based fundamental and technical analysis on high-ranked stocks online for two decades. Through FACTBASEDINVESTING.COM, Kenneth provides educational articles, news, market commentary, and other information regarding proven investment systems that work in good times and bad.
Comments contained in the body of this report are technical opinions only and are not necessarily those of Gruneisen Growth Corp. The material herein has been obtained from sources believed to be reliable and accurate, however, its accuracy and completeness cannot be guaranteed. Our firm, employees, and customers may effect transactions, including transactions contrary to any recommendation herein, or have positions in the securities mentioned herein or options with respect thereto. Any recommendation contained in this report may not be suitable for all investors and it is not to be deemed an offer or solicitation on our part with respect to the purchase or sale of any securities. |
|
 |
Retail Index, Tech Sector, and Commodity-Linked Groups Fell
Kenneth J. Gruneisen - Passed the CAN SLIM® Master's Exam
On Friday the Broker/Dealer Index ($XBD +0.64%) and the Bank Index ($BKX +0.52%) both gained some ground while the Retail Index ($RLX -0.56%) edged lower. The tech sector had a negative bias as the Semiconductor Index ($SOX -1.25%) outpaced the Networking Index ($NWX -0.40%) and the Biotechnology Index ($BTK -0.65%).lower. Commodity-linked groups were also solidly lower as the Gold & Silver Index ($XAU -1.73%), Integrated Oil Index ($XOI -0.89%) and the Oil Services Index ($OSX -1.82%) unanimously fell. Charts courtesy www.stockcharts.com
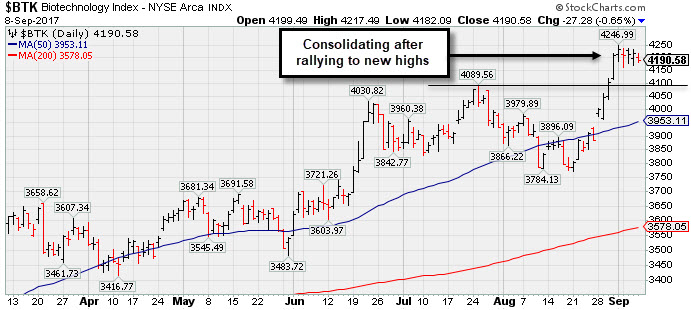 PICTURED: The Biotechnology Index ($BTK -0.65%).has been consolidating after a rally to new high territory.
| Oil Services |
$OSX |
124.84 |
-2.32 |
-1.82% |
-32.07% |
| Integrated Oil |
$XOI |
1,126.54 |
-10.08 |
-0.89% |
-11.16% |
| Semiconductor |
$SOX |
1,093.49 |
-13.85 |
-1.25% |
+20.63% |
| Networking |
$NWX |
446.56 |
-1.79 |
-0.40% |
+0.10% |
| Broker/Dealer |
$XBD |
219.92 |
+1.40 |
+0.64% |
+7.13% |
| Retail |
$RLX |
1,494.32 |
-8.38 |
-0.56% |
+11.27% |
| Gold & Silver |
$XAU |
91.65 |
-1.61 |
-1.73% |
+16.22% |
| Bank |
$BKX |
90.17 |
+0.46 |
+0.51% |
-1.76% |
| Biotech |
$BTK |
4,190.58 |
-27.28 |
-0.65% |
+36.28% |
|
|
|
 |
New Pivot Point Cited After Rebound From Below 50-Day Average
Kenneth J. Gruneisen - Passed the CAN SLIM® Master's Exam
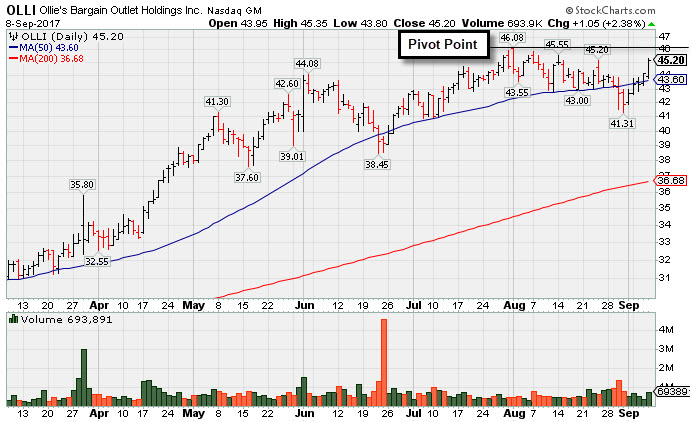
Ollie's Bargain Outlet (OLLI +$1.05 or +2.38% to $45.20) made progress back above its 50-day moving average (DMA) line ($43.60) this week helping its outlook to improve. A new pivot point was cited based on its 8/01/17 high plus 10 cents. Subsequent gains backed by at least the minimum +40% above average volume are needed to trigger a proper new (or add-on) technical buy signal. Any slump back below the 50 DMA line would raise concerns, and more damaging losses below the recent low ($41.31) would trigger a worrisome technical sell signal.
Recently it reported earnings +29% on +21% sales revenues for the Jul '17 quarter, continuing its strong earnings track record and meeting the +25% minimum earnings guideline (C criteria). It has earned a very strong 97 Earnings Per Share (EPS) rating. OLLI was last shown in this FSU section on 8/10/17 with an annotated graph under the headline, "Quietly Consolidating Above 50 Day Moving Average Near High". Fundamentals remain strong.
The Retail - Discount & Variety firm traded up as much as +40.5% since highlighted in yellow with new pivot point cited based on its 2/21/17 high plus 10 cents in the 3/27/17 mid-day report (read here). OLLI was first highlighted in yellow with a pivot point based on its 4/28/16 high plus 10 cents in 7/19/16 mid-day report (read here). OLLI completed its $16 IPO on 7/16/15. It completed a Secondary Offerings on 6/06/16 and 2/18/16. The number of top-rated funds owning its shares rose from 98 in Sep '15 to 383 in Jun '17, a reassuring sign concerning the I criteria. Its small supply of only 61.4 million shares outstanding (S criteria) can contribute to greater price volatility in the event of institutional buying or selling.
|
|
|
Color Codes Explained :
Y - Better candidates highlighted by our
staff of experts.
G - Previously featured
in past reports as yellow but may no longer be buyable under the
guidelines.
***Last / Change / Volume data in this table is the closing quote data***
Symbol/Exchange
Company Name
Industry Group |
PRICE |
CHANGE
(%Change) |
Day High |
Volume
(% DAV)
(% 50 day avg vol) |
52 Wk Hi
% From Hi |
Featured
Date |
Price
Featured |
Pivot Featured |
|
Max Buy |
THO
-
NYSE
Thor Industries Inc
AUTOMOTIVE - Recreational Vehicles
|
$109.70
|
+0.23
0.21% |
$109.87
|
469,210
89.20% of 50 DAV
50 DAV is 526,000
|
$115.74
-5.22%
|
8/14/2017
|
$106.67
|
PP = $110.01
|
|
MB = $115.51
|
Most Recent Note - 9/5/2017 7:13:55 PM
Y - Posted a gain backed by +77% above average volume and closed well above the previously cited pivot point triggering a technical buy signal. However, its current Relative Strength Rating of 77 is below the 80+ minimum guideline for buy candidates under the fact-based investment system. Very little resistance remains due to overhead supply up to its $115.74 all-time high.
>>> FEATURED STOCK ARTICLE : Slump Below 50-Day Average Hurt Technical Stance - 8/21/2017 |
View all notes |
Set NEW NOTE alert |
Company Profile |
SEC
News |
Chart |
Request a new note
C
A
S
I |
HSKA
-
NASDAQ
Heska Corporation
DRUGS - Biotechnology
|
$99.48
|
+2.36
2.43% |
$99.72
|
65,042
100.06% of 50 DAV
50 DAV is 65,000
|
$115.00
-13.50%
|
7/31/2017
|
$114.27
|
PP = $110.35
|
|
MB = $115.87
|
Most Recent Note - 9/5/2017 7:18:44 PM
G - Slumped back below its 50 DMA line ($100.73) closing near the session low today and its color code is changed to green. Recent lows in the $95 area define the next important support to watch
>>> FEATURED STOCK ARTICLE : Rally Above 50-Day Moving Average Line Improved Technical Stance - 8/30/2017 |
View all notes |
Set NEW NOTE alert |
Company Profile |
SEC
News |
Chart |
Request a new note
C
A
S
I |
AVGO
-
NASDAQ
Broadcom Limited
ELECTRONICS - Semiconductor - Broad Line
|
$244.11
|
-2.44
-0.99% |
$246.40
|
1,809,990
75.57% of 50 DAV
50 DAV is 2,395,000
|
$259.36
-5.88%
|
8/24/2017
|
$252.44
|
PP = $256.89
|
|
MB = $269.73
|
Most Recent Note - 9/5/2017 7:27:53 PM
Y - Color code is changed to yellow while consolidating near its 50 DMA line ($247) after enduring distributional pressure. Recent lows define the next important support in the $238-240 area. Subsequent violations would trigger more worrisome technical sell signals. Fundamentals remain strong. It has not produced volume-driven gains since highlighted in the 8/24/17 mid-day report - "Subsequent volume-driven gains above the pivot and for new highs may trigger a technical buy signal."
>>> FEATURED STOCK ARTICLE : Pullback Followed Latest Strong Earnings Report From Tech Leader - 8/25/2017 |
View all notes |
Set NEW NOTE alert |
Company Profile |
SEC
News |
Chart |
Request a new note
C
A
S
I |
EW
-
NYSE
Edwards Lifesciences Cp
HEALTH SERVICES - Medical Appliances and Equipment
|
$113.19
|
+0.85
0.76% |
$114.79
|
1,612,089
130.26% of 50 DAV
50 DAV is 1,237,600
|
$121.75
-7.03%
|
7/11/2017
|
$117.23
|
PP = $121.85
|
|
MB = $127.94
|
Most Recent Note - 9/6/2017 5:30:21 PM
G - Managed a "positive reversal" after slumping to new 16-week lows today, closing with a gain backed by above average volume.It is only -7.8% off its all-time high, but its Relative Strength Rating has slumped to 70, below the 80+ minimum guideline for buy candidates. A rebound above its downward sloping 50 DMA line ($115.64) is needed for its outlook to improve. Fundamentals remain strong.
>>> FEATURED STOCK ARTICLE : Positive Reversal After Slumping to New Lows - 9/6/2017 |
View all notes |
Set NEW NOTE alert |
Company Profile |
SEC
News |
Chart |
Request a new note
C
A
S
I |
STMP
-
NASDAQ
Stamps.com Inc
INTERNET - Internet Software and Services
|
$192.55
|
+2.75
1.45% |
$193.55
|
279,915
58.81% of 50 DAV
50 DAV is 476,000
|
$220.25
-12.58%
|
5/24/2017
|
$133.10
|
PP = $136.10
|
|
MB = $142.91
|
Most Recent Note - 9/7/2017 1:31:53 PM
G - It has not formed a sound base of sufficient length. Its 50 DMA line ($175) defines near-term support above prior highs in the $156 area. Fundamentals remain strong.
>>> FEATURED STOCK ARTICLE : Blasted Higher After Latest Strong Earnings Report - 8/11/2017 |
View all notes |
Set NEW NOTE alert |
Company Profile |
SEC
News |
Chart |
Request a new note
C
A
S
I |
Symbol/Exchange
Company Name
Industry Group |
PRICE |
CHANGE
(%Change) |
Day High |
Volume
(% DAV)
(% 50 day avg vol) |
52 Wk Hi
% From Hi |
Featured
Date |
Price
Featured |
Pivot Featured |
|
Max Buy |
HTHT
-
NASDAQ
China Lodging Group Ads
LEISURE - Lodging
|
$113.36
|
-1.38
-1.20% |
$114.78
|
242,205
77.14% of 50 DAV
50 DAV is 314,000
|
$118.00
-3.93%
|
9/29/2016
|
$46.12
|
PP = $47.82
|
|
MB = $50.21
|
Most Recent Note - 9/6/2017 5:24:40 PM
G - Perched near its all-time high, very extended from any sound base. Recently reported earnings +19% on +18% sales revenues for the Jun '17 quarter, below the +25% minimum earnings guideline (C criteria). Its 50 DMA line ($97.16) defines support above prior highs in the $88 area.
>>> FEATURED STOCK ARTICLE : Extended From Sound Base With Earnings News Due Next Week - 8/9/2017 |
View all notes |
Set NEW NOTE alert |
Company Profile |
SEC
News |
Chart |
Request a new note
C
A
S
I |
LMAT
-
NASDAQ
Lemaitre Vascular Inc
Medical-Products
|
$37.60
|
+0.03
0.08% |
$37.84
|
159,252
74.42% of 50 DAV
50 DAV is 214,000
|
$37.90
-0.79%
|
7/28/2017
|
$33.50
|
PP = $33.32
|
|
MB = $34.99
|
Most Recent Note - 9/5/2017 7:22:38 PM
G - Hit another new all-time high with today's gain backed by +50% above average volume, getting more extended from any sound base. Prior highs and the 50 DMA line define near-term support to watch in the $33 area.
>>> FEATURED STOCK ARTICLE : Volume-Driven Gain for New High And Strong Finish Bode Well - 8/28/2017 |
View all notes |
Set NEW NOTE alert |
Company Profile |
SEC
News |
Chart |
Request a new note
C
A
S
I |
BEAT
-
NASDAQ
BioTelemetry Inc
Medical-Services
|
$38.45
|
+0.85
2.26% |
$38.95
|
432,768
106.67% of 50 DAV
50 DAV is 405,700
|
$38.25
0.52%
|
2/14/2017
|
$25.10
|
PP = $24.55
|
|
MB = $25.78
|
Most Recent Note - 9/6/2017 5:20:10 PM
G - Posted a 5th consecutive small gain today on light volume. Fundamental concerns remain. Jun '17 quarterly earnings rose +10% on +10% sales revenues, its 2nd consecutive quarterly comparison below the +25% minimum earnings guideline (C criteria). Its 50 DMA line ($34.69) defines near-term support along with prior lows.
>>> FEATURED STOCK ARTICLE : Technically Strong Despite Recent Fundamental Concerns - 8/17/2017 |
View all notes |
Set NEW NOTE alert |
Company Profile |
SEC
News |
Chart |
Request a new note
C
A
S
I |
ESNT
-
NYSE
Essent Group Ltd
Finance-MrtgandRel Svc
|
$36.62
|
+0.45
1.24% |
$36.95
|
799,670
122.07% of 50 DAV
50 DAV is 655,100
|
$41.44
-11.63%
|
7/3/2017
|
$38.05
|
PP = $39.60
|
|
MB = $41.58
|
Most Recent Note - 9/5/2017 7:15:27 PM
G - Slumped below its 50 DMA line ($38.38) hurting its outlook and its color code is changed to green. Completed a new Public Offering on 8/08/17. Prior lows ($36.71 on 8/11/17) and its 200 DMA line define near-term support in the $35-36 area. See the latest FSU analysis for more details and a new annotated graph.
>>> FEATURED STOCK ARTICLE : Undercut 50-Day Moving Average in Slump Toward Prior Lows - 9/5/2017 |
View all notes |
Set NEW NOTE alert |
Company Profile |
SEC
News |
Chart |
Request a new note
C
A
S
I |
OLED
-
NASDAQ
Universal Display Corp
Elec-Misc Products
|
$127.65
|
-1.60
-1.24% |
$129.35
|
640,368
78.57% of 50 DAV
50 DAV is 815,000
|
$133.50
-4.38%
|
8/31/2017
|
$128.22
|
PP = $127.78
|
|
MB = $134.17
|
Most Recent Note - 9/6/2017 1:19:18 PM
Y - Erased most of its early gain today. Posted a big gain on 9/05/17 with +53% above average volume for a best-ever close, rallying from a "double bottom" base and triggering a technical buy signal. Highlighted in yellow in the 8/31/17 mid-day report with a new pivot point cited based on its 7/26/17 high. No resistance remains due to overhead supply. See the latest FSU analysis for additional gains and an annotated graph.
>>> FEATURED STOCK ARTICLE : Rallied Near Pivot Point But Confirming Gains Are Still Needed - 8/31/2017 |
View all notes |
Set NEW NOTE alert |
Company Profile |
SEC
News |
Chart |
Request a new note
C
A
S
I |
Symbol/Exchange
Company Name
Industry Group |
PRICE |
CHANGE
(%Change) |
Day High |
Volume
(% DAV)
(% 50 day avg vol) |
52 Wk Hi
% From Hi |
Featured
Date |
Price
Featured |
Pivot Featured |
|
Max Buy |
VEEV
-
NYSE
Veeva Systems Inc Cl A
Computer Sftwr-Medical
|
$56.96
|
-0.90
-1.56% |
$57.56
|
1,355,057
100.67% of 50 DAV
50 DAV is 1,346,000
|
$68.07
-16.32%
|
7/24/2017
|
$65.91
|
PP = $68.17
|
|
MB = $71.58
|
 Most Recent Note - 9/8/2017 7:59:49 PM
G - A rebound above the 50 DMA line ($62.03) is still needed for its outlook to improve. Prior lows and the 200 DMA line define the next support to watch. Disciplined investors following the fact-based system limit losses by selling any stock that falls more than -7% below their purchase price.
>>> FEATURED STOCK ARTICLE : Rebounding After gap Down Violated 50-Day Average and Prior Lows - 9/1/2017 |
View all notes |
Set NEW NOTE alert |
Company Profile |
SEC
News |
Chart |
Request a new note
C
A
S
I |
ANET
-
NYSE
Arista Networks Inc
TELECOMMUNICATIONS - Communication Equipment
|
$172.68
|
-0.97
-0.56% |
$174.45
|
318,092
39.37% of 50 DAV
50 DAV is 808,000
|
$179.71
-3.91%
|
8/4/2017
|
$173.31
|
PP = $163.07
|
|
MB = $171.22
|
Most Recent Note - 9/6/2017 5:18:45 PM
G - Perched near its all-time high, stubbornly holding its ground. Prior highs in the $162 area define initial support to watch above its 50 DMA line ($161). Fundamentals remain very strong.
>>> FEATURED STOCK ARTICLE : Gapped Up After Earnings Repairing 50-Day Moving Average Violation - 8/23/2017 |
View all notes |
Set NEW NOTE alert |
Company Profile |
SEC
News |
Chart |
Request a new note
C
A
S
I |
GRUB
-
NYSE
Grubhub Inc
COMPUTER SOFTWARE and SERVICES - Technical and System Software
|
$56.08
|
-1.00
-1.75% |
$57.16
|
1,412,810
83.60% of 50 DAV
50 DAV is 1,690,000
|
$57.61
-2.66%
|
6/21/2017
|
$47.33
|
PP = $46.94
|
|
MB = $49.29
|
Most Recent Note - 9/7/2017 9:14:36 PM
G - Touched a new all-time high with today's 3rd consecutive gain on light volume. Its 50 DMA line ($49.96) defines near-term support above prior highs in the $46-47 area. Recently reported earnings +13% on +32% sales revenues for the Jun '17 quarter, below the +25% minimum earnings guideline (C criteria) raising fundamental concerns. See the latest FSU analysis for more details and a new annotated graph.
>>> FEATURED STOCK ARTICLE : Touched New High With Quiet Gain From Brief Consolidation - 9/7/2017 |
View all notes |
Set NEW NOTE alert |
Company Profile |
SEC
News |
Chart |
Request a new note
C
A
S
I |
IBP
-
NYSE
Installed Building Prod
DIVERSIFIED SERVICES - Business/Management Services
|
$57.50
|
+0.75
1.32% |
$58.13
|
88,282
84.89% of 50 DAV
50 DAV is 104,000
|
$60.00
-4.17%
|
6/13/2017
|
$54.25
|
PP = $55.55
|
|
MB = $58.33
|
Most Recent Note - 9/5/2017 7:20:18 PM
Y - Down with higher volume today while falling toward its 50 DMA line ($54.45) and prior lows defining near-term support. More damaging losses would raise greater concerns.
>>> FEATURED STOCK ARTICLE : Consolidating Near Prior High Following Breakout - 8/18/2017 |
View all notes |
Set NEW NOTE alert |
Company Profile |
SEC
News |
Chart |
Request a new note
C
A
S
I |
NCOM
-
NASDAQ
National Commerce Corporation
BANKING - Regional - Southeast Banks
|
$39.30
|
+0.45
1.16% |
$39.45
|
24,201
96.42% of 50 DAV
50 DAV is 25,100
|
$41.25
-4.73%
|
4/25/2017
|
$38.95
|
PP = $40.09
|
|
MB = $42.09
|
Most Recent Note - 9/7/2017 1:29:56 PM
G - Consolidating in a tight range, but it has slumped below its 50 DMA line ($39.84) and its Relative Strength rating has slipped to 77, below the 80+ minimum guideline for buy candidates. Recently reported Jun '17 earnings +23% on +45% sales revenues, below the +25% minimum earnings guideline (C criteria), raising fundamental concerns.
>>> FEATURED STOCK ARTICLE : Consolidating Near 50-day Moving Average Line - 8/16/2017 |
View all notes |
Set NEW NOTE alert |
Company Profile |
SEC
News |
Chart |
Request a new note
C
A
S
I |
Symbol/Exchange
Company Name
Industry Group |
PRICE |
CHANGE
(%Change) |
Day High |
Volume
(% DAV)
(% 50 day avg vol) |
52 Wk Hi
% From Hi |
Featured
Date |
Price
Featured |
Pivot Featured |
|
Max Buy |
OLLI
-
NASDAQ
Ollie's Bargain Outlet
Retail-DiscountandVariety
|
$45.20
|
+1.05
2.38% |
$45.35
|
693,891
118.41% of 50 DAV
50 DAV is 586,000
|
$46.08
-1.90%
|
9/8/2017
|
$45.20
|
PP = $46.18
|
|
MB = $48.49
|
Most Recent Note - 9/8/2017 7:49:40 PM
Y - Color code is changed to yellow with new pivot point cited based on its 8/01/17 high plus 10 cents. Recent gains above the 50 DMA line helped its outlook improve. Subsequent gains above the latest pivot point with at least the minimum +40% above average volume may trigger a proper new (or add-on) technical buy signal. Fundamentals remain strong. See the latest FSU analysis for more details and a new annotated graph.
>>> FEATURED STOCK ARTICLE : New Pivot Point Cited After Rebound From Below 50-Day Average - 9/8/2017 |
View all notes |
Set NEW NOTE alert |
Company Profile |
SEC
News |
Chart |
Request a new note
C
A
S
I |
HLI
-
NYSE
Houlihan Lokey Inc Cl A
Finance-Invest Bnk/Bkrs
|
$35.84
|
+0.16
0.45% |
$35.99
|
234,565
117.28% of 50 DAV
50 DAV is 200,000
|
$39.68
-9.68%
|
5/10/2017
|
$35.85
|
PP = $35.05
|
|
MB = $36.80
|
Most Recent Note - 9/5/2017 7:31:20 PM
G - Volume was higher behind today's loss while slumping back below its 50 DMA line ($36.09) and its color code is changed to green. Subsequent damaging losses below the recent low ($34.41 on 8/18/17) would raise more serious concerns and trigger a technical sell signal.
>>> FEATURED STOCK ARTICLE : Consolidating Near 50-Day Moving Average - 8/29/2017 |
View all notes |
Set NEW NOTE alert |
Company Profile |
SEC
News |
Chart |
Request a new note
C
A
S
I |
|
|
|
THESE ARE NOT BUY RECOMMENDATIONS!
Comments contained in the body of this report are technical
opinions only. The material herein has been obtained
from sources believed to be reliable and accurate, however,
its accuracy and completeness cannot be guaranteed.
This site is not an investment advisor, hence it does
not endorse or recommend any securities or other investments.
Any recommendation contained in this report may not
be suitable for all investors and it is not to be deemed
an offer or solicitation on our part with respect to
the purchase or sale of any securities. All trademarks,
service marks and trade names appearing in this report
are the property of their respective owners, and are
likewise used for identification purposes only.
This report is a service available
only to active Paid Premium Members.
You may opt-out of receiving report notifications
at any time. Questions or comments may be submitted
by writing to Premium Membership Services 665 S.E. 10 Street, Suite 201 Deerfield Beach, FL 33441-5634 or by calling 1-800-965-8307
or 954-785-1121.
|
|
|