You are not logged in.
This means you
CAN ONLY VIEW reports that were published prior to Thursday, March 20, 2025.
You
MUST UPGRADE YOUR MEMBERSHIP if you want to see any current reports.
AFTER MARKET UPDATE - THURSDAY, AUGUST 31ST, 2017
Previous After Market Report Next After Market Report >>>
|
|
|
|
DOW |
+55.67 |
21,948.10 |
+0.25% |
|
Volume |
941,685,150 |
+46% |
|
Volume |
1,875,875,260 |
+10% |
|
NASDAQ |
+60.35 |
6,428.66 |
+0.95% |
|
Advancers |
2,136 |
74% |
|
Advancers |
1,556 |
66% |
|
S&P 500 |
+14.06 |
2,471.65 |
+0.57% |
|
Decliners |
761 |
26% |
|
Decliners |
809 |
34% |
|
Russell 2000 |
+13.95 |
1,405.28 |
+1.00% |
|
52 Wk Highs |
129 |
|
|
52 Wk Highs |
163 |
|
|
S&P 600 |
+8.16 |
840.43 |
+0.98% |
|
52 Wk Lows |
18 |
|
|
52 Wk Lows |
26 |
|
|
 |
Leadership Expands as Indices Rise With Greater Volume
Kenneth J. Gruneisen - Passed the CAN SLIM® Master's Exam
For August, the Dow rose 0.3% and the S&P 500 edged up 0.1% to post their fifth consecutive monthly advances. The Nasdaq Composite finished with 1.3% gain. Stocks were higher on Thursday’s session. The Dow gained 56 points to 21952. The S&P 500 rose 14 points to 2471 and the Nasdaq Composite advanced 60 points to 6428. Volume totals reported were higher than the prior session totals on the NYSE and on the Nasdaq exchange, indicative of increasing institutional buying demand. Breadth was positive as advancers led decliners by about a 3-1 margin on the NYSE and nearly 2-1 on the Nasdaq exchange. Leadership improved as there were 73 high-ranked companies from the Leaders List that made new 52-week highs and were listed on the BreakOuts Page, up from the total of 49 on the prior session. New 52-week highs totals swelled and solidly outnumbered a shrinking list of new 52-week lows on the Nasdaq exchange and on the NYSE. The Featured Stocks Page provides the latest analysis on noteworthy high-ranked leaders. Charts used courtesy of www.stockcharts.com
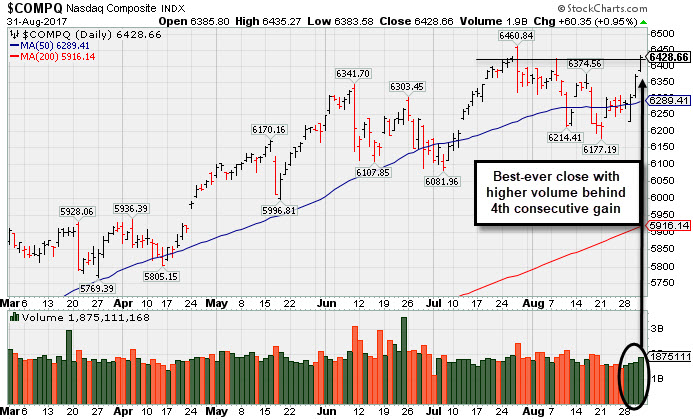 PICTURED: The Nasdaq Composite Index posted a 4th consecutive gain on higher volume and finished at a best-ever close. The recent low defines important near-term support to watch below its 50-day moving average (DMA) line. The major averages' (M criteria) uptrend endured recent pressure however leadership has remained healthy. Investors should buy stocks meeting all key criteria of the fact-based investment system on a case-by-case basis as they trigger technical buy signals.
The major averages finished August on a positive note bolstered by generally encouraging economic data. Weekly initial jobless claims edged up 1,000 to 236,000 versus the consensus estimate of 238,000. Personal income grew 0.4% in July while spending increased 0.3%. Pending home sales unexpectedly fell 0.8% compared to projections to rise 0.3%. The PCE deflator, the Fed’s preferred proxy for inflation, was up 1.4% year-over-year in July, in line with expectations.
Today’s advance was broad based with 10 of 11 S&P 500 sectors up on the session. Health Care was the best performing group followed by Materials and Technology. Celgene (CELG +3.42%) and Dow Chemical (DOW +2.70%) both rose. Apple (AAPL +0.4%) inched higher to an all-time closing high of $164.00. Campbell Soup (CPB -8.06%) was the biggest decliner in the S&P 500 after posting an earnings shortfall. Dollar General (DG -5.43%) retreated following the discount retailer’s reduced full-year guidance.
Treasuries were up with the 10-year note increasing 3/32 to yield 2.12%. In commodities, NYMEX WTI crude rallied 2.4% to $47.07/barrel. COMEX gold added 1.1% to $1324.20/ounce. |
 Kenneth J. Gruneisen started out as a licensed stockbroker in August 1987, a couple of months prior to the historic stock market crash that took the Dow Jones Industrial Average down -22.6% in a single day. He has published daily fact-based fundamental and technical analysis on high-ranked stocks online for two decades. Through FACTBASEDINVESTING.COM, Kenneth provides educational articles, news, market commentary, and other information regarding proven investment systems that work in good times and bad.
Comments contained in the body of this report are technical opinions only and are not necessarily those of Gruneisen Growth Corp. The material herein has been obtained from sources believed to be reliable and accurate, however, its accuracy and completeness cannot be guaranteed. Our firm, employees, and customers may effect transactions, including transactions contrary to any recommendation herein, or have positions in the securities mentioned herein or options with respect thereto. Any recommendation contained in this report may not be suitable for all investors and it is not to be deemed an offer or solicitation on our part with respect to the purchase or sale of any securities. |
|
 |
Gold & Silver, Biotech, and Retail Indexes Led Group Gainers
Kenneth J. Gruneisen - Passed the CAN SLIM® Master's Exam
On Thursday the Retail Index ($RLX +0.71%) and the Broker/Dealer Index ($XBD +0.51%) both rose but the Bank Index ($BKX -0.37%) edged lower. The tech sector was led by the Biotechnology Index ($BTK +2.60%) and Semiconductor Index ($SOX +0.96%) while the Networking Index ($NWX -0.68%) finished the day lower. The and Oil Services Index ($OSX -1.08%) both fell while the Integrated Oil Index ($XOI +0.11%) was little changed. Charts courtesy www.stockcharts.com
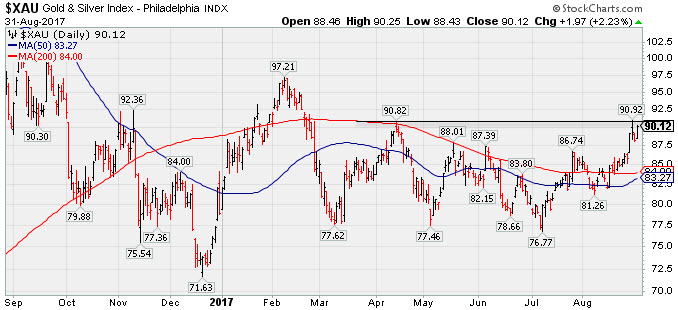
 ) PICTURED: The Gold & Silver Index ($XAU +2.23%) rallied near its April high, making progress above its 50-day and 200-day moving average (DMA) lines.
| Oil Services |
$OSX |
120.62 |
+0.77 |
+0.64% |
-34.37% |
| Integrated Oil |
$XOI |
1,104.10 |
+5.98 |
+0.54% |
-12.93% |
| Semiconductor |
$SOX |
1,114.31 |
+10.62 |
+0.96% |
+22.93% |
| Networking |
$NWX |
456.25 |
-3.11 |
-0.68% |
+2.28% |
| Broker/Dealer |
$XBD |
226.98 |
+1.15 |
+0.51% |
+10.57% |
| Retail |
$RLX |
1,473.29 |
+10.43 |
+0.71% |
+9.70% |
| Gold & Silver |
$XAU |
90.12 |
+1.96 |
+2.22% |
+14.28% |
| Bank |
$BKX |
92.98 |
-0.35 |
-0.38% |
+1.30% |
| Biotech |
$BTK |
4,208.94 |
+106.53 |
+2.60% |
+36.88% |
|
|
|
 |
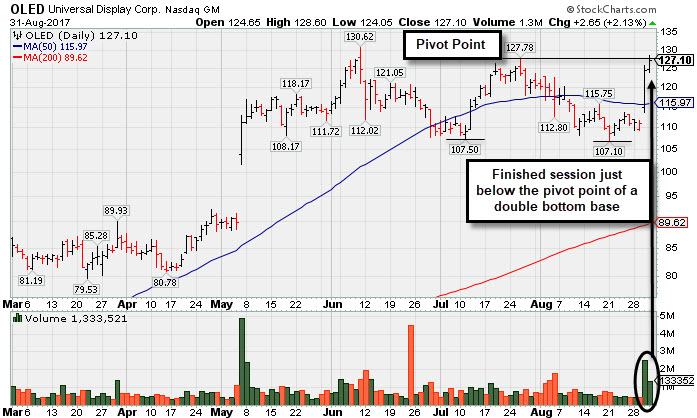
Rallied Near Pivot Point But Confirming Gains Are Still Needed
Kenneth J. Gruneisen - Passed the CAN SLIM® Master's Exam
Universal Display Corp (OLED +$2.65 or +2.13% to $127.10) was highlighted in yellow with new pivot point cited based on its 7/26/17 high in the earlier mid-day report (read here) while trying to rally from a 12-week "double bottom" base pattern. Subsequent gains backed by at least +40% above average volume and a strong close above the pivot point may trigger a convincing technical buy signal.
It rebounded further above its 50-day moving average (DMA) line today, challenging prior highs with a 2nd consecutive big volume-driven gain. Very little resistance remains due to overhead supply.
Recently it reported +115% earnings on +59% sales revenues for the Jun '17 quarter, its 3rd consecutive strong quarter above the +25% minimum guideline (C criteria), helping it better match with the fact-based investment system's fundamental guidelines. Annual earnings (A criteria) history has been strong.
The high-ranked Electronic Products firm has earned a current Timeliness rating of B and a Sponsorship rating of B. The number of top-rated funds owning its shares rose from 355 in Sep '16 to 399 in Jun '17. Its current Up/Down Volume Ratio of 0.8 is an unbiased indication its shares have been under some distributional pressure over the past 50 days (I criteria). Its small supply of only 40.9 million shares (S criteria) in the public float can contribute to greater volatility in the event of institutional buying or selling. |
|
|
Color Codes Explained :
Y - Better candidates highlighted by our
staff of experts.
G - Previously featured
in past reports as yellow but may no longer be buyable under the
guidelines.
***Last / Change / Volume data in this table is the closing quote data***
Symbol/Exchange
Company Name
Industry Group |
PRICE |
CHANGE
(%Change) |
Day High |
Volume
(% DAV)
(% 50 day avg vol) |
52 Wk Hi
% From Hi |
Featured
Date |
Price
Featured |
Pivot Featured |
|
Max Buy |
THO
-
NYSE
Thor Industries Inc
AUTOMOTIVE - Recreational Vehicles
|
$108.64
|
+0.08
0.07% |
$110.11
|
410,862
77.38% of 50 DAV
50 DAV is 531,000
|
$115.74
-6.13%
|
8/14/2017
|
$106.67
|
PP = $110.01
|
|
MB = $115.51
|
Most Recent Note - 8/28/2017 1:38:51 PM
Y - Gapped up today rebounding above its 50 DMA line ($105) helping its technical stance and outlook improve and its color code is changed to yellow. Encountered distributional pressure after earlier gains lifted it above the previously cited pivot point and challenged its all-time high. A strong finish may help clinch a convincing new (or add-on) technical buy signal, however its current Relative Strength Rating of 79 is just below the 80+ minimum guideline for buy candidates under the fact-based investment system.
>>> FEATURED STOCK ARTICLE : Slump Below 50-Day Average Hurt Technical Stance - 8/21/2017 |
View all notes |
Set NEW NOTE alert |
Company Profile |
SEC
News |
Chart |
Request a new note
C
A
S
I |
BERY
-
NYSE
Berry Plastics Group Inc
CONSUMER NON-DURABLES - Packaging and Containers
|
$56.24
|
+0.00
0.00% |
$56.68
|
952,801
111.09% of 50 DAV
50 DAV is 857,700
|
$58.95
-4.60%
|
7/14/2017
|
$57.67
|
PP = $59.05
|
|
MB = $62.00
|
Most Recent Note - 8/28/2017 6:08:56 PM
G - Testing the recent low that defines important near-term support ($55.60 on 8/03/17), it slumped further below its 50 DMA line ($57.35) today and finished near the session low with a loss on higher volume, raising concerns. Reported Jun '17 quarterly earnings +13% on +16% sales revenues, below the +25% minimum earnings guideline (C criteria), raising fundamental concerns.
>>> FEATURED STOCK ARTICLE : Fundamental Concerns Yet Rebound Helped Technical Stance - 8/14/2017 |
View all notes |
Set NEW NOTE alert |
Company Profile |
SEC
News |
Chart |
Request a new note
C
A
S
I |
HSKA
-
NASDAQ
Heska Corporation
DRUGS - Biotechnology
|
$101.72
|
-0.17
-0.17% |
$102.86
|
91,030
142.23% of 50 DAV
50 DAV is 64,000
|
$115.00
-11.55%
|
7/31/2017
|
$114.27
|
PP = $110.35
|
|
MB = $115.87
|
Most Recent Note - 8/30/2017 6:29:16 PM
Y - Rallied above its 50 DMA line ($100.56) with today's gain on higher volume, helping its technical stance improve, and its color code is changed to yellow. Encountered distributional pressure since highlighted in yellow in the 7/31/17 mid-day report with pivot point cited based on its high hit on 5/01/17 plus 10 cents. See the latest FSU analysis for more detailed analysis with a new annotated graph.
>>> FEATURED STOCK ARTICLE : Rally Above 50-Day Moving Average Line Improved Technical Stance - 8/30/2017 |
View all notes |
Set NEW NOTE alert |
Company Profile |
SEC
News |
Chart |
Request a new note
C
A
S
I |
AVGO
-
NASDAQ
Broadcom Limited
ELECTRONICS - Semiconductor - Broad Line
|
$252.07
|
+6.05
2.46% |
$252.53
|
2,940,530
117.86% of 50 DAV
50 DAV is 2,495,000
|
$259.36
-2.81%
|
8/24/2017
|
$252.44
|
PP = $256.89
|
|
MB = $269.73
|
Most Recent Note - 8/29/2017 12:34:23 PM
G - Prior low ($238.70) on 8/11/17) defines the next technical support level to watch. Volume-driven losses violated its 50 DMA line ($246) raising concerns and triggering a technical sell signal. Reported earnings +42% on +18% sales revenues for the Jul '17 quarter. Volume and volatility often increase near earnings news. It was highlighted in the 8/24/17 mid-day report - "Subsequent volume-driven gains above the pivot and for new highs may trigger a technical buy signal. Prior quarterly and annual earnings history (C and A criteria) is a good match with the fact-based investment system's fundamental guidelines." See the latest FSU analysis for more details and an annotated graph.
>>> FEATURED STOCK ARTICLE : Pullback Followed Latest Strong Earnings Report From Tech Leader - 8/25/2017 |
View all notes |
Set NEW NOTE alert |
Company Profile |
SEC
News |
Chart |
Request a new note
C
A
S
I |
EW
-
NYSE
Edwards Lifesciences Cp
HEALTH SERVICES - Medical Appliances and Equipment
|
$113.66
|
+0.97
0.86% |
$113.79
|
1,090,380
91.02% of 50 DAV
50 DAV is 1,197,900
|
$121.75
-6.64%
|
7/11/2017
|
$117.23
|
PP = $121.85
|
|
MB = $127.94
|
Most Recent Note - 8/29/2017 5:55:31 PM
G - Slumped with higher (near average) volume today closing -8.1% off its all-time high. Relative Strength Rating has slumped to 71, below the 80+ minimum guideline for buy candidates. A rebound above its downward sloping 50 DMA line ($116) is needed for its outlook to improve. Fundamentals remain strong.
>>> FEATURED STOCK ARTICLE : Near 50-Day Moving Average Line, Yet Not Far Off High - 8/7/2017 |
View all notes |
Set NEW NOTE alert |
Company Profile |
SEC
News |
Chart |
Request a new note
C
A
S
I |
Symbol/Exchange
Company Name
Industry Group |
PRICE |
CHANGE
(%Change) |
Day High |
Volume
(% DAV)
(% 50 day avg vol) |
52 Wk Hi
% From Hi |
Featured
Date |
Price
Featured |
Pivot Featured |
|
Max Buy |
STMP
-
NASDAQ
Stamps.com Inc
INTERNET - Internet Software and Services
|
$191.25
|
-4.20
-2.15% |
$196.90
|
359,745
75.10% of 50 DAV
50 DAV is 479,000
|
$220.25
-13.17%
|
5/24/2017
|
$133.10
|
PP = $136.10
|
|
MB = $142.91
|
 Most Recent Note - 8/31/2017 2:47:25 PM
G - Very extended from any sound base. Its 50 DMA line ($172) defines near-term support above prior highs in the $156 area. Fundamentals remain strong.
>>> FEATURED STOCK ARTICLE : Blasted Higher After Latest Strong Earnings Report - 8/11/2017 |
View all notes |
Set NEW NOTE alert |
Company Profile |
SEC
News |
Chart |
Request a new note
C
A
S
I |
HTHT
-
NASDAQ
China Lodging Group Ads
LEISURE - Lodging
|
$113.51
|
+1.75
1.57% |
$114.60
|
310,777
98.35% of 50 DAV
50 DAV is 316,000
|
$118.00
-3.81%
|
9/29/2016
|
$46.12
|
PP = $47.82
|
|
MB = $50.21
|
Most Recent Note - 8/30/2017 6:34:47 PM
G - Rebounded toward its all-time high with today's gain on lighter volume. Very extended from any sound base. Recently reported earnings +19% on +18% sales revenues for the Jun '17 quarter, below the +25% minimum earnings guideline (C criteria). Its 50 DMA line ($94.61) defines support above prior highs in the $88 area.
>>> FEATURED STOCK ARTICLE : Extended From Sound Base With Earnings News Due Next Week - 8/9/2017 |
View all notes |
Set NEW NOTE alert |
Company Profile |
SEC
News |
Chart |
Request a new note
C
A
S
I |
LMAT
-
NASDAQ
Lemaitre Vascular Inc
Medical-Products
|
$36.40
|
-0.14
-0.38% |
$36.97
|
147,493
70.91% of 50 DAV
50 DAV is 208,000
|
$37.50
-2.93%
|
7/28/2017
|
$33.50
|
PP = $33.32
|
|
MB = $34.99
|
Most Recent Note - 8/28/2017 6:06:29 PM
G - Gapped up today hitting another new all-time high with a big gain backed by +134% above average volume after a brief consolidation. Color code was changed to green after rising more than +5% above the previous pivot point cited. See the latest FSU analysis for more details and a new annotated graph.
>>> FEATURED STOCK ARTICLE : Volume-Driven Gain for New High And Strong Finish Bode Well - 8/28/2017 |
View all notes |
Set NEW NOTE alert |
Company Profile |
SEC
News |
Chart |
Request a new note
C
A
S
I |
BEAT
-
NASDAQ
BioTelemetry Inc
Medical-Services
|
$37.15
|
+0.10
0.27% |
$37.71
|
295,428
70.34% of 50 DAV
50 DAV is 420,000
|
$37.50
-0.93%
|
2/14/2017
|
$25.10
|
PP = $24.55
|
|
MB = $25.78
|
Most Recent Note - 8/30/2017 6:37:59 PM
G - Posted a gain today on light volume for its second-best close ever. Fundamental concerns remain. Jun '17 quarterly earnings rose +10% on +10% sales revenues, its 2nd consecutive quarterly comparison below the +25% minimum earnings guideline (C criteria). Its 50 DMA line ($34.08) defines near-term support along with prior lows.
>>> FEATURED STOCK ARTICLE : Technically Strong Despite Recent Fundamental Concerns - 8/17/2017 |
View all notes |
Set NEW NOTE alert |
Company Profile |
SEC
News |
Chart |
Request a new note
C
A
S
I |
ESNT
-
NYSE
Essent Group Ltd
Finance-MrtgandRel Svc
|
$39.08
|
+1.04
2.73% |
$39.20
|
727,724
118.33% of 50 DAV
50 DAV is 615,000
|
$41.44
-5.69%
|
7/3/2017
|
$38.05
|
PP = $39.60
|
|
MB = $41.58
|
Most Recent Note - 8/31/2017 2:40:36 PM
Y - Today's gain has it rebounding above its 50 DMA line ($38.29) helping its outlook improve and its color code is changed to yellow. Completed a new Public Offering on 8/08/17. Prior lows ($36.71 on 8/11/17) and its 200 DMA line define near-term support in the $34-35 area.
>>> FEATURED STOCK ARTICLE : Perched Within Close Striking Distance of a New High - 8/1/2017 |
View all notes |
Set NEW NOTE alert |
Company Profile |
SEC
News |
Chart |
Request a new note
C
A
S
I |
Symbol/Exchange
Company Name
Industry Group |
PRICE |
CHANGE
(%Change) |
Day High |
Volume
(% DAV)
(% 50 day avg vol) |
52 Wk Hi
% From Hi |
Featured
Date |
Price
Featured |
Pivot Featured |
|
Max Buy |
OLED
-
NASDAQ
Universal Display Corp
Elec-Misc Products
|
$127.10
|
+2.65
2.13% |
$128.60
|
1,333,498
167.11% of 50 DAV
50 DAV is 798,000
|
$130.65
-2.72%
|
8/31/2017
|
$128.22
|
PP = $127.78
|
|
MB = $134.17
|
Most Recent Note - 8/31/2017 5:31:19 PM
Y - Highlighted in yellow in the earlier mid-day report with a new pivot point cited based on its 7/26/17 high while trying to rally from a 12-week "double bottom" base pattern. Gains backed by at least +40% above average volume and a strong close above the pivot point may trigger a technical buy signal. Very little resistance remains due to overhead supply. Recently reported +115% earnings on +59% sales revenues for the Jun '17 quarter, its 3rd consecutive strong quarter above the +25% minimum guideline (C criteria), helping it better match with the fact-based investment system's fundamental guidelines. Annual earnings (A criteria) history has been strong. See the latest FSU analysis for additional gains and a new annotated graph.
>>> FEATURED STOCK ARTICLE : Rallied Near Pivot Point But Confirming Gains Are Still Needed - 8/31/2017 |
View all notes |
Set NEW NOTE alert |
Company Profile |
SEC
News |
Chart |
Request a new note
C
A
S
I |
VEEV
-
NYSE
Veeva Systems Inc Cl A
Computer Sftwr-Medical
|
$59.50
|
+1.66
2.87% |
$59.50
|
2,155,106
161.55% of 50 DAV
50 DAV is 1,334,000
|
$68.07
-12.59%
|
7/24/2017
|
$65.91
|
PP = $68.17
|
|
MB = $71.58
|
Most Recent Note - 8/28/2017 6:14:07 PM
G - Posted a solid gain with above average volume today. On the prior session it gapped down violating its 50 DMA line and undercutting prior lows with a damaging volume-driven loss triggering technical sell signals and its color code was changed to green. A prompt rebound above the 50 DMA line is needed for its outlook to improve. Reported Jul '17 earnings +53% on +27% sales revenues. Members were recently reminded, "Volume and volatility often increase near earnings news."
>>> FEATURED STOCK ARTICLE : Slump Below 50-Day Moving Average Line Raises Concerns - 8/2/2017 |
View all notes |
Set NEW NOTE alert |
Company Profile |
SEC
News |
Chart |
Request a new note
C
A
S
I |
ANET
-
NYSE
Arista Networks Inc
TELECOMMUNICATIONS - Communication Equipment
|
$176.15
|
-1.80
-1.01% |
$179.71
|
780,232
93.78% of 50 DAV
50 DAV is 832,000
|
$178.35
-1.23%
|
8/4/2017
|
$173.31
|
PP = $163.07
|
|
MB = $171.22
|
Most Recent Note - 8/30/2017 6:36:44 PM
G - Hit a new all-time high today. Stubbornly held its ground with recent volume totals cooling, a sign few investors are headed for the exit. Prior highs in the $162 area define initial support to watch above its 50 DMA line ($160). Fundamentals remain very strong.
>>> FEATURED STOCK ARTICLE : Gapped Up After Earnings Repairing 50-Day Moving Average Violation - 8/23/2017 |
View all notes |
Set NEW NOTE alert |
Company Profile |
SEC
News |
Chart |
Request a new note
C
A
S
I |
GRUB
-
NYSE
Grubhub Inc
COMPUTER SOFTWARE and SERVICES - Technical and System Software
|
$57.09
|
+0.80
1.42% |
$57.22
|
1,524,674
78.71% of 50 DAV
50 DAV is 1,937,000
|
$57.26
-0.30%
|
6/21/2017
|
$47.33
|
PP = $46.94
|
|
MB = $49.29
|
Most Recent Note - 8/30/2017 6:31:59 PM
G - Posted a big gain today with below average volume for its second-best close ever. Stubbornly held its ground near its all-time high. Its 50 DMA line ($48.87) defines near-term support above prior highs in the $46-47 area. Recently reported earnings +13% on +32% sales revenues for the Jun '17 quarter, below the +25% minimum earnings guideline (C criteria) raising fundamental concerns.
>>> FEATURED STOCK ARTICLE : Spiked Into New High Territory Despite Sub Par Earnings News - 8/8/2017 |
View all notes |
Set NEW NOTE alert |
Company Profile |
SEC
News |
Chart |
Request a new note
C
A
S
I |
IBP
-
NYSE
Installed Building Prod
DIVERSIFIED SERVICES - Business/Management Services
|
$57.70
|
+2.75
5.00% |
$57.80
|
199,144
184.39% of 50 DAV
50 DAV is 108,000
|
$60.00
-3.83%
|
6/13/2017
|
$54.25
|
PP = $55.55
|
|
MB = $58.33
|
Most Recent Note - 8/31/2017 2:45:42 PM
Y - Rebounding toward its 52-week high after testing support near its 50 DMA line ($54.33) and prior highs. More damaging losses would raise greater concerns.
>>> FEATURED STOCK ARTICLE : Consolidating Near Prior High Following Breakout - 8/18/2017 |
View all notes |
Set NEW NOTE alert |
Company Profile |
SEC
News |
Chart |
Request a new note
C
A
S
I |
Symbol/Exchange
Company Name
Industry Group |
PRICE |
CHANGE
(%Change) |
Day High |
Volume
(% DAV)
(% 50 day avg vol) |
52 Wk Hi
% From Hi |
Featured
Date |
Price
Featured |
Pivot Featured |
|
Max Buy |
NCOM
-
NASDAQ
National Commerce Corp
BANKING - Regional - Southeast Banks
|
$39.75
|
+0.10
0.25% |
$40.05
|
31,602
105.34% of 50 DAV
50 DAV is 30,000
|
$41.25
-3.64%
|
4/25/2017
|
$38.95
|
PP = $40.09
|
|
MB = $42.09
|
Most Recent Note - 8/31/2017 2:43:12 PM
G - Consolidating in a tight range near its 50 DMA line ($39.78). Recently reported Jun '17 earnings +23% on +45% sales revenues, below the +25% minimum earnings guideline (C criteria), raising fundamental concerns.
>>> FEATURED STOCK ARTICLE : Consolidating Near 50-day Moving Average Line - 8/16/2017 |
View all notes |
Set NEW NOTE alert |
Company Profile |
SEC
News |
Chart |
Request a new note
C
A
S
I |
OLLI
-
NASDAQ
Ollie's Bargain Outlet
Retail-DiscountandVariety
|
$41.85
|
-0.85
-1.99% |
$42.95
|
776,230
114.83% of 50 DAV
50 DAV is 676,000
|
$46.08
-9.17%
|
7/17/2017
|
$43.96
|
PP = $44.18
|
|
MB = $46.39
|
Most Recent Note - 8/31/2017 3:01:35 PM
G - Color code is changed to green as today's 3rd consecutive loss has it slumping well below its 50 DMA line ($43.25) and below the recent low ($42.81 on 8/11/17) raising greater concerns. Reported earnings +29% on +21% sales revenues for the Jul '17 quarter, continuing its strong earnings track record. In recent weeks it failed to produce confirming gains above the latest pivot point backed by at least the minimum +40% above average volume necessary to trigger a proper new (or add-on) technical buy signal.
>>> FEATURED STOCK ARTICLE : Quietly Consolidating Above 50 Day Moving Average Near High - 8/10/2017 |
View all notes |
Set NEW NOTE alert |
Company Profile |
SEC
News |
Chart |
Request a new note
C
A
S
I |
HLI
-
NYSE
Houlihan Lokey Inc Cl A
Finance-Invest Bnk/Bkrs
|
$36.05
|
+0.26
0.73% |
$36.05
|
174,025
92.57% of 50 DAV
50 DAV is 188,000
|
$39.68
-9.15%
|
5/10/2017
|
$35.85
|
PP = $35.05
|
|
MB = $36.80
|
Most Recent Note - 8/29/2017 5:50:35 PM
Y - Volume was heavy behind today's small loss while still consolidating near its 50 DMA line ($35.98). Subsequent damaging losses below the recent low ($34.41 on 8/18/17) would raise serious concerns and trigger a technical sell signal. See the latest FSU analysis for more details and a new annotated graph.
>>> FEATURED STOCK ARTICLE : Consolidating Near 50-Day Moving Average - 8/29/2017 |
View all notes |
Set NEW NOTE alert |
Company Profile |
SEC
News |
Chart |
Request a new note
C
A
S
I |
|
|
|
THESE ARE NOT BUY RECOMMENDATIONS!
Comments contained in the body of this report are technical
opinions only. The material herein has been obtained
from sources believed to be reliable and accurate, however,
its accuracy and completeness cannot be guaranteed.
This site is not an investment advisor, hence it does
not endorse or recommend any securities or other investments.
Any recommendation contained in this report may not
be suitable for all investors and it is not to be deemed
an offer or solicitation on our part with respect to
the purchase or sale of any securities. All trademarks,
service marks and trade names appearing in this report
are the property of their respective owners, and are
likewise used for identification purposes only.
This report is a service available
only to active Paid Premium Members.
You may opt-out of receiving report notifications
at any time. Questions or comments may be submitted
by writing to Premium Membership Services 665 S.E. 10 Street, Suite 201 Deerfield Beach, FL 33441-5634 or by calling 1-800-965-8307
or 954-785-1121.
|
|
|