You are not logged in.
This means you
CAN ONLY VIEW reports that were published prior to Thursday, March 20, 2025.
You
MUST UPGRADE YOUR MEMBERSHIP if you want to see any current reports.
AFTER MARKET UPDATE - WEDNESDAY, SEPTEMBER 6TH, 2017
Previous After Market Report Next After Market Report >>>
|
|
|
|
DOW |
+54.33 |
21,807.64 |
+0.25% |
|
Volume |
813,377,750 |
-10% |
|
Volume |
1,870,796,600 |
-1% |
|
NASDAQ |
+17.74 |
6,393.31 |
+0.28% |
|
Advancers |
1,822 |
63% |
|
Advancers |
1,435 |
54% |
|
S&P 500 |
+7.69 |
2,465.54 |
+0.31% |
|
Decliners |
1,092 |
37% |
|
Decliners |
1,203 |
46% |
|
Russell 2000 |
+2.54 |
1,402.20 |
+0.18% |
|
52 Wk Highs |
101 |
|
|
52 Wk Highs |
42 |
|
|
S&P 600 |
+2.01 |
839.94 |
+0.24% |
|
52 Wk Lows |
21 |
|
|
52 Wk Lows |
6 |
|
|
 |
Major Indices Rose With Lighter Volume Totals
Kenneth J. Gruneisen - Passed the CAN SLIM® Master's Exam
Stocks were higher on Wednesday’s session. The Dow rose 54 points to 21807. The S&P 500 gained 8 points to 2465 and the Nasdaq Composite climbed 18 points to 6393. Volume totals reported were lighter than the prior session totals on the NYSE and on the Nasdaq exchange. Breadth was positive as advancers led decliners by more than a 3-2 margin on the NYSE but by a narrower 7-6 margin on the Nasdaq exchange. There were 42 high-ranked companies from the Leaders List that made new 52-week highs and were listed on the BreakOuts Page, versus the total of 44 on the prior session. New 52-week highs totals solidly outnumbered new 52-week lows on the Nasdaq exchange and on the NYSE. The Featured Stocks Page provides the latest analysis on noteworthy high-ranked leaders. Charts used courtesy of www.stockcharts.com
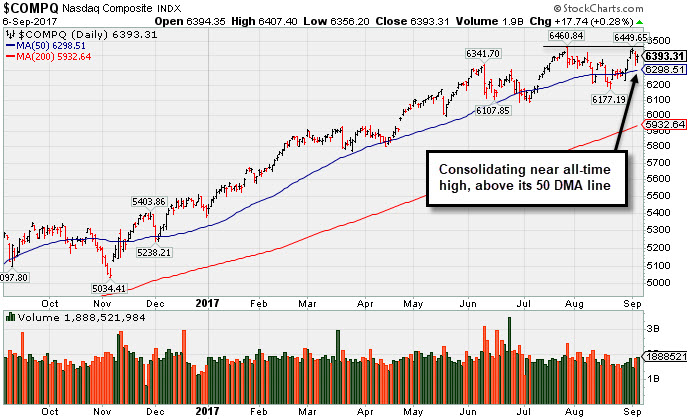 PICTURED: The Nasdaq Composite Index is consolidating near its all-time high, above Its 50-day moving average (DMA) line. Recent lows define near-term support to watch below that important short-term average.
The major averages' (M criteria) uptrend endured recent pressure however leadership has remained healthy. Investors should buy stocks meeting all key criteria of the fact-based investment system on a case-by-case basis as they trigger technical buy signals.
The major averages advanced amid optimism of a possible deal in Washington to extend the debt ceiling by three months. Updates on the economy provided a tailwind to the market. The Fed’s Beige Book report signaled the U.S. continues to grow at a modest to moderate pace. The central bank also announced that Vice Chair Stanley Fischer would step down in October. On the data front, the Institute for Supply Management said activity in the service sector expanded faster-than-forecasted last month. Another release showed the trade deficit widened less-than-anticipated in July. The generally encouraging news helped buffer geopolitical concerns surrounding North Korea and Hurricane Irma reaching Puerto Rico.
Nine of 11 S&P 500 sectors were up on the session led by the Energy sector. Exxon (XOM +2.07%) and Chevron (CVX +2.15%) rose as oil prices advanced. Telecom was the worst performing group with AT&T (T -1.40%) and Verizon (VZ -0.95%) fell . Over in Tech, Hewlett Packard Enterprise (HPE -1.92%) was lower after providing quarterly guidance below analyst estimates.
Treasuries retreated with the 10-year note down 12/32 to yield 2.10%. In commodities, NYMEX WTI crude was up 1.0% to $49.14/barrel. COMEX gold lost 0.4% to $1335.00/ounce. |
 Kenneth J. Gruneisen started out as a licensed stockbroker in August 1987, a couple of months prior to the historic stock market crash that took the Dow Jones Industrial Average down -22.6% in a single day. He has published daily fact-based fundamental and technical analysis on high-ranked stocks online for two decades. Through FACTBASEDINVESTING.COM, Kenneth provides educational articles, news, market commentary, and other information regarding proven investment systems that work in good times and bad.
Comments contained in the body of this report are technical opinions only and are not necessarily those of Gruneisen Growth Corp. The material herein has been obtained from sources believed to be reliable and accurate, however, its accuracy and completeness cannot be guaranteed. Our firm, employees, and customers may effect transactions, including transactions contrary to any recommendation herein, or have positions in the securities mentioned herein or options with respect thereto. Any recommendation contained in this report may not be suitable for all investors and it is not to be deemed an offer or solicitation on our part with respect to the purchase or sale of any securities. |
|
 |
Retail and Energy-Linked Indexes Rose
Kenneth J. Gruneisen - Passed the CAN SLIM® Master's Exam
On Wednesday the Broker/Dealer Index ($XBD -0.19%) and the Bank Index ($BKX +0.16%) were mixed and little changed while the Retail Index ($RLX +1.05%) ratcheted higher. The tech sector was quiet as there was very little change for the Semiconductor Index ($SOX -0.19%), Networking Index ($NWX -0.07%), and the Biotechnology Index ($BTK +0.15%) . Gains from energy-linked shares lifted the Oil Services Index ($OSX +1.67%) and Integrated Oil Index ($XOI +1.46%), meanwhile the Gold & Silver Index ($XAU -1.14%) fell.. Charts courtesy www.stockcharts.com
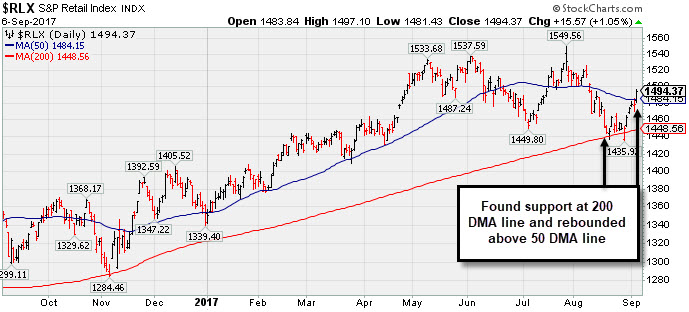
) PICTURED: The Retail Index ($RLX +1.05%) rebounded above its 50-day moving average (DMA) line. It found prompt support at its 200 DMA line.
| Oil Services |
$OSX |
127.22 |
+2.09 |
+1.67% |
-30.78% |
| Integrated Oil |
$XOI |
1,130.62 |
+16.22 |
+1.46% |
-10.83% |
| Semiconductor |
$SOX |
1,105.76 |
+2.13 |
+0.19% |
+21.99% |
| Networking |
$NWX |
449.63 |
-0.29 |
-0.07% |
+0.79% |
| Broker/Dealer |
$XBD |
221.40 |
-0.43 |
-0.19% |
+7.85% |
| Retail |
$RLX |
1,494.37 |
+15.57 |
+1.05% |
+11.27% |
| Gold & Silver |
$XAU |
91.35 |
-1.06 |
-1.15% |
+15.84% |
| Bank |
$BKX |
91.53 |
+0.15 |
+0.16% |
-0.28% |
| Biotech |
$BTK |
4,214.63 |
+6.34 |
+0.15% |
+37.06% |
|
|
|
 |
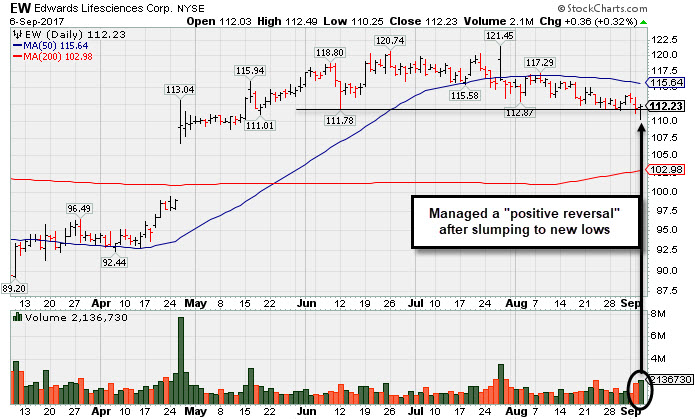
Positive Reversal After Slumping to New Lows
Kenneth J. Gruneisen - Passed the CAN SLIM® Master's Exam
Edwards Lifesciences Cp (EW +$0.36 or +0.32% to $112.23) managed a "positive reversal" after slumping to new 16-week lows today, closing with a gain backed by above average volume. It is only -7.8% off its all-time high, but its Relative Strength Rating has slumped to 70, below the 80+ minimum guideline for buy candidates. A rebound above its downward sloping 50 DMA line ($115.64) is needed for its outlook to improve. Fundamentals remain strong. More damaging losses would raise greater concerns. Subsequent volume-driven gains for new highs may trigger a new (or add-on) technical buy signal which could mark the beginning of a new leg up. Recently it reported Jun '17 quarterly earnings +42% on +11% sales revenues, continuing its strong earnings track record. Three of the past 4 quarterly comparisons had earnings above the +25% minimum guideline (C criteria) and its annual earnings growth (A criteria) is a good match with the fact-based investment system's fundamental guidelines. It was last shown in this FSU section on 8/07/17 with an annotated graph under the headline, " Near 50-Day Moving Average Line, Yet Not Far Off High". It was highlighted in yellow in the 5/16/17 mid-day report with pivot point cited based on its high after a cup-with-handle base (read here).
The Medical - Products firm has seen the number of top-rated funds owning its shares rise from 1489 in Jun '16 to 1,514 in Jun '17, a slightly reassuring sign of institutional demand (I criteria). Its current Up/Down Volume Ratio of 0.9 is an unbiased indication its shares have been under slight distributional pressure over the past 50 days. It has a B Timeliness Rating and a B Sponsorship rating.
|
|
|
Color Codes Explained :
Y - Better candidates highlighted by our
staff of experts.
G - Previously featured
in past reports as yellow but may no longer be buyable under the
guidelines.
***Last / Change / Volume data in this table is the closing quote data***
Symbol/Exchange
Company Name
Industry Group |
PRICE |
CHANGE
(%Change) |
Day High |
Volume
(% DAV)
(% 50 day avg vol) |
52 Wk Hi
% From Hi |
Featured
Date |
Price
Featured |
Pivot Featured |
|
Max Buy |
THO
-
NYSE
Thor Industries Inc
AUTOMOTIVE - Recreational Vehicles
|
$111.11
|
+0.37
0.33% |
$112.27
|
741,422
141.79% of 50 DAV
50 DAV is 522,900
|
$115.74
-4.00%
|
8/14/2017
|
$106.67
|
PP = $110.01
|
|
MB = $115.51
|
Most Recent Note - 9/5/2017 7:13:55 PM
Y - Posted a gain backed by +77% above average volume and closed well above the previously cited pivot point triggering a technical buy signal. However, its current Relative Strength Rating of 77 is below the 80+ minimum guideline for buy candidates under the fact-based investment system. Very little resistance remains due to overhead supply up to its $115.74 all-time high.
>>> FEATURED STOCK ARTICLE : Slump Below 50-Day Average Hurt Technical Stance - 8/21/2017 |
View all notes |
Set NEW NOTE alert |
Company Profile |
SEC
News |
Chart |
Request a new note
C
A
S
I |
BERY
-
NYSE
Berry Plastics Group Inc
CONSUMER NON-DURABLES - Packaging and Containers
|
$56.00
|
-0.27
-0.48% |
$56.27
|
1,551,160
182.43% of 50 DAV
50 DAV is 850,300
|
$58.95
-5.00%
|
7/14/2017
|
$57.67
|
PP = $59.05
|
|
MB = $62.00
|
 Most Recent Note - 9/6/2017 5:13:08 PM
It will be dropped from the Featured Stocks list tonight. Undercut prior lows with its early volume-driven loss yet found prompt support and finished in the upper third of its intra-day range. A rebound above the 50 DMA line is needed for its outlook to improve. The Relative Strength Rating has slumped to 71, below the 80+ minimum guideline for buy candidates. Recently reported Jun '17 quarterly earnings +13% on +16% sales revenues, below the +25% minimum earnings guideline (C criteria), raising fundamental concerns.
>>> FEATURED STOCK ARTICLE : Fundamental Concerns Yet Rebound Helped Technical Stance - 8/14/2017 |
View all notes |
Set NEW NOTE alert |
Company Profile |
SEC
News |
Chart |
Request a new note
C
A
S
I |
HSKA
-
NASDAQ
Heska Corporation
DRUGS - Biotechnology
|
$97.12
|
-1.98
-2.00% |
$99.79
|
50,184
78.41% of 50 DAV
50 DAV is 64,000
|
$115.00
-15.55%
|
7/31/2017
|
$114.27
|
PP = $110.35
|
|
MB = $115.87
|
Most Recent Note - 9/5/2017 7:18:44 PM
G - Slumped back below its 50 DMA line ($100.73) closing near the session low today and its color code is changed to green. Recent lows in the $95 area define the next important support to watch
>>> FEATURED STOCK ARTICLE : Rally Above 50-Day Moving Average Line Improved Technical Stance - 8/30/2017 |
View all notes |
Set NEW NOTE alert |
Company Profile |
SEC
News |
Chart |
Request a new note
C
A
S
I |
AVGO
-
NASDAQ
Broadcom Limited
ELECTRONICS - Semiconductor - Broad Line
|
$249.38
|
+0.33
0.13% |
$251.31
|
1,383,901
56.12% of 50 DAV
50 DAV is 2,466,000
|
$259.36
-3.85%
|
8/24/2017
|
$252.44
|
PP = $256.89
|
|
MB = $269.73
|
Most Recent Note - 9/5/2017 7:27:53 PM
Y - Color code is changed to yellow while consolidating near its 50 DMA line ($247) after enduring distributional pressure. Recent lows define the next important support in the $238-240 area. Subsequent violations would trigger more worrisome technical sell signals. Fundamentals remain strong. It has not produced volume-driven gains since highlighted in the 8/24/17 mid-day report - "Subsequent volume-driven gains above the pivot and for new highs may trigger a technical buy signal."
>>> FEATURED STOCK ARTICLE : Pullback Followed Latest Strong Earnings Report From Tech Leader - 8/25/2017 |
View all notes |
Set NEW NOTE alert |
Company Profile |
SEC
News |
Chart |
Request a new note
C
A
S
I |
EW
-
NYSE
Edwards Lifesciences Cp
HEALTH SERVICES - Medical Appliances and Equipment
|
$112.23
|
+0.36
0.32% |
$112.49
|
2,132,737
177.79% of 50 DAV
50 DAV is 1,199,600
|
$121.75
-7.82%
|
7/11/2017
|
$117.23
|
PP = $121.85
|
|
MB = $127.94
|
Most Recent Note - 9/6/2017 5:30:21 PM
G - Managed a "positive reversal" after slumping to new 16-week lows today, closing with a gain backed by above average volume.It is only -7.8% off its all-time high, but its Relative Strength Rating has slumped to 70, below the 80+ minimum guideline for buy candidates. A rebound above its downward sloping 50 DMA line ($115.64) is needed for its outlook to improve. Fundamentals remain strong.
>>> FEATURED STOCK ARTICLE : Positive Reversal After Slumping to New Lows - 9/6/2017 |
View all notes |
Set NEW NOTE alert |
Company Profile |
SEC
News |
Chart |
Request a new note
C
A
S
I |
Symbol/Exchange
Company Name
Industry Group |
PRICE |
CHANGE
(%Change) |
Day High |
Volume
(% DAV)
(% 50 day avg vol) |
52 Wk Hi
% From Hi |
Featured
Date |
Price
Featured |
Pivot Featured |
|
Max Buy |
STMP
-
NASDAQ
Stamps.com Inc
INTERNET - Internet Software and Services
|
$188.30
|
-2.20
-1.15% |
$191.40
|
298,655
62.74% of 50 DAV
50 DAV is 476,000
|
$220.25
-14.51%
|
5/24/2017
|
$133.10
|
PP = $136.10
|
|
MB = $142.91
|
Most Recent Note - 8/31/2017 2:47:25 PM
G - Very extended from any sound base. Its 50 DMA line ($172) defines near-term support above prior highs in the $156 area. Fundamentals remain strong.
>>> FEATURED STOCK ARTICLE : Blasted Higher After Latest Strong Earnings Report - 8/11/2017 |
View all notes |
Set NEW NOTE alert |
Company Profile |
SEC
News |
Chart |
Request a new note
C
A
S
I |
HTHT
-
NASDAQ
China Lodging Group Ads
LEISURE - Lodging
|
$113.18
|
-0.57
-0.50% |
$114.86
|
314,568
100.82% of 50 DAV
50 DAV is 312,000
|
$118.00
-4.08%
|
9/29/2016
|
$46.12
|
PP = $47.82
|
|
MB = $50.21
|
Most Recent Note - 9/6/2017 5:24:40 PM
G - Perched near its all-time high, very extended from any sound base. Recently reported earnings +19% on +18% sales revenues for the Jun '17 quarter, below the +25% minimum earnings guideline (C criteria). Its 50 DMA line ($97.16) defines support above prior highs in the $88 area.
>>> FEATURED STOCK ARTICLE : Extended From Sound Base With Earnings News Due Next Week - 8/9/2017 |
View all notes |
Set NEW NOTE alert |
Company Profile |
SEC
News |
Chart |
Request a new note
C
A
S
I |
LMAT
-
NASDAQ
Lemaitre Vascular Inc
Medical-Products
|
$36.89
|
-0.28
-0.75% |
$37.62
|
277,890
132.96% of 50 DAV
50 DAV is 209,000
|
$37.90
-2.66%
|
7/28/2017
|
$33.50
|
PP = $33.32
|
|
MB = $34.99
|
Most Recent Note - 9/5/2017 7:22:38 PM
G - Hit another new all-time high with today's gain backed by +50% above average volume, getting more extended from any sound base. Prior highs and the 50 DMA line define near-term support to watch in the $33 area.
>>> FEATURED STOCK ARTICLE : Volume-Driven Gain for New High And Strong Finish Bode Well - 8/28/2017 |
View all notes |
Set NEW NOTE alert |
Company Profile |
SEC
News |
Chart |
Request a new note
C
A
S
I |
BEAT
-
NASDAQ
BioTelemetry Inc
Medical-Services
|
$37.80
|
+0.05
0.13% |
$38.00
|
218,348
52.69% of 50 DAV
50 DAV is 414,400
|
$38.25
-1.18%
|
2/14/2017
|
$25.10
|
PP = $24.55
|
|
MB = $25.78
|
Most Recent Note - 9/6/2017 5:20:10 PM
G - Posted a 5th consecutive small gain today on light volume. Fundamental concerns remain. Jun '17 quarterly earnings rose +10% on +10% sales revenues, its 2nd consecutive quarterly comparison below the +25% minimum earnings guideline (C criteria). Its 50 DMA line ($34.69) defines near-term support along with prior lows.
>>> FEATURED STOCK ARTICLE : Technically Strong Despite Recent Fundamental Concerns - 8/17/2017 |
View all notes |
Set NEW NOTE alert |
Company Profile |
SEC
News |
Chart |
Request a new note
C
A
S
I |
ESNT
-
NYSE
Essent Group Ltd
Finance-MrtgandRel Svc
|
$36.94
|
-0.36
-0.97% |
$37.94
|
502,125
79.20% of 50 DAV
50 DAV is 634,000
|
$41.44
-10.86%
|
7/3/2017
|
$38.05
|
PP = $39.60
|
|
MB = $41.58
|
Most Recent Note - 9/5/2017 7:15:27 PM
G - Slumped below its 50 DMA line ($38.38) hurting its outlook and its color code is changed to green. Completed a new Public Offering on 8/08/17. Prior lows ($36.71 on 8/11/17) and its 200 DMA line define near-term support in the $35-36 area. See the latest FSU analysis for more details and a new annotated graph.
>>> FEATURED STOCK ARTICLE : Undercut 50-Day Moving Average in Slump Toward Prior Lows - 9/5/2017 |
View all notes |
Set NEW NOTE alert |
Company Profile |
SEC
News |
Chart |
Request a new note
C
A
S
I |
Symbol/Exchange
Company Name
Industry Group |
PRICE |
CHANGE
(%Change) |
Day High |
Volume
(% DAV)
(% 50 day avg vol) |
52 Wk Hi
% From Hi |
Featured
Date |
Price
Featured |
Pivot Featured |
|
Max Buy |
OLED
-
NASDAQ
Universal Display Corp
Elec-Misc Products
|
$128.95
|
-0.75
-0.58% |
$133.50
|
1,374,319
172.00% of 50 DAV
50 DAV is 799,000
|
$130.65
-1.30%
|
8/31/2017
|
$128.22
|
PP = $127.78
|
|
MB = $134.17
|
Most Recent Note - 9/6/2017 1:19:18 PM
Y - Erased most of its early gain today. Posted a big gain on 9/05/17 with +53% above average volume for a best-ever close, rallying from a "double bottom" base and triggering a technical buy signal. Highlighted in yellow in the 8/31/17 mid-day report with a new pivot point cited based on its 7/26/17 high. No resistance remains due to overhead supply. See the latest FSU analysis for additional gains and an annotated graph.
>>> FEATURED STOCK ARTICLE : Rallied Near Pivot Point But Confirming Gains Are Still Needed - 8/31/2017 |
View all notes |
Set NEW NOTE alert |
Company Profile |
SEC
News |
Chart |
Request a new note
C
A
S
I |
VEEV
-
NYSE
Veeva Systems Inc Cl A
Computer Sftwr-Medical
|
$58.24
|
-0.48
-0.82% |
$59.10
|
951,379
70.26% of 50 DAV
50 DAV is 1,354,000
|
$68.07
-14.44%
|
7/24/2017
|
$65.91
|
PP = $68.17
|
|
MB = $71.58
|
Most Recent Note - 9/1/2017 6:15:08 PM
G - Posted a 5th consecutive gain. Gapped down on 8/25/17 violating its 50 DMA line and undercutting prior lows triggering technical sell signals. A rebound above the 50 DMA line ($62.37) is needed for its outlook to improve. Fundamentals remain strong. See the latest FSU analysis for more details and a new annotated graph.
>>> FEATURED STOCK ARTICLE : Rebounding After gap Down Violated 50-Day Average and Prior Lows - 9/1/2017 |
View all notes |
Set NEW NOTE alert |
Company Profile |
SEC
News |
Chart |
Request a new note
C
A
S
I |
ANET
-
NYSE
Arista Networks Inc
TELECOMMUNICATIONS - Communication Equipment
|
$172.73
|
-2.50
-1.43% |
$176.45
|
835,718
102.54% of 50 DAV
50 DAV is 815,000
|
$179.71
-3.88%
|
8/4/2017
|
$173.31
|
PP = $163.07
|
|
MB = $171.22
|
Most Recent Note - 9/6/2017 5:18:45 PM
G - Perched near its all-time high, stubbornly holding its ground. Prior highs in the $162 area define initial support to watch above its 50 DMA line ($161). Fundamentals remain very strong.
>>> FEATURED STOCK ARTICLE : Gapped Up After Earnings Repairing 50-Day Moving Average Violation - 8/23/2017 |
View all notes |
Set NEW NOTE alert |
Company Profile |
SEC
News |
Chart |
Request a new note
C
A
S
I |
GRUB
-
NYSE
Grubhub Inc
COMPUTER SOFTWARE and SERVICES - Technical and System Software
|
$56.75
|
+0.45
0.80% |
$57.03
|
1,143,855
62.71% of 50 DAV
50 DAV is 1,824,000
|
$57.29
-0.94%
|
6/21/2017
|
$47.33
|
PP = $46.94
|
|
MB = $49.29
|
Most Recent Note - 9/6/2017 5:23:32 PM
G - Still stubbornly holding its ground near its all-time high. Its 50 DMA line ($49.69) defines near-term support above prior highs in the $46-47 area. Recently reported earnings +13% on +32% sales revenues for the Jun '17 quarter, below the +25% minimum earnings guideline (C criteria) raising fundamental concerns.
>>> FEATURED STOCK ARTICLE : Spiked Into New High Territory Despite Sub Par Earnings News - 8/8/2017 |
View all notes |
Set NEW NOTE alert |
Company Profile |
SEC
News |
Chart |
Request a new note
C
A
S
I |
IBP
-
NYSE
Installed Building Prod
DIVERSIFIED SERVICES - Business/Management Services
|
$56.70
|
+1.45
2.62% |
$57.10
|
98,736
93.15% of 50 DAV
50 DAV is 106,000
|
$60.00
-5.50%
|
6/13/2017
|
$54.25
|
PP = $55.55
|
|
MB = $58.33
|
Most Recent Note - 9/5/2017 7:20:18 PM
Y - Down with higher volume today while falling toward its 50 DMA line ($54.45) and prior lows defining near-term support. More damaging losses would raise greater concerns.
>>> FEATURED STOCK ARTICLE : Consolidating Near Prior High Following Breakout - 8/18/2017 |
View all notes |
Set NEW NOTE alert |
Company Profile |
SEC
News |
Chart |
Request a new note
C
A
S
I |
Symbol/Exchange
Company Name
Industry Group |
PRICE |
CHANGE
(%Change) |
Day High |
Volume
(% DAV)
(% 50 day avg vol) |
52 Wk Hi
% From Hi |
Featured
Date |
Price
Featured |
Pivot Featured |
|
Max Buy |
NCOM
-
NASDAQ
National Commerce Corporation
BANKING - Regional - Southeast Banks
|
$39.40
|
+0.10
0.25% |
$39.70
|
17,054
67.94% of 50 DAV
50 DAV is 25,100
|
$41.25
-4.48%
|
4/25/2017
|
$38.95
|
PP = $40.09
|
|
MB = $42.09
|
Most Recent Note - 8/31/2017 2:43:12 PM
G - Consolidating in a tight range near its 50 DMA line ($39.78). Recently reported Jun '17 earnings +23% on +45% sales revenues, below the +25% minimum earnings guideline (C criteria), raising fundamental concerns.
>>> FEATURED STOCK ARTICLE : Consolidating Near 50-day Moving Average Line - 8/16/2017 |
View all notes |
Set NEW NOTE alert |
Company Profile |
SEC
News |
Chart |
Request a new note
C
A
S
I |
OLLI
-
NASDAQ
Ollie's Bargain Outlet
Retail-DiscountandVariety
|
$43.35
|
+0.00
0.00% |
$43.85
|
526,081
87.68% of 50 DAV
50 DAV is 600,000
|
$46.08
-5.91%
|
7/17/2017
|
$43.96
|
PP = $44.18
|
|
MB = $46.39
|
Most Recent Note - 9/1/2017 6:17:33 PM
G - Quietly rebounded toward its 50 DMA line ($43.32) today, but it needs gains above that important short-term average for its outlook to improve. Reported earnings +29% on +21% sales revenues for the Jul '17 quarter, continuing its strong earnings track record. In recent weeks it failed to produce confirming gains above the latest pivot point backed by at least the minimum +40% above average volume necessary to trigger a proper new (or add-on) technical buy signal.
>>> FEATURED STOCK ARTICLE : Quietly Consolidating Above 50 Day Moving Average Near High - 8/10/2017 |
View all notes |
Set NEW NOTE alert |
Company Profile |
SEC
News |
Chart |
Request a new note
C
A
S
I |
HLI
-
NYSE
Houlihan Lokey Inc Cl A
Finance-Invest Bnk/Bkrs
|
$35.69
|
-0.01
-0.03% |
$35.98
|
242,485
124.99% of 50 DAV
50 DAV is 194,000
|
$39.68
-10.06%
|
5/10/2017
|
$35.85
|
PP = $35.05
|
|
MB = $36.80
|
Most Recent Note - 9/5/2017 7:31:20 PM
G - Volume was higher behind today's loss while slumping back below its 50 DMA line ($36.09) and its color code is changed to green. Subsequent damaging losses below the recent low ($34.41 on 8/18/17) would raise more serious concerns and trigger a technical sell signal.
>>> FEATURED STOCK ARTICLE : Consolidating Near 50-Day Moving Average - 8/29/2017 |
View all notes |
Set NEW NOTE alert |
Company Profile |
SEC
News |
Chart |
Request a new note
C
A
S
I |
|
|
|
THESE ARE NOT BUY RECOMMENDATIONS!
Comments contained in the body of this report are technical
opinions only. The material herein has been obtained
from sources believed to be reliable and accurate, however,
its accuracy and completeness cannot be guaranteed.
This site is not an investment advisor, hence it does
not endorse or recommend any securities or other investments.
Any recommendation contained in this report may not
be suitable for all investors and it is not to be deemed
an offer or solicitation on our part with respect to
the purchase or sale of any securities. All trademarks,
service marks and trade names appearing in this report
are the property of their respective owners, and are
likewise used for identification purposes only.
This report is a service available
only to active Paid Premium Members.
You may opt-out of receiving report notifications
at any time. Questions or comments may be submitted
by writing to Premium Membership Services 665 S.E. 10 Street, Suite 201 Deerfield Beach, FL 33441-5634 or by calling 1-800-965-8307
or 954-785-1121.
|
|
|