You are not logged in.
This means you
CAN ONLY VIEW reports that were published prior to Sunday, October 20, 2024.
You
MUST UPGRADE YOUR MEMBERSHIP if you want to see any current reports.
AFTER MARKET UPDATE - MONDAY, SEPTEMBER 11TH, 2017
Previous After Market Report Next After Market Report >>>
|
|
|
|
DOW |
+259.58 |
22,057.37 |
+1.19% |
|
Volume |
794,850,760 |
-1% |
|
Volume |
1,813,207,210 |
+1% |
|
NASDAQ |
+72.07 |
6,432.26 |
+1.13% |
|
Advancers |
2,319 |
79% |
|
Advancers |
1,706 |
66% |
|
S&P 500 |
+26.68 |
2,488.11 |
+1.08% |
|
Decliners |
627 |
21% |
|
Decliners |
864 |
34% |
|
Russell 2000 |
+15.40 |
1,414.83 |
+1.10% |
|
52 Wk Highs |
209 |
|
|
52 Wk Highs |
238 |
|
|
S&P 600 |
+8.81 |
847.73 |
+1.05% |
|
52 Wk Lows |
14 |
|
|
52 Wk Lows |
24 |
|
|
 |
Leadership Expanded as Major Indices Posted Solid Gains
Kenneth J. Gruneisen - Passed the CAN SLIM® Master's Exam
Stocks were sharply higher Monday. The Dow was up 259 points to 22057, and the benchmark S&P 500 Index managed a best-ever close as it gained 26 points to 2488. The Nasdaq added 72 points to 6432. Volume totals reported were mixed, lower than the prior session total on the NYSE and higher on the Nasdaq exchange. Breadth was solidly positive as advancers led decliners by nearly a 4-1 margin on the NYSE and by a 2-1 margin on the Nasdaq exchange. There were 84 high-ranked companies from the Leaders List that made new 52-week highs and were listed on the BreakOuts Page, versus the total of 48 on the prior session. New 52-week highs totals expanded and solidly outnumbered shrinking new 52-week lows totals on the Nasdaq exchange and on the NYSE. The Featured Stocks Page provides the latest analysis on noteworthy high-ranked leaders. Charts used courtesy of www.stockcharts.com
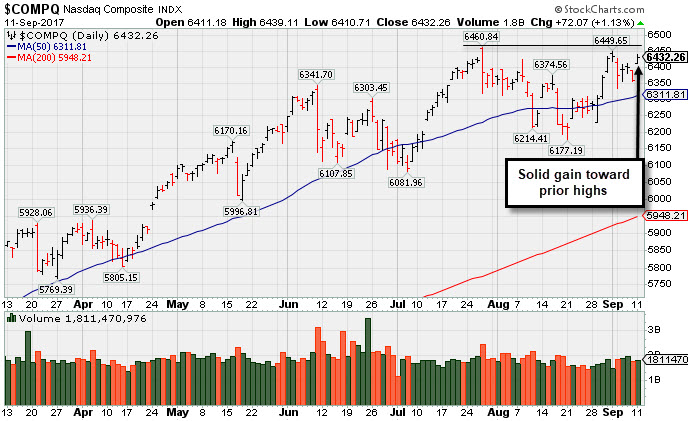 PICTURED: The Nasdaq Composite Index gapped up for a solid gain, rallying toward prior highs..
The major averages' (M criteria) uptrend endured recent pressure however leadership has remained healthy. Investors should buy stocks meeting all key criteria of the fact-based investment system on a case-by-case basis as they trigger technical buy signals.
The major US averages closed near record highs and moved into positive territory for the month as concerns over Hurricane Irma eased. Elsewhere, gold fell with treasury yields, while the US Dollar rebounded as North Korea surprised some analysts by not conducting a missile test over the weekend.
All 11 sectors of the S&P were up on the day with Financials and Technology pacing the gains. Apple (AAPL +1.81%) rose, reversing a recent a four-day decline in anticipation of the latest iPhone launch on Tuesday. Insurers rebounded as claims related to Hurricane Irma are now anticipated to come in below last week’s most pessimistic projections. XL Capital (XL +5.02%) and Everest RE (RE 4.26%) both notched big gains. The world’s largest generic drug maker Teva (TEVA +19.35%) gapped up for a considerable gain amid optimistic analyst response to the announcement of a new CEO.
Treasuries retreated along the curve with the benchmark 10-year note declining 22/32 to yield 2.13% as a perceived “risk on” trade took hold in the markets today. In commodities, NYMEX WTI crude added 1.1% to $48.03/barrel while COMEX gold slid 1.5% to $1327.60/ounce. In FOREX the US Dollar Index snapped an eight session losing streak to climb 0.6% against its peers. |
 Kenneth J. Gruneisen started out as a licensed stockbroker in August 1987, a couple of months prior to the historic stock market crash that took the Dow Jones Industrial Average down -22.6% in a single day. He has published daily fact-based fundamental and technical analysis on high-ranked stocks online for two decades. Through FACTBASEDINVESTING.COM, Kenneth provides educational articles, news, market commentary, and other information regarding proven investment systems that work in good times and bad.
Comments contained in the body of this report are technical opinions only and are not necessarily those of Gruneisen Growth Corp. The material herein has been obtained from sources believed to be reliable and accurate, however, its accuracy and completeness cannot be guaranteed. Our firm, employees, and customers may effect transactions, including transactions contrary to any recommendation herein, or have positions in the securities mentioned herein or options with respect thereto. Any recommendation contained in this report may not be suitable for all investors and it is not to be deemed an offer or solicitation on our part with respect to the purchase or sale of any securities. |
|
 |
Financial, Tech, Retail, and Energy-Linked Groups Rose
Kenneth J. Gruneisen - Passed the CAN SLIM® Master's Exam
On Monday the Broker/Dealer Index ($XBD +1.67%) and the Bank Index ($BKX +2.03%) both posted solid gains while the Retail Index ($RLX +0.56%) also ended higher. The tech sector had a positive bias as the Semiconductor Index ($SOX +2.01%) outpaced the Networking Index ($NWX +1.25%) while the Biotechnology Index ($BTK +0.32%) edged higher. Commodity-linked groups were mixed as the Gold & Silver Index ($XAU -2.23%) fell while the Integrated Oil Index ($XOI +0.87%) and the Oil Services Index ($OSX +1.39%) both rose. Charts courtesy www.stockcharts.com
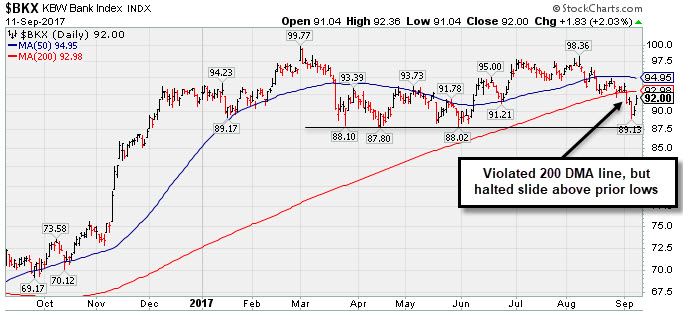 PICTURED: The Bank Index ($BKX +2.03%).recently violated its 200-day moving average line but halted its slide above prior lows. The financial indexes are reliable "leading indicators", so further deterioration would be very bad news for the broader market outlook, meanwhile, a rebound above the 200 DMA line would be a reassuring sign.
| Oil Services |
$OSX |
126.58 |
+1.74 |
+1.39% |
-31.13% |
| Integrated Oil |
$XOI |
1,136.34 |
+9.80 |
+0.87% |
-10.38% |
| Semiconductor |
$SOX |
1,115.46 |
+21.97 |
+2.01% |
+23.06% |
| Networking |
$NWX |
452.14 |
+5.57 |
+1.25% |
+1.35% |
| Broker/Dealer |
$XBD |
223.59 |
+3.67 |
+1.67% |
+8.92% |
| Retail |
$RLX |
1,504.97 |
+10.65 |
+0.71% |
+12.06% |
| Gold & Silver |
$XAU |
89.61 |
-2.04 |
-2.23% |
+13.63% |
| Bank |
$BKX |
92.00 |
+1.83 |
+2.03% |
+0.23% |
| Biotech |
$BTK |
4,203.91 |
+13.33 |
+0.32% |
+36.71% |
|
|
|
 |
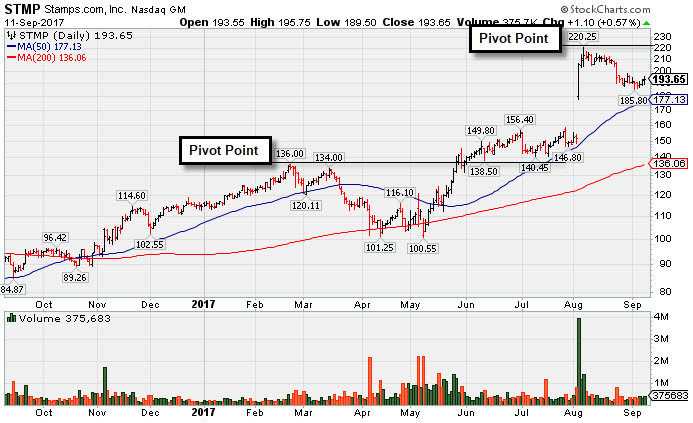
New Base Being Built After Considerable Gap Higher
Kenneth J. Gruneisen - Passed the CAN SLIM® Master's Exam
Stamps.Com Inc (STMP +$1.10 or +0.57% to $193.65) has formed some of tight consolidations while its 50-day moving average (DMA) line ($177) has been catching up. A new pivot point is cited based on its 8/07/17 high plus 10 cents, as it is building on flat base of sufficient length to be valid. It faces some near-term resistance. Subsequent volume-driven gains above the pivot point are needed to trigger a new (or add-on) technical buy signal. The 50 DMA line defines near-term support well above prior highs in the $156 area.
Fundamentals remain strong. There was a considerable gap higher on 8/03/17 following strong earnings news as it reported Jun '17 quarterly earnings +61% on +38% sales revenues. The bullish action was last shown in this FSU section with an annotated graph on 8/11/17 under the headline, "Blasted Higher After Latest Strong Earnings Report".
It has earned an Earnings Per Share Rating of 99, putting it in the top 1% of all publicly traded stocks based on its earnings history over the past 5 years. Currently it has a Timeliness Rating of A and a Sponsorship rating of B.
The Retail - Internet group has a 98 Relative Strength Rating.The number of top-rated funds owning its shares rose from 354 in Dec '16 to 392 in Jun '17, a reassuring sign in recent months concerning the I criteria. Its current Up/Down Volume ratio of 1.4 is an unbiased indication its shares have been under accumulation over the past 50 days. Its small supply of only 16.9 million shares outstanding (S criteria) can contribute to greater price volatility in the event of institutional buying or selling. |
|
|
Color Codes Explained :
Y - Better candidates highlighted by our
staff of experts.
G - Previously featured
in past reports as yellow but may no longer be buyable under the
guidelines.
***Last / Change / Volume data in this table is the closing quote data***
Symbol/Exchange
Company Name
Industry Group |
PRICE |
CHANGE
(%Change) |
Day High |
Volume
(% DAV)
(% 50 day avg vol) |
52 Wk Hi
% From Hi |
Featured
Date |
Price
Featured |
Pivot Featured |
|
Max Buy |
THO
-
NYSE
Thor Industries Inc
AUTOMOTIVE - Recreational Vehicles
|
$109.83
|
+0.13
0.12% |
$111.67
|
533,198
101.97% of 50 DAV
50 DAV is 522,900
|
$115.74
-5.10%
|
8/14/2017
|
$106.67
|
PP = $110.01
|
|
MB = $115.51
|
Most Recent Note - 9/5/2017 7:13:55 PM
Y - Posted a gain backed by +77% above average volume and closed well above the previously cited pivot point triggering a technical buy signal. However, its current Relative Strength Rating of 77 is below the 80+ minimum guideline for buy candidates under the fact-based investment system. Very little resistance remains due to overhead supply up to its $115.74 all-time high.
>>> FEATURED STOCK ARTICLE : Slump Below 50-Day Average Hurt Technical Stance - 8/21/2017 |
View all notes |
Set NEW NOTE alert |
Company Profile |
SEC
News |
Chart |
Request a new note
C
A
S
I |
HSKA
-
NASDAQ
Heska Corporation
DRUGS - Biotechnology
|
$100.40
|
+0.92
0.92% |
$101.97
|
82,043
128.19% of 50 DAV
50 DAV is 64,000
|
$115.00
-12.70%
|
7/31/2017
|
$114.27
|
PP = $110.35
|
|
MB = $115.87
|
Most Recent Note - 9/5/2017 7:18:44 PM
G - Slumped back below its 50 DMA line ($100.73) closing near the session low today and its color code is changed to green. Recent lows in the $95 area define the next important support to watch
>>> FEATURED STOCK ARTICLE : Rally Above 50-Day Moving Average Line Improved Technical Stance - 8/30/2017 |
View all notes |
Set NEW NOTE alert |
Company Profile |
SEC
News |
Chart |
Request a new note
C
A
S
I |
AVGO
-
NASDAQ
Broadcom Limited
ELECTRONICS - Semiconductor - Broad Line
|
$247.74
|
+3.63
1.49% |
$248.24
|
1,663,584
69.84% of 50 DAV
50 DAV is 2,382,000
|
$259.36
-4.48%
|
8/24/2017
|
$252.44
|
PP = $256.89
|
|
MB = $269.73
|
Most Recent Note - 9/5/2017 7:27:53 PM
Y - Color code is changed to yellow while consolidating near its 50 DMA line ($247) after enduring distributional pressure. Recent lows define the next important support in the $238-240 area. Subsequent violations would trigger more worrisome technical sell signals. Fundamentals remain strong. It has not produced volume-driven gains since highlighted in the 8/24/17 mid-day report - "Subsequent volume-driven gains above the pivot and for new highs may trigger a technical buy signal."
>>> FEATURED STOCK ARTICLE : Pullback Followed Latest Strong Earnings Report From Tech Leader - 8/25/2017 |
View all notes |
Set NEW NOTE alert |
Company Profile |
SEC
News |
Chart |
Request a new note
C
A
S
I |
EW
-
NYSE
Edwards Lifesciences Cp
HEALTH SERVICES - Medical Appliances and Equipment
|
$115.13
|
+1.94
1.71% |
$115.42
|
1,095,580
87.10% of 50 DAV
50 DAV is 1,257,900
|
$121.75
-5.44%
|
7/11/2017
|
$117.23
|
PP = $121.85
|
|
MB = $127.94
|
Most Recent Note - 9/6/2017 5:30:21 PM
G - Managed a "positive reversal" after slumping to new 16-week lows today, closing with a gain backed by above average volume.It is only -7.8% off its all-time high, but its Relative Strength Rating has slumped to 70, below the 80+ minimum guideline for buy candidates. A rebound above its downward sloping 50 DMA line ($115.64) is needed for its outlook to improve. Fundamentals remain strong.
>>> FEATURED STOCK ARTICLE : Positive Reversal After Slumping to New Lows - 9/6/2017 |
View all notes |
Set NEW NOTE alert |
Company Profile |
SEC
News |
Chart |
Request a new note
C
A
S
I |
STMP
-
NASDAQ
Stamps.com Inc
INTERNET - Internet Software and Services
|
$193.65
|
+1.10
0.57% |
$195.75
|
375,350
78.86% of 50 DAV
50 DAV is 476,000
|
$220.25
-12.08%
|
9/11/2017
|
$193.65
|
PP = $220.35
|
|
MB = $231.37
|
 Most Recent Note - 9/11/2017 6:42:41 PM
Y - Color code is changed to yellow with new pivot point cited based on its 8/07/17 high plus 10 cents. Faces some near-term resistance, and subsequent volume-driven gains above the pivot point are needed to trigger a new (or add-on) technical buy signal. Its 50 DMA line ($177) defines near-term support above prior highs in the $156 area. Fundamentals remain strong. See the latest FSU analysis for more details and a new annotated graph.
>>> FEATURED STOCK ARTICLE : New Base Being Built After Considerable Gap Higher - 9/11/2017 |
View all notes |
Set NEW NOTE alert |
Company Profile |
SEC
News |
Chart |
Request a new note
C
A
S
I |
Symbol/Exchange
Company Name
Industry Group |
PRICE |
CHANGE
(%Change) |
Day High |
Volume
(% DAV)
(% 50 day avg vol) |
52 Wk Hi
% From Hi |
Featured
Date |
Price
Featured |
Pivot Featured |
|
Max Buy |
HTHT
-
NASDAQ
China Lodging Group Ads
LEISURE - Lodging
|
$112.40
|
-0.96
-0.85% |
$114.64
|
417,242
132.88% of 50 DAV
50 DAV is 314,000
|
$118.00
-4.75%
|
9/29/2016
|
$46.12
|
PP = $47.82
|
|
MB = $50.21
|
Most Recent Note - 9/6/2017 5:24:40 PM
G - Perched near its all-time high, very extended from any sound base. Recently reported earnings +19% on +18% sales revenues for the Jun '17 quarter, below the +25% minimum earnings guideline (C criteria). Its 50 DMA line ($97.16) defines support above prior highs in the $88 area.
>>> FEATURED STOCK ARTICLE : Extended From Sound Base With Earnings News Due Next Week - 8/9/2017 |
View all notes |
Set NEW NOTE alert |
Company Profile |
SEC
News |
Chart |
Request a new note
C
A
S
I |
LMAT
-
NASDAQ
Lemaitre Vascular Inc
Medical-Products
|
$38.05
|
+0.45
1.20% |
$38.25
|
185,147
86.11% of 50 DAV
50 DAV is 215,000
|
$37.90
0.40%
|
7/28/2017
|
$33.50
|
PP = $33.32
|
|
MB = $34.99
|
Most Recent Note - 9/5/2017 7:22:38 PM
G - Hit another new all-time high with today's gain backed by +50% above average volume, getting more extended from any sound base. Prior highs and the 50 DMA line define near-term support to watch in the $33 area.
>>> FEATURED STOCK ARTICLE : Volume-Driven Gain for New High And Strong Finish Bode Well - 8/28/2017 |
View all notes |
Set NEW NOTE alert |
Company Profile |
SEC
News |
Chart |
Request a new note
C
A
S
I |
BEAT
-
NASDAQ
BioTelemetry Inc
Medical-Services
|
$37.95
|
-0.50
-1.30% |
$39.20
|
488,059
120.03% of 50 DAV
50 DAV is 406,600
|
$38.95
-2.57%
|
2/14/2017
|
$25.10
|
PP = $24.55
|
|
MB = $25.78
|
Most Recent Note - 9/6/2017 5:20:10 PM
G - Posted a 5th consecutive small gain today on light volume. Fundamental concerns remain. Jun '17 quarterly earnings rose +10% on +10% sales revenues, its 2nd consecutive quarterly comparison below the +25% minimum earnings guideline (C criteria). Its 50 DMA line ($34.69) defines near-term support along with prior lows.
>>> FEATURED STOCK ARTICLE : Technically Strong Despite Recent Fundamental Concerns - 8/17/2017 |
View all notes |
Set NEW NOTE alert |
Company Profile |
SEC
News |
Chart |
Request a new note
C
A
S
I |
ESNT
-
NYSE
Essent Group Ltd
Finance-MrtgandRel Svc
|
$37.49
|
+0.87
2.38% |
$37.67
|
658,500
98.64% of 50 DAV
50 DAV is 667,600
|
$41.44
-9.53%
|
7/3/2017
|
$38.05
|
PP = $39.60
|
|
MB = $41.58
|
Most Recent Note - 9/11/2017 6:45:35 PM
G - Posted a 2nd consecutive gain today after testing support at its 200 DMA line. A rebound above its 50 DMA line ($38.41) is needed for its outlook to improve. Completed a new Public Offering on 8/08/17.
>>> FEATURED STOCK ARTICLE : Undercut 50-Day Moving Average in Slump Toward Prior Lows - 9/5/2017 |
View all notes |
Set NEW NOTE alert |
Company Profile |
SEC
News |
Chart |
Request a new note
C
A
S
I |
OLED
-
NASDAQ
Universal Display Corp
Elec-Misc Products
|
$132.30
|
+4.65
3.64% |
$132.90
|
1,260,667
156.41% of 50 DAV
50 DAV is 806,000
|
$133.50
-0.90%
|
8/31/2017
|
$128.22
|
PP = $127.78
|
|
MB = $134.17
|
Most Recent Note - 9/11/2017 6:50:20 PM
Y - Posted another solid gain today with +56% above average volume and finished near the session high for a best-ever close. Rallying from a "double bottom" base with confirming gains triggering a technical buy signal. Highlighted in yellow in the 8/31/17 mid-day report with a new pivot point cited based on its 7/26/17 high. No resistance remains due to overhead supply.
>>> FEATURED STOCK ARTICLE : Rallied Near Pivot Point But Confirming Gains Are Still Needed - 8/31/2017 |
View all notes |
Set NEW NOTE alert |
Company Profile |
SEC
News |
Chart |
Request a new note
C
A
S
I |
Symbol/Exchange
Company Name
Industry Group |
PRICE |
CHANGE
(%Change) |
Day High |
Volume
(% DAV)
(% 50 day avg vol) |
52 Wk Hi
% From Hi |
Featured
Date |
Price
Featured |
Pivot Featured |
|
Max Buy |
VEEV
-
NYSE
Veeva Systems Inc Cl A
Computer Sftwr-Medical
|
$57.78
|
+0.82
1.44% |
$58.00
|
1,691,803
125.04% of 50 DAV
50 DAV is 1,353,000
|
$68.07
-15.12%
|
7/24/2017
|
$65.91
|
PP = $68.17
|
|
MB = $71.58
|
Most Recent Note - 9/8/2017 7:59:49 PM
G - A rebound above the 50 DMA line ($62.03) is still needed for its outlook to improve. Prior lows and the 200 DMA line define the next support to watch. Disciplined investors following the fact-based system limit losses by selling any stock that falls more than -7% below their purchase price.
>>> FEATURED STOCK ARTICLE : Rebounding After gap Down Violated 50-Day Average and Prior Lows - 9/1/2017 |
View all notes |
Set NEW NOTE alert |
Company Profile |
SEC
News |
Chart |
Request a new note
C
A
S
I |
ANET
-
NYSE
Arista Networks Inc
TELECOMMUNICATIONS - Communication Equipment
|
$175.31
|
+2.63
1.52% |
$176.10
|
391,766
49.03% of 50 DAV
50 DAV is 799,000
|
$179.71
-2.45%
|
8/4/2017
|
$173.31
|
PP = $163.07
|
|
MB = $171.22
|
Most Recent Note - 9/6/2017 5:18:45 PM
G - Perched near its all-time high, stubbornly holding its ground. Prior highs in the $162 area define initial support to watch above its 50 DMA line ($161). Fundamentals remain very strong.
>>> FEATURED STOCK ARTICLE : Gapped Up After Earnings Repairing 50-Day Moving Average Violation - 8/23/2017 |
View all notes |
Set NEW NOTE alert |
Company Profile |
SEC
News |
Chart |
Request a new note
C
A
S
I |
GRUB
-
NYSE
Grubhub Inc
COMPUTER SOFTWARE and SERVICES - Technical and System Software
|
$56.40
|
+0.32
0.57% |
$56.84
|
2,824,501
167.43% of 50 DAV
50 DAV is 1,687,000
|
$57.61
-2.10%
|
6/21/2017
|
$47.33
|
PP = $46.94
|
|
MB = $49.29
|
Most Recent Note - 9/11/2017 6:53:31 PM
G - Perched near its all-time high after posting a small gain today with above average volume. Its 50 DMA line ($50.46) defines near-term support above prior highs in the $46-47 area. Recently reported earnings +13% on +32% sales revenues for the Jun '17 quarter, below the +25% minimum earnings guideline (C criteria) raising fundamental concerns.
>>> FEATURED STOCK ARTICLE : Touched New High With Quiet Gain From Brief Consolidation - 9/7/2017 |
View all notes |
Set NEW NOTE alert |
Company Profile |
SEC
News |
Chart |
Request a new note
C
A
S
I |
IBP
-
NYSE
Installed Building Prod
DIVERSIFIED SERVICES - Business/Management Services
|
$57.45
|
-0.05
-0.09% |
$58.14
|
64,776
62.28% of 50 DAV
50 DAV is 104,000
|
$60.00
-4.25%
|
6/13/2017
|
$54.25
|
PP = $55.55
|
|
MB = $58.33
|
Most Recent Note - 9/5/2017 7:20:18 PM
Y - Down with higher volume today while falling toward its 50 DMA line ($54.45) and prior lows defining near-term support. More damaging losses would raise greater concerns.
>>> FEATURED STOCK ARTICLE : Consolidating Near Prior High Following Breakout - 8/18/2017 |
View all notes |
Set NEW NOTE alert |
Company Profile |
SEC
News |
Chart |
Request a new note
C
A
S
I |
NCOM
-
NASDAQ
National Commerce Corporation
BANKING - Regional - Southeast Banks
|
$39.75
|
+0.45
1.15% |
$40.25
|
34,189
13.62% of 50 DAV
50 DAV is 251,000
|
$41.25
-3.64%
|
4/25/2017
|
$38.95
|
PP = $40.09
|
|
MB = $42.09
|
Most Recent Note - 9/7/2017 1:29:56 PM
G - Consolidating in a tight range, but it has slumped below its 50 DMA line ($39.84) and its Relative Strength rating has slipped to 77, below the 80+ minimum guideline for buy candidates. Recently reported Jun '17 earnings +23% on +45% sales revenues, below the +25% minimum earnings guideline (C criteria), raising fundamental concerns.
>>> FEATURED STOCK ARTICLE : Consolidating Near 50-day Moving Average Line - 8/16/2017 |
View all notes |
Set NEW NOTE alert |
Company Profile |
SEC
News |
Chart |
Request a new note
C
A
S
I |
Symbol/Exchange
Company Name
Industry Group |
PRICE |
CHANGE
(%Change) |
Day High |
Volume
(% DAV)
(% 50 day avg vol) |
52 Wk Hi
% From Hi |
Featured
Date |
Price
Featured |
Pivot Featured |
|
Max Buy |
OLLI
-
NASDAQ
Ollie's Bargain Outlet
Retail-DiscountandVariety
|
$45.05
|
-0.15
-0.33% |
$45.50
|
572,864
97.76% of 50 DAV
50 DAV is 586,000
|
$46.08
-2.22%
|
9/8/2017
|
$45.20
|
PP = $46.18
|
|
MB = $48.49
|
Most Recent Note - 9/8/2017 7:49:40 PM
Y - Color code is changed to yellow with new pivot point cited based on its 8/01/17 high plus 10 cents. Recent gains above the 50 DMA line helped its outlook improve. Subsequent gains above the latest pivot point with at least the minimum +40% above average volume may trigger a proper new (or add-on) technical buy signal. Fundamentals remain strong. See the latest FSU analysis for more details and a new annotated graph.
>>> FEATURED STOCK ARTICLE : New Pivot Point Cited After Rebound From Below 50-Day Average - 9/8/2017 |
View all notes |
Set NEW NOTE alert |
Company Profile |
SEC
News |
Chart |
Request a new note
C
A
S
I |
HLI
-
NYSE
Houlihan Lokey Inc Cl A
Finance-Invest Bnk/Bkrs
|
$36.10
|
+0.26
0.73% |
$36.29
|
241,993
119.21% of 50 DAV
50 DAV is 203,000
|
$39.68
-9.02%
|
5/10/2017
|
$35.85
|
PP = $35.05
|
|
MB = $36.80
|
Most Recent Note - 9/5/2017 7:31:20 PM
G - Volume was higher behind today's loss while slumping back below its 50 DMA line ($36.09) and its color code is changed to green. Subsequent damaging losses below the recent low ($34.41 on 8/18/17) would raise more serious concerns and trigger a technical sell signal.
>>> FEATURED STOCK ARTICLE : Consolidating Near 50-Day Moving Average - 8/29/2017 |
View all notes |
Set NEW NOTE alert |
Company Profile |
SEC
News |
Chart |
Request a new note
C
A
S
I |
|
|
|
THESE ARE NOT BUY RECOMMENDATIONS!
Comments contained in the body of this report are technical
opinions only. The material herein has been obtained
from sources believed to be reliable and accurate, however,
its accuracy and completeness cannot be guaranteed.
This site is not an investment advisor, hence it does
not endorse or recommend any securities or other investments.
Any recommendation contained in this report may not
be suitable for all investors and it is not to be deemed
an offer or solicitation on our part with respect to
the purchase or sale of any securities. All trademarks,
service marks and trade names appearing in this report
are the property of their respective owners, and are
likewise used for identification purposes only.
This report is a service available
only to active Paid Premium Members.
You may opt-out of receiving report notifications
at any time. Questions or comments may be submitted
by writing to Premium Membership Services 665 S.E. 10 Street, Suite 201 Deerfield Beach, FL 33441-5634 or by calling 1-800-965-8307
or 954-785-1121.
|
|
|