You are not logged in.
This means you
CAN ONLY VIEW reports that were published prior to Thursday, March 20, 2025.
You
MUST UPGRADE YOUR MEMBERSHIP if you want to see any current reports.
AFTER MARKET UPDATE - THURSDAY, SEPTEMBER 7TH, 2017
Previous After Market Report Next After Market Report >>>
|
|
|
|
DOW |
-22.86 |
21,784.78 |
-0.10% |
|
Volume |
786,689,960 |
-3% |
|
Volume |
2,003,707,700 |
+7% |
|
NASDAQ |
+4.56 |
6,397.87 |
+0.07% |
|
Advancers |
1,502 |
52% |
|
Advancers |
1,278 |
49% |
|
S&P 500 |
-0.44 |
2,465.10 |
-0.02% |
|
Decliners |
1,394 |
48% |
|
Decliners |
1,350 |
51% |
|
Russell 2000 |
-3.52 |
1,398.67 |
-0.25% |
|
52 Wk Highs |
145 |
|
|
52 Wk Highs |
169 |
|
|
S&P 600 |
-2.53 |
837.41 |
-0.30% |
|
52 Wk Lows |
43 |
|
|
52 Wk Lows |
65 |
|
|
 |
Breadth Even as Indices Ended Mixed
Kenneth J. Gruneisen - Passed the CAN SLIM® Master's Exam
Stocks finished mixed on Thursday. The Dow was off 22 points to 21784, the S&P 500 finished down less than a point at 2465. The Nasdaq added 4 points to 6397. Volume totals reported were mixed, lighter than the prior session total on the NYSE and higher on the Nasdaq exchange. Breadth was fairly even as advancers led decliners by narrow margin on the NYSE, but decliners edged out advancers by a narrow margin on the Nasdaq exchange. There were 49 high-ranked companies from the Leaders List that made new 52-week highs and were listed on the BreakOuts Page, versus the total of 42 on the prior session. New 52-week highs totals expanded and solidly outnumbered new 52-week lows on the Nasdaq exchange and on the NYSE. The Featured Stocks Page provides the latest analysis on noteworthy high-ranked leaders. Charts used courtesy of www.stockcharts.com
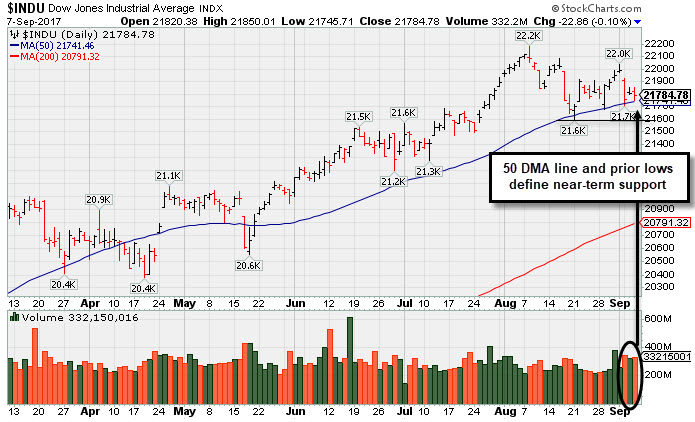 PICTURED: The Dow Jones Industrial Average is consolidating near its 50-day moving average (DMA) line. That important short-term average and recent lows define near-term support to watch.
The major averages' (M criteria) uptrend endured recent pressure however leadership has remained healthy. Investors should buy stocks meeting all key criteria of the fact-based investment system on a case-by-case basis as they trigger technical buy signals.
U.S. equities fluctuated while the dollar fell and Treasuries rallied as investors prepared for Hurricane Irma and gauged economic and central bank news. On the data front, initial jobless claims unexpectedly rose 62,000 to 298,000, the biggest increase since November 2012. The euro spiked 0.9% against the dollar to a three-year high as the European Central Banks left its quantitative easing program unchanged but raised its forward economic expectations.
Ten of 11 Sectors in the S&P were positive on the day. Technology shares outperformed while Financials once again lagged. In earnings news, RH (RH +44.67%) gapped up as the Restoration Hardware parent reported quarterly results above consensus and lifted its full-year outlook. Cabella’s Inc. (CAB +14.26%) after receiving regulatory approval to divest assets to their subsidiary Synovus Corp. Shares of AstraZeneca (AZN +5.11%) rose after announcing favorable trial results for its COPD treatment.
Treasuries were higher along the curve amid the influx of central bank news. 10-year notes finished up 16/32 to yield 2.05% and the 30-year bond jumped a point and 7/32 to yield 2.66%. In commodities, NYMEX WTI crude was down 0.2% to $49.06/barrel while COMEX gold gained over 1.0% to $1348.06/ounce. |
 Kenneth J. Gruneisen started out as a licensed stockbroker in August 1987, a couple of months prior to the historic stock market crash that took the Dow Jones Industrial Average down -22.6% in a single day. He has published daily fact-based fundamental and technical analysis on high-ranked stocks online for two decades. Through FACTBASEDINVESTING.COM, Kenneth provides educational articles, news, market commentary, and other information regarding proven investment systems that work in good times and bad.
Comments contained in the body of this report are technical opinions only and are not necessarily those of Gruneisen Growth Corp. The material herein has been obtained from sources believed to be reliable and accurate, however, its accuracy and completeness cannot be guaranteed. Our firm, employees, and customers may effect transactions, including transactions contrary to any recommendation herein, or have positions in the securities mentioned herein or options with respect thereto. Any recommendation contained in this report may not be suitable for all investors and it is not to be deemed an offer or solicitation on our part with respect to the purchase or sale of any securities. |
|
 |
Gold & Silver Index and Retail Index Rose; Financials Fell
Kenneth J. Gruneisen - Passed the CAN SLIM® Master's Exam
On Thursday the Broker/Dealer Index ($XBD -1.30%) and the Bank Index ($BKX -1.99%) both lost ground while the Retail Index ($RLX +0.56%) rose modestly. The tech sector was indecisive as the Semiconductor Index ($SOX +0.14%), Networking Index ($NWX -0.28%), and the Biotechnology Index ($BTK +0.08%) were little changed. The Gold & Silver Index ($XAU posted a solid gain while the Integrated Oil Index ($XOI +0.53%) also edged higher, but the Oil Services Index ($OSX -0.05%) finished flat. Charts courtesy www.stockcharts.com
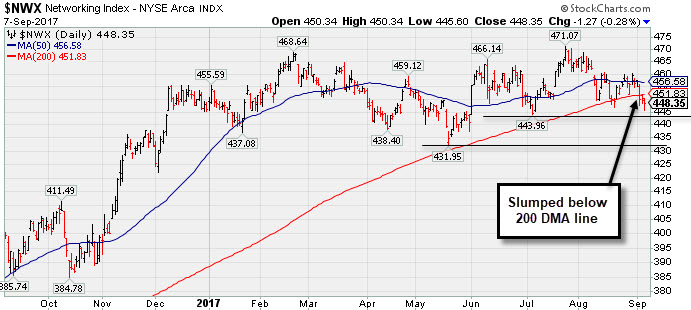 ) PICTURED: The Networking Index ($NWX -0.28%) has recently slumped below its 200-day moving average (DMA) line. It stayed above that long-term average during prior consolidations. Now prior lows define the next important near-term support levels to watch.
| Oil Services |
$OSX |
127.16 |
-0.06 |
-0.05% |
-30.81% |
| Integrated Oil |
$XOI |
1,136.62 |
+6.00 |
+0.53% |
-10.36% |
| Semiconductor |
$SOX |
1,107.34 |
+1.58 |
+0.14% |
+22.16% |
| Networking |
$NWX |
448.35 |
-1.27 |
-0.28% |
+0.51% |
| Broker/Dealer |
$XBD |
218.52 |
-2.88 |
-1.30% |
+6.45% |
| Retail |
$RLX |
1,502.70 |
+8.33 |
+0.56% |
+11.89% |
| Gold & Silver |
$XAU |
93.26 |
+1.91 |
+2.09% |
+18.26% |
| Bank |
$BKX |
89.71 |
-1.82 |
-1.99% |
-2.27% |
| Biotech |
$BTK |
4,217.86 |
+3.24 |
+0.08% |
+37.17% |
|
|
|
 |
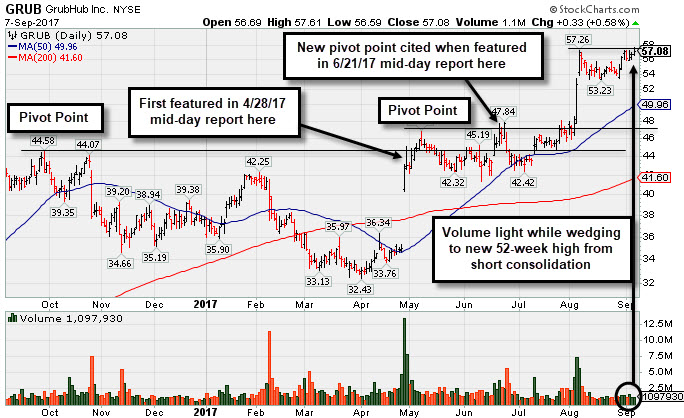
Touched New High With Quiet Gain From Brief Consolidation
Kenneth J. Gruneisen - Passed the CAN SLIM® Master's Exam
Grubhub Inc (GRUB +$0.33 or +0.58% to $57.08) inched to a new high with light volume. The latest consolidation was too short to be an ideal base. It stubbornly holding its ground near its all-time high. Its 50-day moving average (DMA) line ($49.96) defines near-term support above prior highs in the $46-47 area.
It recently reported earnings +13% on +32% sales revenues for the Jun '17 quarter, below the +25% minimum earnings guideline (C criteria) raising fundamental concerns. Only 2 of the past four quarterly earnings were above the +25% minimum guideline (C criteria). Its annual earnings (A criteria) history has been very strong since the high ranked Internet Content firm completed a new Public Offering on 9/03/14.
GRUB was last shown in this FSU section on 8/08/17 with an annotated graph under the headline, "Spiked Into New High Territory Despite Sub Par Earnings News" . It has traded up +30.2% since first highlighted in yellow with pivot point cited based on its 9/29/16 high plus 10 cents in the 4/28/17 mid-day report (read here).
The number of top-rated funds owning its shares rose from 318 in Jun '16 to 412 in Jun '17, a reassuring sign concerning the I criteria. The current Up/Down Volume Ratio of 1.4 is an unbiased indication its shares have been under accumulation over the past 50 days. It has a fairly small supply of only 83.8 million shares (S criteria) outstanding, which can contribute to greater price volatility in the event of institutional buying or selling.
|
|
|
Color Codes Explained :
Y - Better candidates highlighted by our
staff of experts.
G - Previously featured
in past reports as yellow but may no longer be buyable under the
guidelines.
***Last / Change / Volume data in this table is the closing quote data***
Symbol/Exchange
Company Name
Industry Group |
PRICE |
CHANGE
(%Change) |
Day High |
Volume
(% DAV)
(% 50 day avg vol) |
52 Wk Hi
% From Hi |
Featured
Date |
Price
Featured |
Pivot Featured |
|
Max Buy |
THO
-
NYSE
Thor Industries Inc
AUTOMOTIVE - Recreational Vehicles
|
$109.47
|
-1.64
-1.48% |
$111.51
|
480,107
91.40% of 50 DAV
50 DAV is 525,300
|
$115.74
-5.42%
|
8/14/2017
|
$106.67
|
PP = $110.01
|
|
MB = $115.51
|
Most Recent Note - 9/5/2017 7:13:55 PM
Y - Posted a gain backed by +77% above average volume and closed well above the previously cited pivot point triggering a technical buy signal. However, its current Relative Strength Rating of 77 is below the 80+ minimum guideline for buy candidates under the fact-based investment system. Very little resistance remains due to overhead supply up to its $115.74 all-time high.
>>> FEATURED STOCK ARTICLE : Slump Below 50-Day Average Hurt Technical Stance - 8/21/2017 |
View all notes |
Set NEW NOTE alert |
Company Profile |
SEC
News |
Chart |
Request a new note
C
A
S
I |
HSKA
-
NASDAQ
Heska Corporation
DRUGS - Biotechnology
|
$97.12
|
+0.15
0.15% |
$98.44
|
54,053
84.46% of 50 DAV
50 DAV is 64,000
|
$115.00
-15.55%
|
7/31/2017
|
$114.27
|
PP = $110.35
|
|
MB = $115.87
|
Most Recent Note - 9/5/2017 7:18:44 PM
G - Slumped back below its 50 DMA line ($100.73) closing near the session low today and its color code is changed to green. Recent lows in the $95 area define the next important support to watch
>>> FEATURED STOCK ARTICLE : Rally Above 50-Day Moving Average Line Improved Technical Stance - 8/30/2017 |
View all notes |
Set NEW NOTE alert |
Company Profile |
SEC
News |
Chart |
Request a new note
C
A
S
I |
AVGO
-
NASDAQ
Broadcom Limited
ELECTRONICS - Semiconductor - Broad Line
|
$246.55
|
-2.83
-1.13% |
$250.00
|
1,608,815
66.21% of 50 DAV
50 DAV is 2,430,000
|
$259.36
-4.94%
|
8/24/2017
|
$252.44
|
PP = $256.89
|
|
MB = $269.73
|
Most Recent Note - 9/5/2017 7:27:53 PM
Y - Color code is changed to yellow while consolidating near its 50 DMA line ($247) after enduring distributional pressure. Recent lows define the next important support in the $238-240 area. Subsequent violations would trigger more worrisome technical sell signals. Fundamentals remain strong. It has not produced volume-driven gains since highlighted in the 8/24/17 mid-day report - "Subsequent volume-driven gains above the pivot and for new highs may trigger a technical buy signal."
>>> FEATURED STOCK ARTICLE : Pullback Followed Latest Strong Earnings Report From Tech Leader - 8/25/2017 |
View all notes |
Set NEW NOTE alert |
Company Profile |
SEC
News |
Chart |
Request a new note
C
A
S
I |
EW
-
NYSE
Edwards Lifesciences Cp
HEALTH SERVICES - Medical Appliances and Equipment
|
$112.34
|
+0.11
0.10% |
$112.90
|
1,251,567
101.98% of 50 DAV
50 DAV is 1,227,300
|
$121.75
-7.73%
|
7/11/2017
|
$117.23
|
PP = $121.85
|
|
MB = $127.94
|
Most Recent Note - 9/6/2017 5:30:21 PM
G - Managed a "positive reversal" after slumping to new 16-week lows today, closing with a gain backed by above average volume.It is only -7.8% off its all-time high, but its Relative Strength Rating has slumped to 70, below the 80+ minimum guideline for buy candidates. A rebound above its downward sloping 50 DMA line ($115.64) is needed for its outlook to improve. Fundamentals remain strong.
>>> FEATURED STOCK ARTICLE : Positive Reversal After Slumping to New Lows - 9/6/2017 |
View all notes |
Set NEW NOTE alert |
Company Profile |
SEC
News |
Chart |
Request a new note
C
A
S
I |
STMP
-
NASDAQ
Stamps.com Inc
INTERNET - Internet Software and Services
|
$189.80
|
+1.50
0.80% |
$191.65
|
372,096
78.17% of 50 DAV
50 DAV is 476,000
|
$220.25
-13.83%
|
5/24/2017
|
$133.10
|
PP = $136.10
|
|
MB = $142.91
|
 Most Recent Note - 9/7/2017 1:31:53 PM
G - It has not formed a sound base of sufficient length. Its 50 DMA line ($175) defines near-term support above prior highs in the $156 area. Fundamentals remain strong.
>>> FEATURED STOCK ARTICLE : Blasted Higher After Latest Strong Earnings Report - 8/11/2017 |
View all notes |
Set NEW NOTE alert |
Company Profile |
SEC
News |
Chart |
Request a new note
C
A
S
I |
Symbol/Exchange
Company Name
Industry Group |
PRICE |
CHANGE
(%Change) |
Day High |
Volume
(% DAV)
(% 50 day avg vol) |
52 Wk Hi
% From Hi |
Featured
Date |
Price
Featured |
Pivot Featured |
|
Max Buy |
HTHT
-
NASDAQ
China Lodging Group Ads
LEISURE - Lodging
|
$114.74
|
+1.56
1.38% |
$115.82
|
415,671
133.23% of 50 DAV
50 DAV is 312,000
|
$118.00
-2.76%
|
9/29/2016
|
$46.12
|
PP = $47.82
|
|
MB = $50.21
|
Most Recent Note - 9/6/2017 5:24:40 PM
G - Perched near its all-time high, very extended from any sound base. Recently reported earnings +19% on +18% sales revenues for the Jun '17 quarter, below the +25% minimum earnings guideline (C criteria). Its 50 DMA line ($97.16) defines support above prior highs in the $88 area.
>>> FEATURED STOCK ARTICLE : Extended From Sound Base With Earnings News Due Next Week - 8/9/2017 |
View all notes |
Set NEW NOTE alert |
Company Profile |
SEC
News |
Chart |
Request a new note
C
A
S
I |
LMAT
-
NASDAQ
Lemaitre Vascular Inc
Medical-Products
|
$37.57
|
+0.68
1.84% |
$37.70
|
273,105
129.43% of 50 DAV
50 DAV is 211,000
|
$37.90
-0.87%
|
7/28/2017
|
$33.50
|
PP = $33.32
|
|
MB = $34.99
|
Most Recent Note - 9/5/2017 7:22:38 PM
G - Hit another new all-time high with today's gain backed by +50% above average volume, getting more extended from any sound base. Prior highs and the 50 DMA line define near-term support to watch in the $33 area.
>>> FEATURED STOCK ARTICLE : Volume-Driven Gain for New High And Strong Finish Bode Well - 8/28/2017 |
View all notes |
Set NEW NOTE alert |
Company Profile |
SEC
News |
Chart |
Request a new note
C
A
S
I |
BEAT
-
NASDAQ
BioTelemetry Inc
Medical-Services
|
$37.60
|
-0.20
-0.53% |
$37.90
|
262,513
64.28% of 50 DAV
50 DAV is 408,400
|
$38.25
-1.70%
|
2/14/2017
|
$25.10
|
PP = $24.55
|
|
MB = $25.78
|
Most Recent Note - 9/6/2017 5:20:10 PM
G - Posted a 5th consecutive small gain today on light volume. Fundamental concerns remain. Jun '17 quarterly earnings rose +10% on +10% sales revenues, its 2nd consecutive quarterly comparison below the +25% minimum earnings guideline (C criteria). Its 50 DMA line ($34.69) defines near-term support along with prior lows.
>>> FEATURED STOCK ARTICLE : Technically Strong Despite Recent Fundamental Concerns - 8/17/2017 |
View all notes |
Set NEW NOTE alert |
Company Profile |
SEC
News |
Chart |
Request a new note
C
A
S
I |
ESNT
-
NYSE
Essent Group Ltd
Finance-MrtgandRel Svc
|
$36.17
|
-0.77
-2.08% |
$36.97
|
1,015,405
158.63% of 50 DAV
50 DAV is 640,100
|
$41.44
-12.72%
|
7/3/2017
|
$38.05
|
PP = $39.60
|
|
MB = $41.58
|
Most Recent Note - 9/5/2017 7:15:27 PM
G - Slumped below its 50 DMA line ($38.38) hurting its outlook and its color code is changed to green. Completed a new Public Offering on 8/08/17. Prior lows ($36.71 on 8/11/17) and its 200 DMA line define near-term support in the $35-36 area. See the latest FSU analysis for more details and a new annotated graph.
>>> FEATURED STOCK ARTICLE : Undercut 50-Day Moving Average in Slump Toward Prior Lows - 9/5/2017 |
View all notes |
Set NEW NOTE alert |
Company Profile |
SEC
News |
Chart |
Request a new note
C
A
S
I |
OLED
-
NASDAQ
Universal Display Corp
Elec-Misc Products
|
$129.25
|
+0.30
0.23% |
$129.38
|
679,435
83.37% of 50 DAV
50 DAV is 815,000
|
$133.50
-3.18%
|
8/31/2017
|
$128.22
|
PP = $127.78
|
|
MB = $134.17
|
Most Recent Note - 9/6/2017 1:19:18 PM
Y - Erased most of its early gain today. Posted a big gain on 9/05/17 with +53% above average volume for a best-ever close, rallying from a "double bottom" base and triggering a technical buy signal. Highlighted in yellow in the 8/31/17 mid-day report with a new pivot point cited based on its 7/26/17 high. No resistance remains due to overhead supply. See the latest FSU analysis for additional gains and an annotated graph.
>>> FEATURED STOCK ARTICLE : Rallied Near Pivot Point But Confirming Gains Are Still Needed - 8/31/2017 |
View all notes |
Set NEW NOTE alert |
Company Profile |
SEC
News |
Chart |
Request a new note
C
A
S
I |
Symbol/Exchange
Company Name
Industry Group |
PRICE |
CHANGE
(%Change) |
Day High |
Volume
(% DAV)
(% 50 day avg vol) |
52 Wk Hi
% From Hi |
Featured
Date |
Price
Featured |
Pivot Featured |
|
Max Buy |
VEEV
-
NYSE
Veeva Systems Inc Cl A
Computer Sftwr-Medical
|
$57.86
|
-0.38
-0.65% |
$58.18
|
1,482,479
110.22% of 50 DAV
50 DAV is 1,345,000
|
$68.07
-15.00%
|
7/24/2017
|
$65.91
|
PP = $68.17
|
|
MB = $71.58
|
Most Recent Note - 9/1/2017 6:15:08 PM
G - Posted a 5th consecutive gain. Gapped down on 8/25/17 violating its 50 DMA line and undercutting prior lows triggering technical sell signals. A rebound above the 50 DMA line ($62.37) is needed for its outlook to improve. Fundamentals remain strong. See the latest FSU analysis for more details and a new annotated graph.
>>> FEATURED STOCK ARTICLE : Rebounding After gap Down Violated 50-Day Average and Prior Lows - 9/1/2017 |
View all notes |
Set NEW NOTE alert |
Company Profile |
SEC
News |
Chart |
Request a new note
C
A
S
I |
ANET
-
NYSE
Arista Networks Inc
TELECOMMUNICATIONS - Communication Equipment
|
$173.65
|
+0.92
0.53% |
$174.05
|
481,957
59.28% of 50 DAV
50 DAV is 813,000
|
$179.71
-3.37%
|
8/4/2017
|
$173.31
|
PP = $163.07
|
|
MB = $171.22
|
Most Recent Note - 9/6/2017 5:18:45 PM
G - Perched near its all-time high, stubbornly holding its ground. Prior highs in the $162 area define initial support to watch above its 50 DMA line ($161). Fundamentals remain very strong.
>>> FEATURED STOCK ARTICLE : Gapped Up After Earnings Repairing 50-Day Moving Average Violation - 8/23/2017 |
View all notes |
Set NEW NOTE alert |
Company Profile |
SEC
News |
Chart |
Request a new note
C
A
S
I |
GRUB
-
NYSE
Grubhub Inc
COMPUTER SOFTWARE and SERVICES - Technical and System Software
|
$57.08
|
+0.33
0.58% |
$57.61
|
1,097,930
63.28% of 50 DAV
50 DAV is 1,735,000
|
$57.29
-0.37%
|
6/21/2017
|
$47.33
|
PP = $46.94
|
|
MB = $49.29
|
Most Recent Note - 9/7/2017 9:14:36 PM
G - Touched a new all-time high with today's 3rd consecutive gain on light volume. Its 50 DMA line ($49.96) defines near-term support above prior highs in the $46-47 area. Recently reported earnings +13% on +32% sales revenues for the Jun '17 quarter, below the +25% minimum earnings guideline (C criteria) raising fundamental concerns. See the latest FSU analysis for more details and a new annotated graph.
>>> FEATURED STOCK ARTICLE : Touched New High With Quiet Gain From Brief Consolidation - 9/7/2017 |
View all notes |
Set NEW NOTE alert |
Company Profile |
SEC
News |
Chart |
Request a new note
C
A
S
I |
IBP
-
NYSE
Installed Building Prod
DIVERSIFIED SERVICES - Business/Management Services
|
$56.75
|
+0.05
0.09% |
$57.30
|
71,614
68.20% of 50 DAV
50 DAV is 105,000
|
$60.00
-5.42%
|
6/13/2017
|
$54.25
|
PP = $55.55
|
|
MB = $58.33
|
Most Recent Note - 9/5/2017 7:20:18 PM
Y - Down with higher volume today while falling toward its 50 DMA line ($54.45) and prior lows defining near-term support. More damaging losses would raise greater concerns.
>>> FEATURED STOCK ARTICLE : Consolidating Near Prior High Following Breakout - 8/18/2017 |
View all notes |
Set NEW NOTE alert |
Company Profile |
SEC
News |
Chart |
Request a new note
C
A
S
I |
NCOM
-
NASDAQ
National Commerce Corporation
BANKING - Regional - Southeast Banks
|
$38.85
|
-0.55
-1.40% |
$39.45
|
31,538
125.65% of 50 DAV
50 DAV is 25,100
|
$41.25
-5.82%
|
4/25/2017
|
$38.95
|
PP = $40.09
|
|
MB = $42.09
|
Most Recent Note - 9/7/2017 1:29:56 PM
G - Consolidating in a tight range, but it has slumped below its 50 DMA line ($39.84) and its Relative Strength rating has slipped to 77, below the 80+ minimum guideline for buy candidates. Recently reported Jun '17 earnings +23% on +45% sales revenues, below the +25% minimum earnings guideline (C criteria), raising fundamental concerns.
>>> FEATURED STOCK ARTICLE : Consolidating Near 50-day Moving Average Line - 8/16/2017 |
View all notes |
Set NEW NOTE alert |
Company Profile |
SEC
News |
Chart |
Request a new note
C
A
S
I |
Symbol/Exchange
Company Name
Industry Group |
PRICE |
CHANGE
(%Change) |
Day High |
Volume
(% DAV)
(% 50 day avg vol) |
52 Wk Hi
% From Hi |
Featured
Date |
Price
Featured |
Pivot Featured |
|
Max Buy |
OLLI
-
NASDAQ
Ollie's Bargain Outlet
Retail-DiscountandVariety
|
$44.15
|
+0.80
1.85% |
$44.15
|
359,491
60.22% of 50 DAV
50 DAV is 597,000
|
$46.08
-4.18%
|
7/17/2017
|
$43.96
|
PP = $44.18
|
|
MB = $46.39
|
Most Recent Note - 9/1/2017 6:17:33 PM
G - Quietly rebounded toward its 50 DMA line ($43.32) today, but it needs gains above that important short-term average for its outlook to improve. Reported earnings +29% on +21% sales revenues for the Jul '17 quarter, continuing its strong earnings track record. In recent weeks it failed to produce confirming gains above the latest pivot point backed by at least the minimum +40% above average volume necessary to trigger a proper new (or add-on) technical buy signal.
>>> FEATURED STOCK ARTICLE : Quietly Consolidating Above 50 Day Moving Average Near High - 8/10/2017 |
View all notes |
Set NEW NOTE alert |
Company Profile |
SEC
News |
Chart |
Request a new note
C
A
S
I |
HLI
-
NYSE
Houlihan Lokey Inc Cl A
Finance-Invest Bnk/Bkrs
|
$35.68
|
-0.01
-0.03% |
$35.69
|
296,948
150.74% of 50 DAV
50 DAV is 197,000
|
$39.68
-10.08%
|
5/10/2017
|
$35.85
|
PP = $35.05
|
|
MB = $36.80
|
Most Recent Note - 9/5/2017 7:31:20 PM
G - Volume was higher behind today's loss while slumping back below its 50 DMA line ($36.09) and its color code is changed to green. Subsequent damaging losses below the recent low ($34.41 on 8/18/17) would raise more serious concerns and trigger a technical sell signal.
>>> FEATURED STOCK ARTICLE : Consolidating Near 50-Day Moving Average - 8/29/2017 |
View all notes |
Set NEW NOTE alert |
Company Profile |
SEC
News |
Chart |
Request a new note
C
A
S
I |
|
|
|
THESE ARE NOT BUY RECOMMENDATIONS!
Comments contained in the body of this report are technical
opinions only. The material herein has been obtained
from sources believed to be reliable and accurate, however,
its accuracy and completeness cannot be guaranteed.
This site is not an investment advisor, hence it does
not endorse or recommend any securities or other investments.
Any recommendation contained in this report may not
be suitable for all investors and it is not to be deemed
an offer or solicitation on our part with respect to
the purchase or sale of any securities. All trademarks,
service marks and trade names appearing in this report
are the property of their respective owners, and are
likewise used for identification purposes only.
This report is a service available
only to active Paid Premium Members.
You may opt-out of receiving report notifications
at any time. Questions or comments may be submitted
by writing to Premium Membership Services 665 S.E. 10 Street, Suite 201 Deerfield Beach, FL 33441-5634 or by calling 1-800-965-8307
or 954-785-1121.
|
|
|