***Last / Change / Volume data in this table is the closing quote data***
Symbol/Exchange
Company Name
Industry Group |
PRICE |
CHANGE
(%Change) |
Day High |
Volume
(% DAV)
(% 50 day avg vol) |
52 Wk Hi
% From Hi |
Featured
Date |
Price
Featured |
Pivot Featured |
|
Max Buy |
 SIVB
-
NASDAQ
SIVB
-
NASDAQ
S V B Financial Group
BANKING - Regional - Pacific Banks
|
$587.63
|
-22.78
-3.73% |
$598.20
|
575,418
149.07% of 50 DAV
50 DAV is 386,000
|
$623.00
-5.68%
|
8/6/2021
|
$589.70
|
PP = $608.94
|
|
MB = $639.39
|
 Most Recent Note - 9/20/2021 1:08:33 PM
Y - Pulling back into the prior base with today's big loss negating the recent breakout. Its 50 DMA line ($572) defies important near-term support to watch. Completed a new Public Offering on 8/11/21.
>>> FEATURED STOCK ARTICLE : Consolidating Near Prior Highs Facing Little Resistance - 8/9/2021 |
View all notes |
Set NEW NOTE alert |
Company Profile |
SEC
News |
Chart |
Request a new note
C
A
S
I |
BLDR
-
NYSE
Builders Firstsource Inc
Bldg-Constr Prds/Misc
|
$52.02
|
-0.80
-1.51% |
$52.09
|
1,776,890
79.08% of 50 DAV
50 DAV is 2,247,000
|
$55.17
-5.71%
|
8/12/2021
|
$52.38
|
PP = $54.09
|
|
MB = $56.79
|
Most Recent Note - 9/14/2021 5:43:20 PM
Y - Pulled back today with light volume after hovering near its all-time high. Subsequent gains above the pivot point backed by at least +40% above average volume may clinch a proper technical buy signal. Fundamentals remain strong.
>>> FEATURED STOCK ARTICLE : Rebounding Near Prior High After Another Strong Quarter - 8/12/2021 |
View all notes |
Set NEW NOTE alert |
Company Profile |
SEC
News |
Chart |
Request a new note
C
A
S
I |
SNPS
-
NASDAQ
Synopsys Inc
COMPUTER SOFTWARE and SERVICES - Technical and System Software
|
$321.30
|
-4.24
-1.30% |
$324.00
|
877,797
131.92% of 50 DAV
50 DAV is 665,400
|
$340.66
-5.68%
|
8/18/2021
|
$293.22
|
PP = $301.01
|
|
MB = $316.06
|
Most Recent Note - 9/17/2021 1:09:34 PM
G - Gapped down today retreating from near its all-time high. Extended from the previously noted base, its 50 DMA line ($304) and prior high in the $300 area define important near-term support.
>>> FEATURED STOCK ARTICLE : Latest Earnings Report Missed the +25% Minimum Guideline - 8/18/2021 |
View all notes |
Set NEW NOTE alert |
Company Profile |
SEC
News |
Chart |
Request a new note
C
A
S
I |
CROX
-
NASDAQ
Crocs Inc
CONSUMER NON-DURABLES - Textile - Apparel Footwear
|
$151.72
|
-3.46
-2.23% |
$153.41
|
1,857,261
137.88% of 50 DAV
50 DAV is 1,347,000
|
$161.28
-5.93%
|
6/14/2021
|
$112.64
|
PP = $110.01
|
|
MB = $115.51
|
Most Recent Note - 9/16/2021 12:11:40 PM
G - Powering to new all-time highs with today's 3rd consecutive volume-driven gain. It did not form any recent base of sufficient length. Important near-term support to watch is its 50 DMA line ($136) and prior low ($132.60).
>>> FEATURED STOCK ARTICLE : Wedging Higher and Very Extended From Any Sound Base - 8/16/2021 |
View all notes |
Set NEW NOTE alert |
Company Profile |
SEC
News |
Chart |
Request a new note
C
A
S
I |
DECK
-
NYSE
Deckers Outdoor Corp
Apparel-Clothing Mfg
|
$425.94
|
-9.05
-2.08% |
$429.99
|
290,467
88.56% of 50 DAV
50 DAV is 328,000
|
$451.49
-5.66%
|
9/16/2021
|
$444.81
|
PP = $444.58
|
|
MB = $466.81
|
Most Recent Note - 9/16/2021 6:02:12 PM
Y - Color code was changed to yellow in the earlier mid-day report with pivot point cited based on its 8/05/21 high plus 10 cents. Touched a new all-time high today while adding to recent volume-driven gains as it rallied from support at its 50 DMA line ($415). Subsequent gains and a strong close above the pivot point backed by at least +40% above average volume may trigger a technical buy signal. Reported very strong Jun '21 quarterly earnings versus a loss on +78% sales revenues versus the year ago period. Prior quarterly earnings comparisons were above the +25% minimum guideline (C criteria). Annual earnings growth has been strong and steady. See the latest FSU analysis for more details and a new annotated graph.
>>> FEATURED STOCK ARTICLE : Touched New High But Closed Below Pivot Point - 9/16/2021 |
View all notes |
Set NEW NOTE alert |
Company Profile |
SEC
News |
Chart |
Request a new note
C
A
S
I |
Symbol/Exchange
Company Name
Industry Group |
PRICE |
CHANGE
(%Change) |
Day High |
Volume
(% DAV)
(% 50 day avg vol) |
52 Wk Hi
% From Hi |
Featured
Date |
Price
Featured |
Pivot Featured |
|
Max Buy |
KFRC
-
NASDAQ
Kforce Inc
Comml Svcs-Staffing
|
$59.25
|
-1.74
-2.85% |
$60.26
|
124,453
116.31% of 50 DAV
50 DAV is 107,000
|
$64.38
-7.97%
|
9/10/2021
|
$59.53
|
PP = $64.48
|
|
MB = $67.70
|
Most Recent Note - 9/20/2021 5:29:03 PM
G - Color code is changed to green as it slumped back below its 50 DMA line with today's loss. Highlighted in yellow with pivot point cited based on its 6/02/21 high plus 10 cents in the 9/10/21 mid-day report. Subsequent gains above its pivot point backed by at least +40% above average volume are needed to trigger a technical buy signal. Reported earnings +113% on +18% sales revenues for the Jun '21 quarter versus the year ago period, its 4th quarterly earnings increase above the +25% minimum earnings guideline (C criteria). Annual earnings (A criteria) growth has been steady.
>>> FEATURED STOCK ARTICLE : Staffing Firm Still Faces Some Overhead Supply - 9/13/2021 |
View all notes |
Set NEW NOTE alert |
Company Profile |
SEC
News |
Chart |
Request a new note
C
A
S
I |
CRL
-
NYSE
Charles River Labs Intl
DRUGS - Biotechnology
|
$433.05
|
-7.40
-1.68% |
$440.78
|
419,643
140.35% of 50 DAV
50 DAV is 299,000
|
$450.84
-3.95%
|
6/9/2021
|
$345.91
|
PP = $349.23
|
|
MB = $366.69
|
Most Recent Note - 9/14/2021 12:19:30 PM
G - Churning higher volume over the past week while remaining perched near its all-time high, extended from any sound base. Its 50 DMA line ($412) defines near-term support to watch on pullbacks. Fundamentals remain strong.
>>> FEATURED STOCK ARTICLE : Wedging Higher With Gains Lacking Volume Conviction - 8/24/2021 |
View all notes |
Set NEW NOTE alert |
Company Profile |
SEC
News |
Chart |
Request a new note
C
A
S
I |
REGN
-
NASDAQ
Regeneron Pharmaceutical
DRUGS - Biotechnology
|
$640.89
|
-10.99
-1.69% |
$652.00
|
548,006
74.76% of 50 DAV
50 DAV is 733,000
|
$686.62
-6.66%
|
8/20/2021
|
$669.82
|
PP = $664.74
|
|
MB = $697.98
|
Most Recent Note - 9/16/2021 2:38:44 PM
Y - Hovering within striking distance of its all-time high. Gains above a stock's pivot point must be backed by at least +40% above average volume to trigger a proper technical buy signal.
>>> FEATURED STOCK ARTICLE : Regeneron Featured Hitting a New High - 8/20/2021 |
View all notes |
Set NEW NOTE alert |
Company Profile |
SEC
News |
Chart |
Request a new note
C
A
S
I |
GNRC
-
NYSE
Generac Hldgs Inc
Electrical-Power/Equipmt
|
$421.17
|
-14.19
-3.26% |
$426.90
|
695,092
98.32% of 50 DAV
50 DAV is 707,000
|
$466.92
-9.80%
|
8/30/2021
|
$449.36
|
PP = $457.10
|
|
MB = $479.96
|
Most Recent Note - 9/20/2021 5:34:46 PM
G - Color code is changed to green after today's gap down and big loss violated its 50 DMA line ($428) raising concerns. Subsequent gains and a strong close above the pivot point backed by at least +40% above average volume may clinch a convincing new (or add-on) technical buy signal. Fundamentals remain strong.
>>> FEATURED STOCK ARTICLE : Rebound Above 50-Day Moving Average Helps Outlook - 8/23/2021 |
View all notes |
Set NEW NOTE alert |
Company Profile |
SEC
News |
Chart |
Request a new note
C
A
S
I |
CAMT
-
NASDAQ
Camtek Ltd
ELECTRONICS - Scientific and Technical Instrum
|
$41.10
|
-1.26
-2.97% |
$41.57
|
120,918
71.98% of 50 DAV
50 DAV is 168,000
|
$43.59
-5.71%
|
8/4/2021
|
$39.67
|
PP = $40.57
|
|
MB = $42.60
|
Most Recent Note - 9/14/2021 5:42:11 PM
Y - Posted a 4th consecutive gain today with above average volume hitting a new all-time high near its "max buy" level. Its 50 DMA line ($37.62) and prior low ($34.68 on 8/17/21) define important near-term support to watch. Fundamentals remain strong.
>>> FEATURED STOCK ARTICLE : Recent 50-Day Moving Average Violation Again Raised Concerns - 8/17/2021 |
View all notes |
Set NEW NOTE alert |
Company Profile |
SEC
News |
Chart |
Request a new note
C
A
S
I |
Symbol/Exchange
Company Name
Industry Group |
PRICE |
CHANGE
(%Change) |
Day High |
Volume
(% DAV)
(% 50 day avg vol) |
52 Wk Hi
% From Hi |
Featured
Date |
Price
Featured |
Pivot Featured |
|
Max Buy |
PKI
-
NYSE
Perkinelmer Inc
ELECTRONICS - Scientific and Technical Instrum
|
$183.94
|
-3.62
-1.93% |
$188.42
|
782,045
107.87% of 50 DAV
50 DAV is 725,000
|
$191.07
-3.73%
|
8/18/2021
|
$181.07
|
PP = $188.50
|
|
MB = $197.93
|
Most Recent Note - 9/17/2021 5:37:12 PM
Y - Stalled but holding its ground after recently wedging to new all-time highs. Following a noted "3-weeks tight" base its color code was changed to yellow with new pivot point cited based on its 8/05/21 high plus 10 cents. Its 50 DMA line ($177.61) defines important near-term support to watch. Fundamentals remain strong. See the latest FSU analysis for more details and a new annotated graph.
>>> FEATURED STOCK ARTICLE : Stalled But Holding Ground After Recent "3 Weeks Tight" - 9/17/2021 |
View all notes |
Set NEW NOTE alert |
Company Profile |
SEC
News |
Chart |
Request a new note
C
A
S
I |
TRMB
-
NASDAQ
Trimble Inc
ELECTRONICS - Scientific and Technical Instrum
|
$89.11
|
-1.48
-1.63% |
$89.53
|
1,522,120
145.80% of 50 DAV
50 DAV is 1,044,000
|
$96.49
-7.65%
|
8/5/2021
|
$88.83
|
PP = $84.97
|
|
MB = $89.22
|
Most Recent Note - 9/15/2021 3:57:33 PM
G - Remains perched near its all-time high, extended from the prior base. Its 50 DMA line ($88.13) defines near-term support above prior highs in the $84 area. Fundamentals remain strong.
>>> FEATURED STOCK ARTICLE : Finished Strong With Gain for New High Backed by Volume - 8/5/2021 |
View all notes |
Set NEW NOTE alert |
Company Profile |
SEC
News |
Chart |
Request a new note
C
A
S
I |
UMC
-
NYSE
United Microelectrnc Adr
ELECTRONICS - Semiconductor - Integrated Cir
|
$11.42
|
-0.31
-2.64% |
$11.52
|
7,556,113
98.07% of 50 DAV
50 DAV is 7,705,000
|
$12.62
-9.51%
|
8/5/2021
|
$11.62
|
PP = $11.38
|
|
MB = $11.95
|
Most Recent Note - 9/14/2021 5:34:04 PM
G - Quietly consolidating near its "max buy" level. Prior highs in the $11.25 area define initial support to watch above its 50 DMA line ($10.56).
>>> FEATURED STOCK ARTICLE : Taiwan-Based Semiconductor Firm's Breakout Highlighted This Week - 8/6/2021 |
View all notes |
Set NEW NOTE alert |
Company Profile |
SEC
News |
Chart |
Request a new note
C
A
S
I |
ASML
-
NASDAQ
A S M L Holding N.V. NY
ELECTRONICS - Semiconductor Equipment and Mate
|
$840.74
|
-19.11
-2.22% |
$845.49
|
1,110,706
161.67% of 50 DAV
50 DAV is 687,000
|
$895.93
-6.16%
|
5/25/2021
|
$669.59
|
PP = $675.75
|
|
MB = $709.54
|
Most Recent Note - 9/20/2021 12:33:52 PM
G - Pulling back today for a 3rd consecutive volume-driven loss, retreating from its all-time high following noted volume-driven gains. It is extended from any sound base and its 50 DMA line ($792) defines important near-term support to watch.
>>> FEATURED STOCK ARTICLE : Semi Equipment Firm Extended From Any Sound Base - 8/11/2021 |
View all notes |
Set NEW NOTE alert |
Company Profile |
SEC
News |
Chart |
Request a new note
C
A
S
I |
BRKS
-
NASDAQ
Brooks Automation
ELECTRONICS - Semiconductor Equipment and Mate
|
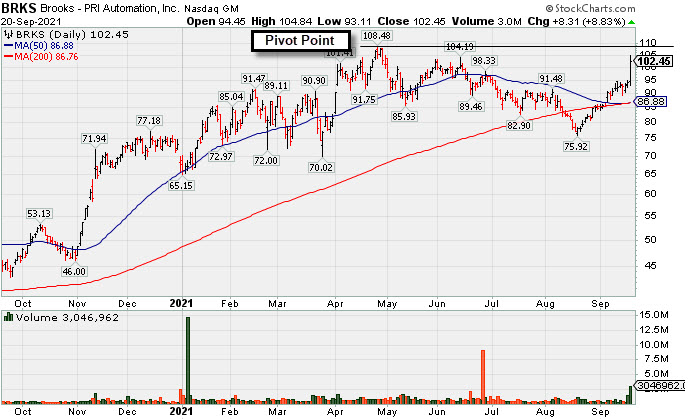
$102.45
|
+8.31
8.83% |
$104.84
|
2,996,945
565.46% of 50 DAV
50 DAV is 530,000
|
$108.72
-5.77%
|
9/20/2021
|
$101.21
|
PP = $108.82
|
|
MB = $114.26
|
Most Recent Note - 9/20/2021 5:25:12 PM
Y - Posted a big gain today and it was highlighted in yellow in the earlier mid-day report with pivot point cited based on its 4/27/21 high plus 10 cents. Subsequent gains above the pivot point backed by at least 40% above average volume may trigger a technical buy signal. Rallied toward its 52-week high with today's big volume-driven gain. See the latest FSU analysis for more details and a new annotated graph.
>>> FEATURED STOCK ARTICLE : Rallying Near High After Brief Consolidation Below 200 DMA Line - 9/20/2021 |
View all notes |
Set NEW NOTE alert |
Company Profile |
SEC
News |
Chart |
Request a new note
C
A
S
I |
Symbol/Exchange
Company Name
Industry Group |
PRICE |
CHANGE
(%Change) |
Day High |
Volume
(% DAV)
(% 50 day avg vol) |
52 Wk Hi
% From Hi |
Featured
Date |
Price
Featured |
Pivot Featured |
|
Max Buy |
ENTG
-
NASDAQ
Entegris Inc
ELECTRONICS - Semiconductor Equipment and Mate
|
$128.76
|
-3.29
-2.49% |
$130.47
|
906,150
144.75% of 50 DAV
50 DAV is 626,000
|
$133.30
-3.41%
|
8/4/2021
|
$125.33
|
PP = $126.51
|
|
MB = $132.84
|
Most Recent Note - 9/15/2021 12:35:50 PM
Y - Hitting another new high with today's 4th consecutive volume-driven gain. Volume was +96% above average on the prior session as it posted a solid gain triggering a technical buy signal. The 50 DMA line ($118.55) defines initial support to watch above recent lows in the $109 area.
>>> FEATURED STOCK ARTICLE : Perched Near High After 6th Consecutive Gain - 8/4/2021 |
View all notes |
Set NEW NOTE alert |
Company Profile |
SEC
News |
Chart |
Request a new note
C
A
S
I |
AMRC
-
NYSE
Ameresco Inc Cl A
ENERGY - Alternative
|
$63.07
|
-3.42
-5.14% |
$65.42
|
433,931
167.54% of 50 DAV
50 DAV is 259,000
|
$75.88
-16.88%
|
9/2/2021
|
$70.97
|
PP = $70.33
|
|
MB = $73.85
|
Most Recent Note - 9/20/2021 5:32:24 PM
G - Color code is changed to green after today's volume-driven loss decisively violated its 50 DMA line ($66.80) raising concerns.
>>> FEATURED STOCK ARTICLE : Volume +55% Above Average Behind Gain for a New High - 9/2/2021 |
View all notes |
Set NEW NOTE alert |
Company Profile |
SEC
News |
Chart |
Request a new note
C
A
S
I |
CPRT
-
NASDAQ
Copart Inc
SPECIALTY RETAIL - Auto Dealerships
|
$141.15
|
-2.80
-1.95% |
$142.10
|
1,190,813
126.68% of 50 DAV
50 DAV is 940,000
|
$152.75
-7.59%
|
9/15/2021
|
$146.44
|
PP = $149.17
|
|
MB = $156.63
|
Most Recent Note - 9/17/2021 5:40:27 PM
Y - Suffered a big volume-driven loss today raising concerns while completely negating the two prior volume-driven gains for new highs. Testing support near its 50 DMA line ($143.52). Reported earnings +51% on +42% sales revenues for the Jul '21 quarter versus the year ago period, its 3rd consecutive quarterly comparison above the +25% minimum guideline. Sequential comparisons show impressive acceleration in its sales revenues growth rate. See the latest FSU analysis for more details and an annotated graph.
>>> FEATURED STOCK ARTICLE : Volume-Driven Gain Challenging High - 9/15/2021 |
View all notes |
Set NEW NOTE alert |
Company Profile |
SEC
News |
Chart |
Request a new note
C
A
S
I |
CLFD
-
NASDAQ
Clearfield Inc
TELECOMMUNICATIONS - Cables / Satalite Equipment
|
$43.42
|
-0.57
-1.30% |
$43.65
|
85,133
90.57% of 50 DAV
50 DAV is 94,000
|
$46.93
-7.48%
|
7/23/2021
|
$40.23
|
PP = $43.74
|
|
MB = $45.93
|
Most Recent Note - 9/14/2021 5:29:52 PM
Y - Still quietly consolidating below its "max buy" level. Its 50 DMA line ($41.61) defines important near-term support to watch on pullbacks. Fundamentals remain strong. See the latest FSU analysis for more details and a new annotated graph.
>>> FEATURED STOCK ARTICLE : Quietly Consolidating Near All-Time High - 9/14/2021 |
View all notes |
Set NEW NOTE alert |
Company Profile |
SEC
News |
Chart |
Request a new note
C
A
S
I |
POOL
-
NASDAQ
Pool Corp
WHOLESALE - Basic Materials Wholesale
|
$462.52
|
-1.52
-0.33% |
$465.35
|
182,587
81.88% of 50 DAV
50 DAV is 223,000
|
$500.85
-7.65%
|
8/19/2021
|
$484.37
|
PP = $495.32
|
|
MB = $520.09
|
Most Recent Note - 9/20/2021 5:37:00 PM
G - Color code is changed to green after slumping well below its 50 DMA line ($478) with recent damaging losses raising concerns. After forming an advanced "3-weeks tight" base, it did not yet produce the subsequent gains above the pivot point backed by at least +40% above average volume needed to clinch a proper new (or add-on) technical buy signal.
>>> FEATURED STOCK ARTICLE : Touched New High With a Gain on Light Volume - 9/8/2021 |
View all notes |
Set NEW NOTE alert |
Company Profile |
SEC
News |
Chart |
Request a new note
C
A
S
I |
Symbol/Exchange
Company Name
Industry Group |
PRICE |
CHANGE
(%Change) |
Day High |
Volume
(% DAV)
(% 50 day avg vol) |
52 Wk Hi
% From Hi |
Featured
Date |
Price
Featured |
Pivot Featured |
|
Max Buy |
SMPL
-
NASDAQ
Simply Good Foods Co
Food-Confectionery
|
$34.27
|
-0.34
-0.98% |
$34.74
|
276,387
78.03% of 50 DAV
50 DAV is 354,200
|
$38.50
-10.99%
|
12/28/2020
|
$30.40
|
PP = $31.44
|
|
MB = $33.01
|
Most Recent Note - 9/16/2021 2:41:00 PM
G - Still sputtering and a rebound above the 50 DMA line ($36.03) is needed for its outlook to improve. Recent low ($33.91 on 8/19/21) defines important support where more damaging losses would raise greater concerns. Fundamentals remain strong.
>>> FEATURED STOCK ARTICLE : Still Lingering Below 50-Day Moving Average Line - 8/30/2021 |
View all notes |
Set NEW NOTE alert |
Company Profile |
SEC
News |
Chart |
Request a new note
C
A
S
I |
WDAY
-
NYSE
Workday Inc Cl A
Computer Sftwr-Enterprse
|
$267.19
|
-1.32
-0.49% |
$267.47
|
2,039,127
129.08% of 50 DAV
50 DAV is 1,579,800
|
$282.77
-5.51%
|
9/7/2021
|
$275.69
|
PP = $282.87
|
|
MB = $297.01
|
Most Recent Note - 9/14/2021 5:35:55 PM
Y - Consolidating in a tight range near its high with volume totals below average since highlighted in yellow with pivot point cited based on its 2/16/21 high plus 10 cents in the 9/07/21 mid-day report. It is perched within striking distance of its 52-week high after a big gap up 8/27/21 and additional volume-driven gains. Subsequent gains above the pivot point backed by at least +40% above average volume may trigger a technical buy signal. Reported Jul '21 quarterly earnings +46% on +19% sales revenues versus the year ago period, its 5th consecutive quarterly comparison well above the +25% minimum guideline (C criteria).
>>> FEATURED STOCK ARTICLE : Gap Up and Recent Gains Challenge All-Time High - 9/7/2021 |
View all notes |
Set NEW NOTE alert |
Company Profile |
SEC
News |
Chart |
Request a new note
C
A
S
I |
CTLT
-
NYSE
Catalent Inc
DRUGS - Biotechnology
|
$135.98
|
-0.17
-0.12% |
$136.28
|
1,590,582
194.69% of 50 DAV
50 DAV is 817,000
|
$142.64
-4.67%
|
8/25/2021
|
$128.72
|
PP = $127.78
|
|
MB = $134.17
|
Most Recent Note - 9/16/2021 2:57:09 PM
G - Hovering near its all-time high, extended from the previously noted base. Prior highs in the $124-127 area define initial support to watch above its 50 DMA line ($123.55). Fundamentals remain strong.
>>> FEATURED STOCK ARTICLE : Strong Gain Triggered Technical Buy Signal - 8/25/2021 |
View all notes |
Set NEW NOTE alert |
Company Profile |
SEC
News |
Chart |
Request a new note
C
A
S
I |
SQ
-
NYSE
Square Inc Cl A
Finance-CrdtCard/PmtPr
|
$250.23
|
-5.56
-2.17% |
$251.72
|
5,813,615
76.28% of 50 DAV
50 DAV is 7,621,000
|
$289.23
-13.48%
|
8/2/2021
|
$273.78
|
PP = $283.29
|
|
MB = $297.45
|
Most Recent Note - 9/15/2021 3:56:21 PM
G - Halted its slide at its 200 DMA line ($237) after damaging volume-driven losses violated its 50 DMA line ($258) raising concerns and triggering a technical sell signal. Only a prompt rebound above the 50 DMA line would help its outlook improve. Fundamentals remain strong.
>>> FEATURED STOCK ARTICLE : Pullback Following Big Gain on Strong Earnings and M&A News - 8/3/2021 |
View all notes |
Set NEW NOTE alert |
Company Profile |
SEC
News |
Chart |
Request a new note
C
A
S
I |
BLD
-
NYSE
Topbuild Corp
Bldg-Constr Prds/Misc
|
$218.71
|
-6.73
-2.99% |
$222.57
|
198,734
73.61% of 50 DAV
50 DAV is 270,000
|
$235.50
-7.13%
|
9/9/2021
|
$227.02
|
PP = $229.89
|
|
MB = $241.38
|
Most Recent Note - 9/20/2021 5:38:35 PM
Y - Pulled back today with light volume. Still perched within striking distance of its 52-week high. Highlighted in yellow in the 9/09/21 mid-day report with pivot point cited based on its 8/12 /21 high after a cup-with-handle base. A gain and strong close above the pivot point backed by at least +40% above average volume may trigger a technical buy signal. Little resistance remains while rallying near its all-time high. Fundamentals are strong.
>>> FEATURED STOCK ARTICLE : Close in Lower Half of Range Indicates Distributional Pressure - 9/9/2021 |
View all notes |
Set NEW NOTE alert |
Company Profile |
SEC
News |
Chart |
Request a new note
C
A
S
I |
Symbol/Exchange
Company Name
Industry Group |
PRICE |
CHANGE
(%Change) |
Day High |
Volume
(% DAV)
(% 50 day avg vol) |
52 Wk Hi
% From Hi |
Featured
Date |
Price
Featured |
Pivot Featured |
|
Max Buy |
SHOP
-
NYSE
Shopify Inc Cl A
Computer Sftwr-Enterprse
|
$1,434.53
|
-51.76
-3.48% |
$1,464.80
|
1,258,915
122.22% of 50 DAV
50 DAV is 1,030,000
|
$1,650.00
-13.06%
|
7/2/2021
|
$1,468.00
|
PP = $1,552.23
|
|
MB = $1,629.84
|
Most Recent Note - 9/15/2021 3:52:59 PM
G - Volume totals have been cooling. A rebound above its 50 DMA line ($1,514) is needed for its outlook to improve. Undercut the prior low ($1437.50 on 8/20/21) raising greater concerns. Fundamentals remain strong.
>>> FEATURED STOCK ARTICLE : Volume Cools While Consolidating Above 50-Day Moving Average - 8/31/2021 |
View all notes |
Set NEW NOTE alert |
Company Profile |
SEC
News |
Chart |
Request a new note
C
A
S
I |
MEDP
-
NASDAQ
Medpace Holdings Inc
Medical-Research Eqp/Svc
|
$182.55
|
-3.47
-1.87% |
$185.73
|
131,037
76.63% of 50 DAV
50 DAV is 171,000
|
$198.03
-7.82%
|
9/10/2021
|
$196.32
|
PP = $196.22
|
|
MB = $206.03
|
Most Recent Note - 9/16/2021 2:47:13 PM
Y - Finding prompt support near its 50 DMA line ($181.25) with today's gain following 4 consecutive losses. More damaging losses would raise greater concerns. Highlighted in yellow with pivot point cited based on its 4/26/21 high plus 10 cents in the 9/10/21 mid-day report. Subsequent gains and strong close above the pivot point backed by at least +40% above average volume may trigger a technical buy signal.
>>> FEATURED STOCK ARTICLE : Negative Reversal Indicative of Distributional Pressure - 9/10/2021 |
View all notes |
Set NEW NOTE alert |
Company Profile |
SEC
News |
Chart |
Request a new note
C
A
S
I |
YETI
-
NYSE
Yeti Holdings Inc
Leisure-Products
|
$96.26
|
-2.77
-2.80% |
$98.06
|
707,581
96.80% of 50 DAV
50 DAV is 731,000
|
$105.62
-8.86%
|
5/13/2021
|
$84.20
|
PP = $90.65
|
|
MB = $95.18
|
Most Recent Note - 9/14/2021 5:37:02 PM
G - Consolidating above its 50 DMA line ($97.33) which defines near-term support to watch above the recent low ($94.15). There was a noted "negative reversal" after hitting a new all-time high on 8/06/21. Fundamentals remain strong.
>>> FEATURED STOCK ARTICLE : Important Test of 50-Day Moving Average Line - 8/19/2021 |
View all notes |
Set NEW NOTE alert |
Company Profile |
SEC
News |
Chart |
Request a new note
C
A
S
I |
DOCU
-
NASDAQ
Docusign Inc
Computer Sftwr-Enterprse
|
$271.29
|
-6.45
-2.32% |
$276.10
|
2,584,597
116.89% of 50 DAV
50 DAV is 2,211,100
|
$314.76
-13.81%
|
7/6/2021
|
$288.96
|
PP = $290.33
|
|
MB = $304.85
|
Most Recent Note - 9/14/2021 12:28:34 PM
G - Slumped well below its 50 DMA line ($293) and violated the prior low ($281,28) with damaging losses triggering technical sell signals. Only a prompt rebound above the 50 DMA line would help its outlook improve. Reported Jul '21 quarterly earnings +176% on +50% sales revenues versus the year ago period.
>>> FEATURED STOCK ARTICLE : Reversed From High After Recently Wedging Higher Without Volume - 8/13/2021 |
View all notes |
Set NEW NOTE alert |
Company Profile |
SEC
News |
Chart |
Request a new note
C
A
S
I |
JEF
-
NYSE
Jefferies Financial Grp
Finance-Invest Bnk/Bkrs
|
$35.90
|
-0.64
-1.75% |
$35.95
|
2,584,502
157.78% of 50 DAV
50 DAV is 1,638,000
|
$37.85
-5.15%
|
6/28/2021
|
$31.81
|
PP = $34.42
|
|
MB = $36.14
|
Most Recent Note - 9/16/2021 3:02:08 PM
G - Still stubbornly holding its ground in a tight range near its all-time high. Prior highs in the $34-35 range define initial support to watch above its 50 DMA line ($34.75).
>>> FEATURED STOCK ARTICLE : Quiet Gains for New High Closes - 8/10/2021 |
View all notes |
Set NEW NOTE alert |
Company Profile |
SEC
News |
Chart |
Request a new note
C
A
S
I |
Symbol/Exchange
Company Name
Industry Group |
PRICE |
CHANGE
(%Change) |
Day High |
Volume
(% DAV)
(% 50 day avg vol) |
52 Wk Hi
% From Hi |
Featured
Date |
Price
Featured |
Pivot Featured |
|
Max Buy |
DBX
-
NASDAQ
Dropbox Inc Cl A
Computer Sftwr-Database
|
$30.11
|
-0.59
-1.92% |
$30.43
|
3,725,302
98.89% of 50 DAV
50 DAV is 3,767,000
|
$33.00
-8.76%
|
9/3/2021
|
$32.45
|
PP = $33.00
|
|
MB = $34.65
|
Most Recent Note - 9/16/2021 3:00:26 PM
G - Color code is changed to green while quietly sputtering just below its 50 DMA line ($31.22). More damaging losses below the prior low ($30.02) would raise greater concerns. Highlighted in yellow in the 9/03/21 mid-day report while noted - "A valid "secondary buy point" exists up to +5% above the latest high, as it found support at the 10 WMA following an earlier breakout."
>>> FEATURED STOCK ARTICLE : Volume Higher on 6th Consecutive Gain for Dropbox - 9/3/2021 |
View all notes |
Set NEW NOTE alert |
Company Profile |
SEC
News |
Chart |
Request a new note
C
A
S
I |
CLAR
-
NASDAQ
Clarus Corporation
Leisure-Products
|
$26.68
|
-0.68
-2.49% |
$27.38
|
153,776
97.95% of 50 DAV
50 DAV is 157,000
|
$32.36
-17.55%
|
5/12/2021
|
$21.40
|
PP = $19.73
|
|
MB = $20.72
|
Most Recent Note - 9/15/2021 3:50:36 PM
G - Volume totals have been cooling while still sputtering below its 50 DMA line ($27.80). A rebound above the 50 DMA line is needed for its outlook to improve. Fundamentals remain strong.
>>> FEATURED STOCK ARTICLE : Fundamentals Strong and Finding Support at 50-Day Moving Average - 9/1/2021 |
View all notes |
Set NEW NOTE alert |
Company Profile |
SEC
News |
Chart |
Request a new note
C
A
S
I |
AVTR
-
NYSE
Avantor Inc
Medical-Research Eqp/Svc
|
$42.52
|
-0.29
-0.68% |
$42.65
|
4,599,436
131.34% of 50 DAV
50 DAV is 3,502,000
|
$43.77
-2.86%
|
6/10/2021
|
$32.94
|
PP = $34.09
|
|
MB = $35.79
|
Most Recent Note - 9/14/2021 12:11:13 PM
G - Proposed a Secondary Offering while perched at its all-time high, very extended from any sound base. Its 50 DMA line ($38.41) defines near-term support to watch on pullbacks.
>>> FEATURED STOCK ARTICLE : Steady Progress Made Since Featured - 8/27/2021 |
View all notes |
Set NEW NOTE alert |
Company Profile |
SEC
News |
Chart |
Request a new note
C
A
S
I |
MIME
-
NASDAQ
Mimecast Limited
Computer Sftwr-Security
|
$66.02
|
-1.39
-2.06% |
$67.13
|
557,770
54.42% of 50 DAV
50 DAV is 1,025,000
|
$71.45
-7.60%
|
8/2/2021
|
$56.12
|
PP = $59.58
|
|
MB = $62.56
|
Most Recent Note - 9/17/2021 5:43:15 PM
G - Pulled back from its all-time high with today's volume-driven loss. Disciplined investors avoid buying stocks more than +5% above their pivot point or prior high. Its 50 DMA line ($61) and prior highs in the $59 area define initial support to watch on pullbacks. Fundamentals remain strong.
>>> FEATURED STOCK ARTICLE : Perched Not Far From High With Earnings News Due Pre-Open - 8/2/2021 |
View all notes |
Set NEW NOTE alert |
Company Profile |
SEC
News |
Chart |
Request a new note
C
A
S
I |