You are not logged in.
This means you
CAN ONLY VIEW reports that were published prior to Sunday, April 20, 2025.
You
MUST UPGRADE YOUR MEMBERSHIP if you want to see any current reports.
AFTER MARKET UPDATE - MONDAY, AUGUST 21ST, 2017
Previous After Market Report Next After Market Report >>>
|
|
|
|
DOW |
+29.24 |
21,703.75 |
+0.13% |
|
Volume |
713,466,780 |
-23% |
|
Volume |
1,561,105,991 |
-21% |
|
NASDAQ |
-3.40 |
6,213.13 |
-0.05% |
|
Advancers |
1,452 |
50% |
|
Advancers |
1,205 |
43% |
|
S&P 500 |
+2.82 |
2,428.37 |
+0.12% |
|
Decliners |
1,445 |
50% |
|
Decliners |
1,601 |
57% |
|
Russell 2000 |
-0.89 |
1,356.90 |
-0.07% |
|
52 Wk Highs |
49 |
|
|
52 Wk Highs |
33 |
|
|
S&P 600 |
-1.13 |
817.25 |
-0.14% |
|
52 Wk Lows |
144 |
|
|
52 Wk Lows |
109 |
|
|
 |
Leadership Remains Thin After Major Indices' Stumble
Kenneth J. Gruneisen - Passed the CAN SLIM® Master's Exam
Stocks finished mixed on Monday. The Dow added 29 points to 21703. The S&P 500 gained 2 points to 2428 and the Nasdaq Composite lost 3 points to 6213, both remaining below their respective 50-day moving average (DMA) lines. Volume totals reported were lighter than the prior session totals on the NYSE and on the Nasdaq exchange. Breadth was even on the NYSE while decliners led advancers by a 4-3 margin on the Nasdaq exchange. There were 19 high-ranked companies from the Leaders List that made new 52-week highs and were listed on the BreakOuts Page, versus the total of 11 on the prior session. New 52-week lows totals again solidly outnumbered new 52-week highs totals on both the NYSE and the Nasdaq exchange. The Featured Stocks Page provides the latest analysis on noteworthy high-ranked leaders. Charts used courtesy of www.stockcharts.com
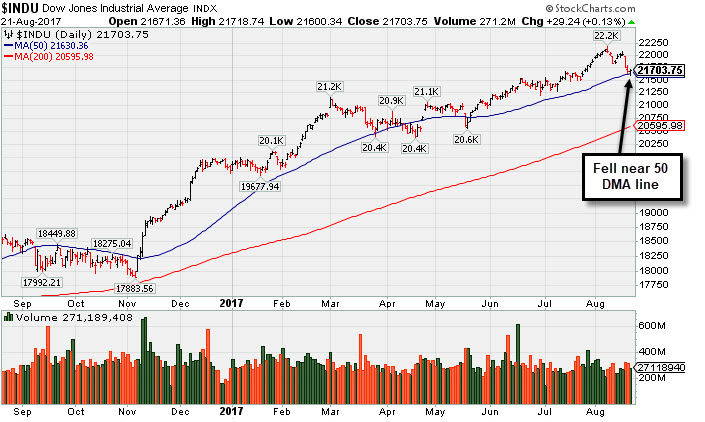 PICTURED: The Dow Jones Industrial Average is testing support at its 50-day moving average (DMA) line. The major averages' (M criteria) prior uptrend is under pressure while leadership has been thinning. Investors should be ready to raise cash and reduce exposure to stocks by selling individual issues on a case-by-case basis as they trigger technical sell signals.
The major averages fluctuated on light volume amid a slow day for market news. Later in the week, the Kansas City Fed kicks off its annual summit in Jackson Hole, Wyoming which will feature speeches from key central bankers from around the globe. On the data front, the Chicago Fed’s National Activity Index unexpectedly turned negative in July. In M&A news, Sempra Energy (SRE +1.59%) rose after announcing a deal to buy power transmission company Oncor for $9.45 billion in cash.
Eight out of 11 sectors in the S&P 500 finished in positive territory. Real Estate and Consumer Staples outperformed while Energy and Technology shares lagged. The semiconductor group weighed down the tech space with Advanced Micro Devices (AMD -2.59%) and NVidia (NVDA -1.46%) both losing ground. Nike (NKE -2.44%) slumped and Finish Line (FINL-10.17%) fell harder amid a flurry of analyst downgrades in the athletic apparel space. Fiat Chrysler (FCAU +6.9%) rose following news that China’s Great Wall Motors may be interested in acquiring the company’s Jeep brand.
Treasuries were higher with the benchmark 10-year note up 2/32 to yield 2.18%. In commodities, NYMEX WTI crude lost 2.2% at $47.46/barrel. COMEX gold gained another 0.4% to $1290.80/ounce. |
 Kenneth J. Gruneisen started out as a licensed stockbroker in August 1987, a couple of months prior to the historic stock market crash that took the Dow Jones Industrial Average down -22.6% in a single day. He has published daily fact-based fundamental and technical analysis on high-ranked stocks online for two decades. Through FACTBASEDINVESTING.COM, Kenneth provides educational articles, news, market commentary, and other information regarding proven investment systems that work in good times and bad.
Comments contained in the body of this report are technical opinions only and are not necessarily those of Gruneisen Growth Corp. The material herein has been obtained from sources believed to be reliable and accurate, however, its accuracy and completeness cannot be guaranteed. Our firm, employees, and customers may effect transactions, including transactions contrary to any recommendation herein, or have positions in the securities mentioned herein or options with respect thereto. Any recommendation contained in this report may not be suitable for all investors and it is not to be deemed an offer or solicitation on our part with respect to the purchase or sale of any securities. |
|
 |
Gold & Silver Index and Biotech Indexes Led Group Gainers
Kenneth J. Gruneisen - Passed the CAN SLIM® Master's Exam
On Monday the Bank Index ($BKX -0.41%) and the Broker/Dealer Index ($XBD -0.32%) weighed on the major indices as they both finished lower, meanwhile the Retail Index ($RLX +0.09%) held its ground. The tech sector was mixed as the Semiconductor Index ($SOX -0.69%) was lower. The Networking Index ($NWX -0.12%) finished flat and the Biotechnology Index ($BTK +0.45%) posted a modest gain. The Gold & Silver Index ($XAU +1.79%) was a standout gainer, meanwhile the Oil Services Index ($OSX -1.10%) and the Integrated Oil Index ($XOI -0.43%) both posted losses. Charts courtesy www.stockcharts.com
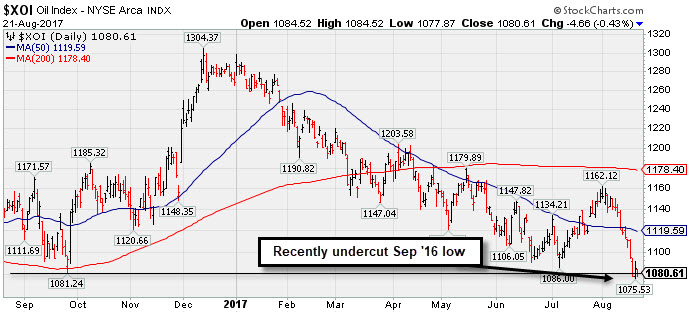 PICTURED: The Integrated Oil Index ($XOI -0.43%) recently undercut its September 2016 low.
| Oil Services |
$OSX |
118.11 |
-1.31 |
-1.10% |
-35.74% |
| Integrated Oil |
$XOI |
1,080.61 |
-4.66 |
-0.43% |
-14.78% |
| Semiconductor |
$SOX |
1,064.52 |
-7.37 |
-0.69% |
+17.44% |
| Networking |
$NWX |
449.21 |
-0.55 |
-0.12% |
+0.70% |
| Broker/Dealer |
$XBD |
223.69 |
-0.73 |
-0.32% |
+8.97% |
| Retail |
$RLX |
1,446.69 |
+1.34 |
+0.09% |
+7.72% |
| Gold & Silver |
$XAU |
85.41 |
+1.51 |
+1.80% |
+8.31% |
| Bank |
$BKX |
92.85 |
-0.39 |
-0.42% |
+1.15% |
| Biotech |
$BTK |
3,804.07 |
+16.89 |
+0.45% |
+23.71% |
|
|
|
 |
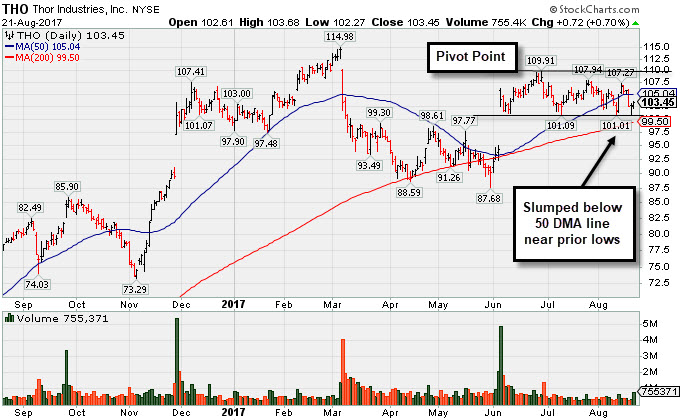
Slump Below 50-Day Average Hurt Technical Stance
Kenneth J. Gruneisen - Passed the CAN SLIM® Master's Exam
Thor Industries Inc (THO +$0.72 or +0.70%to $103.45) has been recently slumping below its 50-day moving average (DMA) line ($105.09) near prior lows. A rebound above the 50 DMA line is needed for its outlook to improve. Subsequent volume-driven gains above the pivot point may trigger a new (or add-on) technical buy signal. Without fresh proof of new institutional buying demand investors should be patient. It faces additional resistance due to overhead supply up through the $115 level. Any volume-driven gains into new all-time high territory might signal the beginning of a significant new leg up in price.
The Building - Mobile/Mfg & RV firm was highlighted in yellow with pivot point cited based on its 4/27/17 high in the 6/07/17 mid-day report (read here). It had gapped up on 6/06/17, clearing a "double bottom" base while rebounding toward prior highs. It was last shown in this FSU section on 7/20/17 with an annotated graph under the headline, "Still Faces Some Resistance Due to Overhead Supply". Recently it reported earnings +40% on +57% sales revenues for the Apr '17 quarter, continuing its strong earnings history. The past 3 quarters were above the +25% minimum earnings guideline (C criteria) of the fact-based investment system. Its annual earnings history (A criteria) has been good. Return on Equity is reported at 23%, well above the 17% minimum guideline.
It has earned a current Timeliness rating of C and a Sponsorship rating of B. The number of top-rated funds owning its shares rose from 489 in Mar '16 to 590 in Jun '17. Its current Up/Down Volume Ratio of 1.0 is an unbiased indication its shares have been neutral concerning accumulation/distribution over the past 50 days (I criteria). Its small supply of only 48.9 million shares (S criteria) in the public float can contribute to greater volatility in the event of institutional buying or selling. |
|
|
Color Codes Explained :
Y - Better candidates highlighted by our
staff of experts.
G - Previously featured
in past reports as yellow but may no longer be buyable under the
guidelines.
***Last / Change / Volume data in this table is the closing quote data***
Symbol/Exchange
Company Name
Industry Group |
PRICE |
CHANGE
(%Change) |
Day High |
Volume
(% DAV)
(% 50 day avg vol) |
52 Wk Hi
% From Hi |
Featured
Date |
Price
Featured |
Pivot Featured |
|
Max Buy |
THO
-
NYSE
Thor Industries Inc
AUTOMOTIVE - Recreational Vehicles
|
$103.45
|
+0.72
0.70% |
$103.68
|
755,368
140.95% of 50 DAV
50 DAV is 535,900
|
$115.74
-10.62%
|
8/14/2017
|
$106.67
|
PP = $110.01
|
|
MB = $115.51
|
 Most Recent Note - 8/21/2017 5:55:27 PM
G - Still sputtering below its 50 DMA line ($105). A rebound above the 50 DMA line is needed for its outlook improve. Subsequent volume-driven gains above the pivot point may trigger a new (or add-on) technical buy signal. See the latest FSU analysis for more details and a new annotated graph.
>>> FEATURED STOCK ARTICLE : Slump Below 50-Day Average Hurt Technical Stance - 8/21/2017 |
View all notes |
Set NEW NOTE alert |
Company Profile |
SEC
News |
Chart |
Request a new note
C
A
S
I |
BERY
-
NYSE
Berry Global Group Inc
CONSUMER NON-DURABLES - Packaging and Containers
|
$56.86
|
-0.96
-1.66% |
$58.06
|
560,380
63.75% of 50 DAV
50 DAV is 879,000
|
$58.95
-3.55%
|
7/14/2017
|
$57.67
|
PP = $59.05
|
|
MB = $62.00
|
Most Recent Note - 8/21/2017 6:02:19 PM
G - Slumped below its 50 DMA line ($57.45) with today's loss on lighter volume. The recent low defines important near-term support ($55.60 on 8/03/17). Reported Jun '17 quarterly earnings +13% on +16% sales revenues, below the +25% minimum earnings guideline (C criteria), raising fundamental concerns.
>>> FEATURED STOCK ARTICLE : Fundamental Concerns Yet Rebound Helped Technical Stance - 8/14/2017 |
View all notes |
Set NEW NOTE alert |
Company Profile |
SEC
News |
Chart |
Request a new note
C
A
S
I |
HSKA
-
NASDAQ
Heska Corporation
DRUGS - Biotechnology
|
$99.39
|
+1.60
1.64% |
$100.67
|
65,908
99.86% of 50 DAV
50 DAV is 66,000
|
$115.00
-13.57%
|
7/31/2017
|
$114.27
|
PP = $110.35
|
|
MB = $115.87
|
Most Recent Note - 8/21/2017 6:07:50 PM
G - Rebounded near its 50 DMA line ($99.91) with today's gain on higher (near average) volume. Encountered distributional pressure since highlighted in yellow in the 7/31/17 mid-day report with pivot point cited based on its high hit on 5/01/17 plus 10 cents. Failed to produce confirming gains since repeatedly noted - "Subsequent gains and a strong finish above its pivot point may clinch a convincing technical buy signal. Small supply of only 6 million shares in the public float (S criteria) can contribute to greater price volatility in the event of institutional buying or selling."
>>> FEATURED STOCK ARTICLE : Small Supply of Shares and Closed In Lower Half of Intra-day Range - 7/31/2017 |
View all notes |
Set NEW NOTE alert |
Company Profile |
SEC
News |
Chart |
Request a new note
C
A
S
I |
EW
-
NYSE
Edwards Lifesciences Cp
HEALTH SERVICES - Medical Appliances and Equipment
|
$114.22
|
+1.11
0.98% |
$114.99
|
1,051,855
87.87% of 50 DAV
50 DAV is 1,197,100
|
$121.75
-6.18%
|
7/11/2017
|
$117.23
|
PP = $121.85
|
|
MB = $127.94
|
Most Recent Note - 8/17/2017 11:17:34 AM
G - Perched only -5.6% off its 52-week and all-time high. Relative Strength Rating has slumped to 77, below the 80+ minimum guideline for buy candidates. A rebound above its 50 DMA line ($116.74) is needed for its outlook to improve. Fundamentals remain strong.
>>> FEATURED STOCK ARTICLE : Near 50-Day Moving Average Line, Yet Not Far Off High - 8/7/2017 |
View all notes |
Set NEW NOTE alert |
Company Profile |
SEC
News |
Chart |
Request a new note
C
A
S
I |
STMP
-
NASDAQ
Stamps.com Inc
INTERNET - Internet Software and Services
|
$207.80
|
-2.55
-1.21% |
$212.50
|
219,496
44.70% of 50 DAV
50 DAV is 491,000
|
$220.25
-5.65%
|
5/24/2017
|
$133.10
|
PP = $136.10
|
|
MB = $142.91
|
Most Recent Note - 8/17/2017 11:21:15 AM
G - Still stubbornly holding ground near its all-time high, extended from any sound base. Its 50 DMA line ($161) and prior highs define important near-term support in the $156 area. Fundamentals remain strong.
>>> FEATURED STOCK ARTICLE : Blasted Higher After Latest Strong Earnings Report - 8/11/2017 |
View all notes |
Set NEW NOTE alert |
Company Profile |
SEC
News |
Chart |
Request a new note
C
A
S
I |
Symbol/Exchange
Company Name
Industry Group |
PRICE |
CHANGE
(%Change) |
Day High |
Volume
(% DAV)
(% 50 day avg vol) |
52 Wk Hi
% From Hi |
Featured
Date |
Price
Featured |
Pivot Featured |
|
Max Buy |
HTHT
-
NASDAQ
China Lodging Group Ads
LEISURE - Lodging
|
$112.94
|
+4.15
3.81% |
$113.04
|
482,699
168.78% of 50 DAV
50 DAV is 286,000
|
$110.76
1.97%
|
9/29/2016
|
$46.12
|
PP = $47.82
|
|
MB = $50.21
|
Most Recent Note - 8/21/2017 11:49:34 AM
G - Hitting yet another new all-time high with today's gain, very extended from any sound base. Last week it reported earnings +19% on +18% sales revenues for the Jun '17 quarter, below the +25% minimum earnings guideline (C criteria). Its 50 DMA line coincides with prior highs in the $88 area defining very important near-term support.
>>> FEATURED STOCK ARTICLE : Extended From Sound Base With Earnings News Due Next Week - 8/9/2017 |
View all notes |
Set NEW NOTE alert |
Company Profile |
SEC
News |
Chart |
Request a new note
C
A
S
I |
LMAT
-
NASDAQ
Lemaitre Vascular Inc
Medical-Products
|
$33.83
|
-0.08
-0.22% |
$34.10
|
89,738
43.14% of 50 DAV
50 DAV is 208,000
|
$36.09
-6.26%
|
7/28/2017
|
$33.50
|
PP = $33.32
|
|
MB = $34.99
|
Most Recent Note - 8/21/2017 6:10:25 PM
Y - Volume totals have been cooling since its breakout while stubbornly holding its ground above prior highs in the $32-33 area previously noted as initial support to watch. Disciplined investors avoid chasing extended stocks more than +5% above prior highs, and they always limit losses by selling any stock that falls more than -7% from their purchase price.
>>> FEATURED STOCK ARTICLE : Big Volume-Driven Gain Following Strong Earnings News - 7/28/2017 |
View all notes |
Set NEW NOTE alert |
Company Profile |
SEC
News |
Chart |
Request a new note
C
A
S
I |
BEAT
-
NASDAQ
BioTelemetry Inc
Medical-Services
|
$35.85
|
+0.15
0.42% |
$36.09
|
245,512
53.79% of 50 DAV
50 DAV is 456,400
|
$37.50
-4.40%
|
2/14/2017
|
$25.10
|
PP = $24.55
|
|
MB = $25.78
|
Most Recent Note - 8/17/2017 5:53:05 PM
G - Retreating from its all-time high. Fundamental concerns remain. Jun '17 quarterly earnings rose +10% on +10% sales revenues, its 2nd consecutive quarterly comparison below the +25% minimum earnings guideline (C criteria). Its 50 DMA line ($32.88) defines near-term support along with prior lows. See the latest FSU analysis for more details and a new annotated graph.
>>> FEATURED STOCK ARTICLE : Technically Strong Despite Recent Fundamental Concerns - 8/17/2017 |
View all notes |
Set NEW NOTE alert |
Company Profile |
SEC
News |
Chart |
Request a new note
C
A
S
I |
ESNT
-
NYSE
Essent Group Ltd
Finance-MrtgandRel Svc
|
$37.91
|
+0.04
0.11% |
$38.15
|
302,926
52.59% of 50 DAV
50 DAV is 576,000
|
$41.44
-8.52%
|
7/3/2017
|
$38.05
|
PP = $39.60
|
|
MB = $41.58
|
Most Recent Note - 8/21/2017 6:04:00 PM
Y - Completed a new Public Offering on 8/08/17, pulling back after spiking to a new all-time high. Recently finding support near its 50 DMA line ($38). Its 200 DMA line and prior lows define near-term support in the $34-35 area.
>>> FEATURED STOCK ARTICLE : Perched Within Close Striking Distance of a New High - 8/1/2017 |
View all notes |
Set NEW NOTE alert |
Company Profile |
SEC
News |
Chart |
Request a new note
C
A
S
I |
VEEV
-
NYSE
Veeva Systems Inc Cl A
Computer Sftwr-Medical
|
$63.18
|
+0.06
0.10% |
$63.92
|
912,049
70.10% of 50 DAV
50 DAV is 1,301,000
|
$68.07
-7.18%
|
7/24/2017
|
$65.91
|
PP = $68.17
|
|
MB = $71.58
|
Most Recent Note - 8/21/2017 6:13:19 PM
Y - Due to report Jul '17 earnings after market close on Thursday, August 24, 2017. Volume and volatility often increase near earnings news. Consolidating just above its 50 DMA line ($62.48) with little resistance remaining due to overhead supply up through the $68 level. Volume-driven gains above prior highs are still needed to trigger a new (or add-on) technical buy signal.
>>> FEATURED STOCK ARTICLE : Slump Below 50-Day Moving Average Line Raises Concerns - 8/2/2017 |
View all notes |
Set NEW NOTE alert |
Company Profile |
SEC
News |
Chart |
Request a new note
C
A
S
I |
Symbol/Exchange
Company Name
Industry Group |
PRICE |
CHANGE
(%Change) |
Day High |
Volume
(% DAV)
(% 50 day avg vol) |
52 Wk Hi
% From Hi |
Featured
Date |
Price
Featured |
Pivot Featured |
|
Max Buy |
ANET
-
NYSE
Arista Networks Inc
TELECOMMUNICATIONS - Communication Equipment
|
$172.01
|
+0.00
0.00% |
$173.89
|
664,562
76.39% of 50 DAV
50 DAV is 870,000
|
$176.50
-2.54%
|
8/4/2017
|
$173.31
|
PP = $163.07
|
|
MB = $171.22
|
Most Recent Note - 8/21/2017 6:00:12 PM
G - Recently wedged above its "max buy" level with small gains lacking great volume conviction and its color code is changed to green. Prior highs in the $162 area define initial support to watch above its 50 DMA line ($157). Fundamentals remain strong.
>>> FEATURED STOCK ARTICLE : Networking Firm Consolidating Above 50-Day Moving Average Line - 7/18/2017 |
View all notes |
Set NEW NOTE alert |
Company Profile |
SEC
News |
Chart |
Request a new note
C
A
S
I |
GRUB
-
NYSE
Grubhub Inc
COMPUTER SOFTWARE and SERVICES - Technical and System Software
|
$54.36
|
+0.49
0.91% |
$54.57
|
871,819
42.30% of 50 DAV
50 DAV is 2,061,000
|
$57.26
-5.06%
|
6/21/2017
|
$47.33
|
PP = $46.94
|
|
MB = $49.29
|
Most Recent Note - 8/17/2017 5:57:22 PM
G - Pulling back from its all-time high after getting very extended from any sound base. Prior highs and its 50 DMA line define near-term support in the $47-48 area. Recently reported earnings +13% on +32% sales revenues for the Jun '17 quarter, below the +25% minimum earnings guideline (C criteria) raising fundamental concerns.
>>> FEATURED STOCK ARTICLE : Spiked Into New High Territory Despite Sub Par Earnings News - 8/8/2017 |
View all notes |
Set NEW NOTE alert |
Company Profile |
SEC
News |
Chart |
Request a new note
C
A
S
I |
IBP
-
NYSE
Installed Building Prod
DIVERSIFIED SERVICES - Business/Management Services
|
$56.80
|
+0.35
0.62% |
$57.60
|
170,900
133.52% of 50 DAV
50 DAV is 128,000
|
$60.00
-5.33%
|
6/13/2017
|
$54.25
|
PP = $55.55
|
|
MB = $58.33
|
Most Recent Note - 8/18/2017 5:36:01 PM
Y - Pulled back below its "max buy" level and its color code is changed to yellow. Prior highs in the $55 area define initial support after a big volume-driven gain on 8/04/17 triggered a technical buy signal. See the latest FSU analysis for more details and a new annotated graph.
>>> FEATURED STOCK ARTICLE : Consolidating Near Prior High Following Breakout - 8/18/2017 |
View all notes |
Set NEW NOTE alert |
Company Profile |
SEC
News |
Chart |
Request a new note
C
A
S
I |
NCOM
-
NASDAQ
National Commerce Corp
BANKING - Regional - Southeast Banks
|
$39.30
|
+0.25
0.64% |
$39.45
|
18,205
58.73% of 50 DAV
50 DAV is 31,000
|
$41.25
-4.73%
|
4/25/2017
|
$38.95
|
PP = $40.09
|
|
MB = $42.09
|
Most Recent Note - 8/17/2017 12:11:58 PM
G - Slumped further below its 50 DMA line ($39.60) and its color code was changed to green. Early weakness undercut the recent low ($38.75 on 7/20/17) raising concerns and triggering a more worrisome technical sell signal. Reported Jun '17 earnings +23% on +45% sales revenues, below the +25% minimum earnings guideline (C criteria), raising fundamental concerns. See the latest FSU analysis for more details and an annotated graph.
>>> FEATURED STOCK ARTICLE : Consolidating Near 50-day Moving Average Line - 8/16/2017 |
View all notes |
Set NEW NOTE alert |
Company Profile |
SEC
News |
Chart |
Request a new note
C
A
S
I |
OLLI
-
NASDAQ
Ollie's Bargain Outlet
Retail-DiscountandVariety
|
$43.50
|
-0.85
-1.92% |
$44.25
|
453,243
66.75% of 50 DAV
50 DAV is 679,000
|
$46.08
-5.59%
|
7/17/2017
|
$43.96
|
PP = $44.18
|
|
MB = $46.39
|
Most Recent Note - 8/18/2017 5:37:21 PM
Y - Consolidating above support at its 50 DMA line ($42.91). Confirming gains and a strong close above the pivot point backed by at least +40% above average volume may trigger a new (or add-on) technical buy signal.
>>> FEATURED STOCK ARTICLE : Quietly Consolidating Above 50 Day Moving Average Near High - 8/10/2017 |
View all notes |
Set NEW NOTE alert |
Company Profile |
SEC
News |
Chart |
Request a new note
C
A
S
I |
Symbol/Exchange
Company Name
Industry Group |
PRICE |
CHANGE
(%Change) |
Day High |
Volume
(% DAV)
(% 50 day avg vol) |
52 Wk Hi
% From Hi |
Featured
Date |
Price
Featured |
Pivot Featured |
|
Max Buy |
MOMO
-
NASDAQ
Momo Inc.
INTERNET - Content
|
$45.08
|
+1.26
2.88% |
$45.11
|
5,927,494
133.60% of 50 DAV
50 DAV is 4,436,800
|
$46.69
-3.45%
|
7/25/2017
|
$44.05
|
PP = $46.05
|
|
MB = $48.35
|
Most Recent Note - 8/21/2017 11:57:26 AM
Y - Due to report earnings on Tuesday, August 22nd after the close. Volume and volatility often increase near earnings news. Recently found support at its 50 DMA line. Subsequent volume-driven gains for new highs may trigger a new (or add-on) technical buy signal. Its 50 DMA line and latest low ($40.50) define important chart support where violations would trigger technical sell signals.
>>> FEATURED STOCK ARTICLE : Perched Within Striking Distance of Prior High - 7/25/2017 |
View all notes |
Set NEW NOTE alert |
Company Profile |
SEC
News |
Chart |
Request a new note
C
A
S
I |
HLI
-
NYSE
Houlihan Lokey Inc Cl A
Finance-Invest Bnk/Bkrs
|
$35.71
|
+0.22
0.62% |
$35.74
|
165,294
91.32% of 50 DAV
50 DAV is 181,000
|
$39.68
-10.01%
|
5/10/2017
|
$35.85
|
PP = $35.05
|
|
MB = $36.80
|
Most Recent Note - 8/21/2017 6:06:27 PM
Y - Managed a positive reversal on the prior session, finding support while consolidating near its 50 DMA line ($35.84). Damaging losses below the recent low ($34.41 on 8/18/17) would raise serious concerns and trigger a technical sell signal.
>>> FEATURED STOCK ARTICLE : Extended Leader Encounters Distributional Pressure - 7/27/2017 |
View all notes |
Set NEW NOTE alert |
Company Profile |
SEC
News |
Chart |
Request a new note
C
A
S
I |
|
|
|
THESE ARE NOT BUY RECOMMENDATIONS!
Comments contained in the body of this report are technical
opinions only. The material herein has been obtained
from sources believed to be reliable and accurate, however,
its accuracy and completeness cannot be guaranteed.
This site is not an investment advisor, hence it does
not endorse or recommend any securities or other investments.
Any recommendation contained in this report may not
be suitable for all investors and it is not to be deemed
an offer or solicitation on our part with respect to
the purchase or sale of any securities. All trademarks,
service marks and trade names appearing in this report
are the property of their respective owners, and are
likewise used for identification purposes only.
This report is a service available
only to active Paid Premium Members.
You may opt-out of receiving report notifications
at any time. Questions or comments may be submitted
by writing to Premium Membership Services 665 S.E. 10 Street, Suite 201 Deerfield Beach, FL 33441-5634 or by calling 1-800-965-8307
or 954-785-1121.
|
|
|