You are not logged in.
This means you
CAN ONLY VIEW reports that were published prior to Sunday, April 6, 2025.
You
MUST UPGRADE YOUR MEMBERSHIP if you want to see any current reports.
AFTER MARKET UPDATE - FRIDAY, SEPTEMBER 1ST, 2017
Previous After Market Report Next After Market Report >>>
|
|
|
|
DOW |
+39.46 |
21,987.56 |
+0.18% |
|
Volume |
651,435,790 |
-31% |
|
Volume |
1,486,414,520 |
-21% |
|
NASDAQ |
+6.67 |
6,435.33 |
+0.10% |
|
Advancers |
2,030 |
70% |
|
Advancers |
1,925 |
67% |
|
S&P 500 |
+4.90 |
2,476.55 |
+0.20% |
|
Decliners |
866 |
30% |
|
Decliners |
927 |
32% |
|
Russell 2000 |
+8.29 |
1,413.57 |
+0.59% |
|
52 Wk Highs |
165 |
|
|
52 Wk Highs |
190 |
|
|
S&P 600 |
+6.62 |
847.05 |
+0.79% |
|
52 Wk Lows |
17 |
|
|
52 Wk Lows |
23 |
|
|
 |
Volume Light as Indices Post Gains Ahead of Labor Day Weekend
Kenneth J. Gruneisen - Passed the CAN SLIM® Master's Exam
For the week, the Dow was up 0.8%, the S&P added 1.4% and the Nasdaq Composite gained 2.7%. Stocks closed higher on Friday. The Dow gained 39 points to 21988, while the Nasdaq was up 6 points to 6435 and the S&P 500 climbed 4 points to 2476. Volume totals reported were lighter than the prior session totals on the NYSE and on the Nasdaq exchange as traders headed off early for the extra long Labor Day weekend. Breadth was positive as advancers led decliners by more than a 2-1 margin on the NYSE and on the Nasdaq exchange. Leadership improved as there were 78 high-ranked companies from the Leaders List that made new 52-week highs and were listed on the BreakOuts Page, up from the total of 73 on the prior session. New 52-week highs totals swelled and solidly outnumbered a shrinking new 52-week lows list on the Nasdaq exchange and on the NYSE. The Featured Stocks Page provides the latest analysis on noteworthy high-ranked leaders. Charts used courtesy of www.stockcharts.com
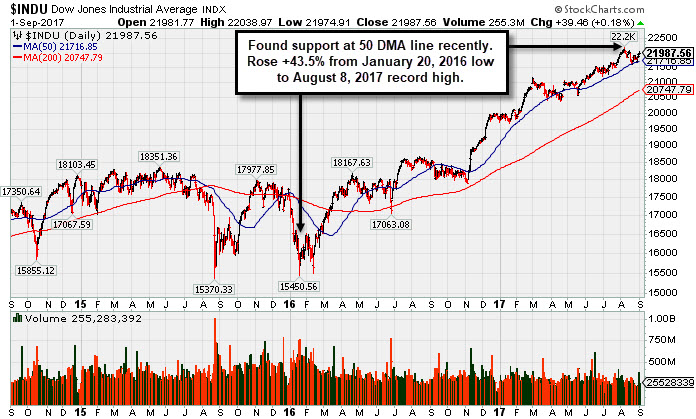 PICTURED: The Dow Jones Industrial Average quietly posted a 4th consecutive gain. Its 50-day moving average (DMA) line and recent lows define important near-term support to watch on any subsequent pullbacks. The 3-year graph illustrates how the Blue Chip index rallied +43.5% from its January 20, 2016 low to the August 8, 2017 record high.
The major averages' (M criteria) uptrend endured recent pressure however leadership has remained healthy. Investors should buy stocks meeting all key criteria of the fact-based investment system on a case-by-case basis as they trigger technical buy signals.
Major averages started September in positive territory following a flurry of data releases. Nonfarm payrolls rose 156,000 in August, below the consensus estimate of 180,000. Further, July’s robust 209,000 increase was revised lower to 189,000. The unemployment rate edged up to 4.4% from 4.3% .In a separate release, The Institute for Supply Management reported U.S. manufacturing PMI climbed to 58.8 in August from 56.3 in July, the highest reading since April 2011. Finally, the University of Michigan adjusted the reading on consumer sentiment for August to 96.8, below the prior reading of 97.6 but still above July’s 93.4 level.
Seven of 11 sectors in the S&P 500 closed up on the day, Energy and Consumer Discretionary stocks outperformed and Utilities lagged. In earnings, Lululemon (LULU +7.19%) and Palo Alto Networks (PANW +10.54%) rose after each topped Wall Street profit projections.
Treasuries sold off late in the session with the 10-year note falling 12/32 to yield 2.16%. In commodities, NYMEX WTI crude added 0.1% to $47.28/barrel. Gasoline futures fell 2.1%, their first loss in nine sessions following a 25% surge in August. COMEX Gold added 0.4% to $1324.10/ounce. |
 Kenneth J. Gruneisen started out as a licensed stockbroker in August 1987, a couple of months prior to the historic stock market crash that took the Dow Jones Industrial Average down -22.6% in a single day. He has published daily fact-based fundamental and technical analysis on high-ranked stocks online for two decades. Through FACTBASEDINVESTING.COM, Kenneth provides educational articles, news, market commentary, and other information regarding proven investment systems that work in good times and bad.
Comments contained in the body of this report are technical opinions only and are not necessarily those of Gruneisen Growth Corp. The material herein has been obtained from sources believed to be reliable and accurate, however, its accuracy and completeness cannot be guaranteed. Our firm, employees, and customers may effect transactions, including transactions contrary to any recommendation herein, or have positions in the securities mentioned herein or options with respect thereto. Any recommendation contained in this report may not be suitable for all investors and it is not to be deemed an offer or solicitation on our part with respect to the purchase or sale of any securities. |
|
 |
Positive Bias Boosted All Industry Groups
Kenneth J. Gruneisen - Passed the CAN SLIM® Master's Exam
On Friday the Retail Index ($RLX +0.38%), Broker/Dealer Index ($XBD +0.54%) and the Bank Index ($BKX +0.75%) posted gains which gave the major indices a boost. The tech sector was quiet but had a positive bias as the Biotechnology Index ($BTK +0.57%) outpaced the Semiconductor Index ($SOX +0.45%) and the Networking Index ($NWX +0.15%). The Oil Services Index ($OSX +1.52%) and the Integrated Oil Index ($XOI +1.04%) both outpaced the Gold & Silver Index ($XAU +0.46%) while commodity-linked groups also rose. Charts courtesy www.stockcharts.com
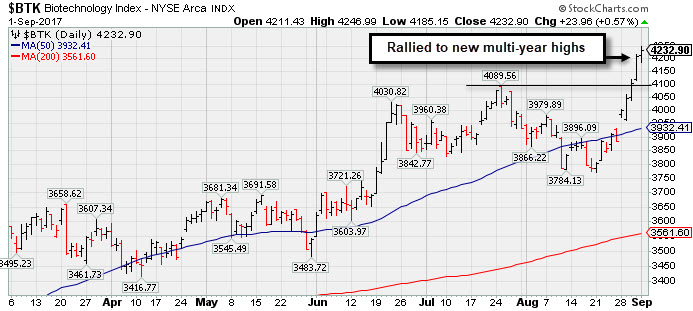
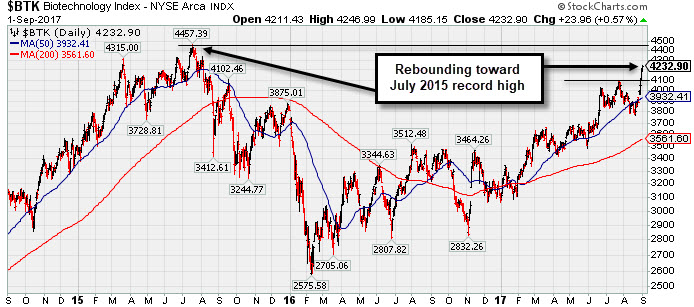
) PICTURED: The top graph shows the Biotechnology Index ($BTK +0.57%) rallying to new multi-year highs. The 3 year graph illustrates the deep consolidation since it peaked in July 2015, and the ongoing rebound.
| Oil Services |
$OSX |
122.46 |
+1.84 |
+1.53% |
-33.37% |
| Integrated Oil |
$XOI |
1,115.57 |
+11.48 |
+1.04% |
-12.02% |
| Semiconductor |
$SOX |
1,119.34 |
+5.03 |
+0.45% |
+23.48% |
| Networking |
$NWX |
456.92 |
+0.67 |
+0.15% |
+2.43% |
| Broker/Dealer |
$XBD |
228.21 |
+1.24 |
+0.54% |
+11.17% |
| Retail |
$RLX |
1,478.93 |
+5.64 |
+0.38% |
+10.12% |
| Gold & Silver |
$XAU |
90.54 |
+0.42 |
+0.47% |
+14.81% |
| Bank |
$BKX |
93.68 |
+0.70 |
+0.75% |
+2.06% |
| Biotech |
$BTK |
4,232.90 |
+23.96 |
+0.57% |
+37.65% |
|
|
|
 |
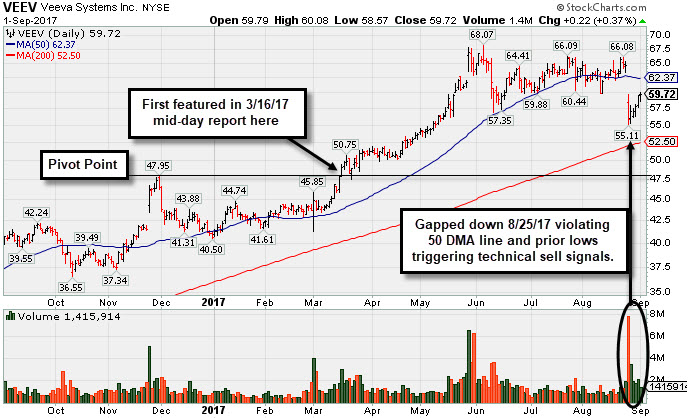
Rebounding After gap Down Violated 50-Day Average and Prior Lows
Kenneth J. Gruneisen - Passed the CAN SLIM® Master's Exam
Veeva Systems Inc Cl A (VEEV +$0.22 or +0.37% to $59.72) posted a 5th consecutive gain today. On 8/25/17 it gapped down violating its 50-day moving average (DMA) line and undercutting prior lows with a damaging volume-driven loss triggering technical sell signals. A rebound above the 50 DMA line ($62.37) is needed for its outlook to improve. Recent weakness came immediately after the company reported Jul '17 earnings +53% on +27% sales revenues, still well above the +25% minimum earnings guideline (C criteria). Members were recently reminded, "Volume and volatility often increase near earnings news."
VEEV traded up as much as +38% since first highlighted in yellow with a pivot point based on its 11/30/16 high plus 10 cents in the 3/16/17 mid-day report (read here). It showed mostly distributional action in the weeks since last shown in this FSU section on 8/02/17 with an annotated graph under the headline, "Slump Below 50-Day Moving Average Line Raises Concerns".
Its annual earnings (A criteria) history has been strong. It has the highest possible 99 Earnings Per Share (EPS) rank and it has a 86 Relative Strength (RS) rating. Both of those ratings must be above 80 for a stock to meet the guidelines for consideration.
The number of top-rated funds owning its shares rose from 340 in Mar '16 to 583 in Jun '17, a reassuring sign concerning the I criteria. Its current Up/Down Volume Ratio of 1.1 is an unbiased indication its shares have been under slight accumulation over the past 50 days.
|
|
|
Color Codes Explained :
Y - Better candidates highlighted by our
staff of experts.
G - Previously featured
in past reports as yellow but may no longer be buyable under the
guidelines.
***Last / Change / Volume data in this table is the closing quote data***
Symbol/Exchange
Company Name
Industry Group |
PRICE |
CHANGE
(%Change) |
Day High |
Volume
(% DAV)
(% 50 day avg vol) |
52 Wk Hi
% From Hi |
Featured
Date |
Price
Featured |
Pivot Featured |
|
Max Buy |
THO
-
NYSE
Thor Industries Inc
AUTOMOTIVE - Recreational Vehicles
|
$109.01
|
+0.37
0.34% |
$109.22
|
438,150
83.33% of 50 DAV
50 DAV is 525,800
|
$115.74
-5.81%
|
8/14/2017
|
$106.67
|
PP = $110.01
|
|
MB = $115.51
|
Most Recent Note - 8/28/2017 1:38:51 PM
Y - Gapped up today rebounding above its 50 DMA line ($105) helping its technical stance and outlook improve and its color code is changed to yellow. Encountered distributional pressure after earlier gains lifted it above the previously cited pivot point and challenged its all-time high. A strong finish may help clinch a convincing new (or add-on) technical buy signal, however its current Relative Strength Rating of 79 is just below the 80+ minimum guideline for buy candidates under the fact-based investment system.
>>> FEATURED STOCK ARTICLE : Slump Below 50-Day Average Hurt Technical Stance - 8/21/2017 |
View all notes |
Set NEW NOTE alert |
Company Profile |
SEC
News |
Chart |
Request a new note
C
A
S
I |
BERY
-
NYSE
Berry Plastics Group Inc
CONSUMER NON-DURABLES - Packaging and Containers
|
$56.85
|
+0.61
1.08% |
$56.88
|
1,310,082
152.78% of 50 DAV
50 DAV is 857,500
|
$58.95
-3.56%
|
7/14/2017
|
$57.67
|
PP = $59.05
|
|
MB = $62.00
|
 Most Recent Note - 9/1/2017 6:19:18 PM
G - Rebounded toward its 50 DMA line ($57.22) with today's gain backed by higher volume. Reported Jun '17 quarterly earnings +13% on +16% sales revenues, below the +25% minimum earnings guideline (C criteria), raising fundamental concerns.
>>> FEATURED STOCK ARTICLE : Fundamental Concerns Yet Rebound Helped Technical Stance - 8/14/2017 |
View all notes |
Set NEW NOTE alert |
Company Profile |
SEC
News |
Chart |
Request a new note
C
A
S
I |
HSKA
-
NASDAQ
Heska Corporation
DRUGS - Biotechnology
|
$101.80
|
+0.08
0.08% |
$103.19
|
68,425
105.27% of 50 DAV
50 DAV is 65,000
|
$115.00
-11.48%
|
7/31/2017
|
$114.27
|
PP = $110.35
|
|
MB = $115.87
|
Most Recent Note - 8/30/2017 6:29:16 PM
Y - Rallied above its 50 DMA line ($100.56) with today's gain on higher volume, helping its technical stance improve, and its color code is changed to yellow. Encountered distributional pressure since highlighted in yellow in the 7/31/17 mid-day report with pivot point cited based on its high hit on 5/01/17 plus 10 cents. See the latest FSU analysis for more detailed analysis with a new annotated graph.
>>> FEATURED STOCK ARTICLE : Rally Above 50-Day Moving Average Line Improved Technical Stance - 8/30/2017 |
View all notes |
Set NEW NOTE alert |
Company Profile |
SEC
News |
Chart |
Request a new note
C
A
S
I |
AVGO
-
NASDAQ
Broadcom Limited
ELECTRONICS - Semiconductor - Broad Line
|
$252.73
|
+0.66
0.26% |
$255.34
|
2,324,172
93.75% of 50 DAV
50 DAV is 2,479,000
|
$259.36
-2.56%
|
8/24/2017
|
$252.44
|
PP = $256.89
|
|
MB = $269.73
|
Most Recent Note - 8/29/2017 12:34:23 PM
G - Prior low ($238.70) on 8/11/17) defines the next technical support level to watch. Volume-driven losses violated its 50 DMA line ($246) raising concerns and triggering a technical sell signal. Reported earnings +42% on +18% sales revenues for the Jul '17 quarter. Volume and volatility often increase near earnings news. It was highlighted in the 8/24/17 mid-day report - "Subsequent volume-driven gains above the pivot and for new highs may trigger a technical buy signal. Prior quarterly and annual earnings history (C and A criteria) is a good match with the fact-based investment system's fundamental guidelines." See the latest FSU analysis for more details and an annotated graph.
>>> FEATURED STOCK ARTICLE : Pullback Followed Latest Strong Earnings Report From Tech Leader - 8/25/2017 |
View all notes |
Set NEW NOTE alert |
Company Profile |
SEC
News |
Chart |
Request a new note
C
A
S
I |
EW
-
NYSE
Edwards Lifesciences Cp
HEALTH SERVICES - Medical Appliances and Equipment
|
$113.31
|
-0.35
-0.31% |
$114.10
|
949,994
79.16% of 50 DAV
50 DAV is 1,200,100
|
$121.75
-6.93%
|
7/11/2017
|
$117.23
|
PP = $121.85
|
|
MB = $127.94
|
Most Recent Note - 8/29/2017 5:55:31 PM
G - Slumped with higher (near average) volume today closing -8.1% off its all-time high. Relative Strength Rating has slumped to 71, below the 80+ minimum guideline for buy candidates. A rebound above its downward sloping 50 DMA line ($116) is needed for its outlook to improve. Fundamentals remain strong.
>>> FEATURED STOCK ARTICLE : Near 50-Day Moving Average Line, Yet Not Far Off High - 8/7/2017 |
View all notes |
Set NEW NOTE alert |
Company Profile |
SEC
News |
Chart |
Request a new note
C
A
S
I |
Symbol/Exchange
Company Name
Industry Group |
PRICE |
CHANGE
(%Change) |
Day High |
Volume
(% DAV)
(% 50 day avg vol) |
52 Wk Hi
% From Hi |
Featured
Date |
Price
Featured |
Pivot Featured |
|
Max Buy |
STMP
-
NASDAQ
Stamps.com Inc
INTERNET - Internet Software and Services
|
$192.10
|
+0.85
0.44% |
$195.00
|
267,489
55.73% of 50 DAV
50 DAV is 480,000
|
$220.25
-12.78%
|
5/24/2017
|
$133.10
|
PP = $136.10
|
|
MB = $142.91
|
Most Recent Note - 8/31/2017 2:47:25 PM
G - Very extended from any sound base. Its 50 DMA line ($172) defines near-term support above prior highs in the $156 area. Fundamentals remain strong.
>>> FEATURED STOCK ARTICLE : Blasted Higher After Latest Strong Earnings Report - 8/11/2017 |
View all notes |
Set NEW NOTE alert |
Company Profile |
SEC
News |
Chart |
Request a new note
C
A
S
I |
HTHT
-
NASDAQ
China Lodging Group Ads
LEISURE - Lodging
|
$115.62
|
+2.11
1.86% |
$116.45
|
250,361
79.23% of 50 DAV
50 DAV is 316,000
|
$118.00
-2.02%
|
9/29/2016
|
$46.12
|
PP = $47.82
|
|
MB = $50.21
|
Most Recent Note - 8/30/2017 6:34:47 PM
G - Rebounded toward its all-time high with today's gain on lighter volume. Very extended from any sound base. Recently reported earnings +19% on +18% sales revenues for the Jun '17 quarter, below the +25% minimum earnings guideline (C criteria). Its 50 DMA line ($94.61) defines support above prior highs in the $88 area.
>>> FEATURED STOCK ARTICLE : Extended From Sound Base With Earnings News Due Next Week - 8/9/2017 |
View all notes |
Set NEW NOTE alert |
Company Profile |
SEC
News |
Chart |
Request a new note
C
A
S
I |
LMAT
-
NASDAQ
Lemaitre Vascular Inc
Medical-Products
|
$36.60
|
+0.20
0.55% |
$36.92
|
142,288
68.41% of 50 DAV
50 DAV is 208,000
|
$37.50
-2.40%
|
7/28/2017
|
$33.50
|
PP = $33.32
|
|
MB = $34.99
|
Most Recent Note - 8/28/2017 6:06:29 PM
G - Gapped up today hitting another new all-time high with a big gain backed by +134% above average volume after a brief consolidation. Color code was changed to green after rising more than +5% above the previous pivot point cited. See the latest FSU analysis for more details and a new annotated graph.
>>> FEATURED STOCK ARTICLE : Volume-Driven Gain for New High And Strong Finish Bode Well - 8/28/2017 |
View all notes |
Set NEW NOTE alert |
Company Profile |
SEC
News |
Chart |
Request a new note
C
A
S
I |
BEAT
-
NASDAQ
BioTelemetry Inc
Medical-Services
|
$37.60
|
+0.45
1.21% |
$37.78
|
257,392
61.40% of 50 DAV
50 DAV is 419,200
|
$37.71
-0.30%
|
2/14/2017
|
$25.10
|
PP = $24.55
|
|
MB = $25.78
|
Most Recent Note - 8/30/2017 6:37:59 PM
G - Posted a gain today on light volume for its second-best close ever. Fundamental concerns remain. Jun '17 quarterly earnings rose +10% on +10% sales revenues, its 2nd consecutive quarterly comparison below the +25% minimum earnings guideline (C criteria). Its 50 DMA line ($34.08) defines near-term support along with prior lows.
>>> FEATURED STOCK ARTICLE : Technically Strong Despite Recent Fundamental Concerns - 8/17/2017 |
View all notes |
Set NEW NOTE alert |
Company Profile |
SEC
News |
Chart |
Request a new note
C
A
S
I |
ESNT
-
NYSE
Essent Group Ltd
Finance-MrtgandRel Svc
|
$38.98
|
-0.10
-0.26% |
$39.14
|
363,522
57.52% of 50 DAV
50 DAV is 632,000
|
$41.44
-5.94%
|
7/3/2017
|
$38.05
|
PP = $39.60
|
|
MB = $41.58
|
Most Recent Note - 8/31/2017 2:40:36 PM
Y - Today's gain has it rebounding above its 50 DMA line ($38.29) helping its outlook improve and its color code is changed to yellow. Completed a new Public Offering on 8/08/17. Prior lows ($36.71 on 8/11/17) and its 200 DMA line define near-term support in the $34-35 area.
>>> FEATURED STOCK ARTICLE : Perched Within Close Striking Distance of a New High - 8/1/2017 |
View all notes |
Set NEW NOTE alert |
Company Profile |
SEC
News |
Chart |
Request a new note
C
A
S
I |
Symbol/Exchange
Company Name
Industry Group |
PRICE |
CHANGE
(%Change) |
Day High |
Volume
(% DAV)
(% 50 day avg vol) |
52 Wk Hi
% From Hi |
Featured
Date |
Price
Featured |
Pivot Featured |
|
Max Buy |
OLED
-
NASDAQ
Universal Display Corp
Elec-Misc Products
|
$126.95
|
-0.15
-0.12% |
$128.42
|
907,864
106.56% of 50 DAV
50 DAV is 852,000
|
$130.65
-2.83%
|
8/31/2017
|
$128.22
|
PP = $127.78
|
|
MB = $134.17
|
Most Recent Note - 8/31/2017 5:31:19 PM
Y - Highlighted in yellow in the earlier mid-day report with a new pivot point cited based on its 7/26/17 high while trying to rally from a 12-week "double bottom" base pattern. Gains backed by at least +40% above average volume and a strong close above the pivot point may trigger a technical buy signal. Very little resistance remains due to overhead supply. Recently reported +115% earnings on +59% sales revenues for the Jun '17 quarter, its 3rd consecutive strong quarter above the +25% minimum guideline (C criteria), helping it better match with the fact-based investment system's fundamental guidelines. Annual earnings (A criteria) history has been strong. See the latest FSU analysis for additional gains and a new annotated graph.
>>> FEATURED STOCK ARTICLE : Rallied Near Pivot Point But Confirming Gains Are Still Needed - 8/31/2017 |
View all notes |
Set NEW NOTE alert |
Company Profile |
SEC
News |
Chart |
Request a new note
C
A
S
I |
VEEV
-
NYSE
Veeva Systems Inc Cl A
Computer Sftwr-Medical
|
$59.72
|
+0.22
0.37% |
$60.08
|
1,415,894
105.11% of 50 DAV
50 DAV is 1,347,000
|
$68.07
-12.27%
|
7/24/2017
|
$65.91
|
PP = $68.17
|
|
MB = $71.58
|
Most Recent Note - 9/1/2017 6:15:08 PM
G - Posted a 5th consecutive gain. Gapped down on 8/25/17 violating its 50 DMA line and undercutting prior lows triggering technical sell signals. A rebound above the 50 DMA line ($62.37) is needed for its outlook to improve. Fundamentals remain strong. See the latest FSU analysis for more details and a new annotated graph.
>>> FEATURED STOCK ARTICLE : Rebounding After gap Down Violated 50-Day Average and Prior Lows - 9/1/2017 |
View all notes |
Set NEW NOTE alert |
Company Profile |
SEC
News |
Chart |
Request a new note
C
A
S
I |
ANET
-
NYSE
Arista Networks Inc
TELECOMMUNICATIONS - Communication Equipment
|
$177.49
|
+1.34
0.76% |
$177.63
|
436,555
52.53% of 50 DAV
50 DAV is 831,000
|
$179.71
-1.24%
|
8/4/2017
|
$173.31
|
PP = $163.07
|
|
MB = $171.22
|
Most Recent Note - 8/30/2017 6:36:44 PM
G - Hit a new all-time high today. Stubbornly held its ground with recent volume totals cooling, a sign few investors are headed for the exit. Prior highs in the $162 area define initial support to watch above its 50 DMA line ($160). Fundamentals remain very strong.
>>> FEATURED STOCK ARTICLE : Gapped Up After Earnings Repairing 50-Day Moving Average Violation - 8/23/2017 |
View all notes |
Set NEW NOTE alert |
Company Profile |
SEC
News |
Chart |
Request a new note
C
A
S
I |
GRUB
-
NYSE
Grubhub Inc
COMPUTER SOFTWARE and SERVICES - Technical and System Software
|
$56.06
|
-1.03
-1.80% |
$57.28
|
1,224,601
65.31% of 50 DAV
50 DAV is 1,875,000
|
$57.26
-2.10%
|
6/21/2017
|
$47.33
|
PP = $46.94
|
|
MB = $49.29
|
Most Recent Note - 8/30/2017 6:31:59 PM
G - Posted a big gain today with below average volume for its second-best close ever. Stubbornly held its ground near its all-time high. Its 50 DMA line ($48.87) defines near-term support above prior highs in the $46-47 area. Recently reported earnings +13% on +32% sales revenues for the Jun '17 quarter, below the +25% minimum earnings guideline (C criteria) raising fundamental concerns.
>>> FEATURED STOCK ARTICLE : Spiked Into New High Territory Despite Sub Par Earnings News - 8/8/2017 |
View all notes |
Set NEW NOTE alert |
Company Profile |
SEC
News |
Chart |
Request a new note
C
A
S
I |
IBP
-
NYSE
Installed Building Prod
DIVERSIFIED SERVICES - Business/Management Services
|
$56.85
|
-0.85
-1.47% |
$57.96
|
100,831
90.84% of 50 DAV
50 DAV is 111,000
|
$60.00
-5.25%
|
6/13/2017
|
$54.25
|
PP = $55.55
|
|
MB = $58.33
|
Most Recent Note - 8/31/2017 2:45:42 PM
Y - Rebounding toward its 52-week high after testing support near its 50 DMA line ($54.33) and prior highs. More damaging losses would raise greater concerns.
>>> FEATURED STOCK ARTICLE : Consolidating Near Prior High Following Breakout - 8/18/2017 |
View all notes |
Set NEW NOTE alert |
Company Profile |
SEC
News |
Chart |
Request a new note
C
A
S
I |
Symbol/Exchange
Company Name
Industry Group |
PRICE |
CHANGE
(%Change) |
Day High |
Volume
(% DAV)
(% 50 day avg vol) |
52 Wk Hi
% From Hi |
Featured
Date |
Price
Featured |
Pivot Featured |
|
Max Buy |
NCOM
-
NASDAQ
National Commerce Corp
BANKING - Regional - Southeast Banks
|
$39.85
|
+0.10
0.25% |
$39.90
|
26,431
88.10% of 50 DAV
50 DAV is 30,000
|
$41.25
-3.39%
|
4/25/2017
|
$38.95
|
PP = $40.09
|
|
MB = $42.09
|
Most Recent Note - 8/31/2017 2:43:12 PM
G - Consolidating in a tight range near its 50 DMA line ($39.78). Recently reported Jun '17 earnings +23% on +45% sales revenues, below the +25% minimum earnings guideline (C criteria), raising fundamental concerns.
>>> FEATURED STOCK ARTICLE : Consolidating Near 50-day Moving Average Line - 8/16/2017 |
View all notes |
Set NEW NOTE alert |
Company Profile |
SEC
News |
Chart |
Request a new note
C
A
S
I |
OLLI
-
NASDAQ
Ollie's Bargain Outlet
Retail-DiscountandVariety
|
$42.70
|
+0.85
2.03% |
$43.00
|
512,979
73.92% of 50 DAV
50 DAV is 694,000
|
$46.08
-7.33%
|
7/17/2017
|
$43.96
|
PP = $44.18
|
|
MB = $46.39
|
Most Recent Note - 9/1/2017 6:17:33 PM
G - Quietly rebounded toward its 50 DMA line ($43.32) today, but it needs gains above that important short-term average for its outlook to improve. Reported earnings +29% on +21% sales revenues for the Jul '17 quarter, continuing its strong earnings track record. In recent weeks it failed to produce confirming gains above the latest pivot point backed by at least the minimum +40% above average volume necessary to trigger a proper new (or add-on) technical buy signal.
>>> FEATURED STOCK ARTICLE : Quietly Consolidating Above 50 Day Moving Average Near High - 8/10/2017 |
View all notes |
Set NEW NOTE alert |
Company Profile |
SEC
News |
Chart |
Request a new note
C
A
S
I |
HLI
-
NYSE
Houlihan Lokey Inc Cl A
Finance-Invest Bnk/Bkrs
|
$36.27
|
+0.22
0.61% |
$36.36
|
131,021
68.24% of 50 DAV
50 DAV is 192,000
|
$39.68
-8.59%
|
5/10/2017
|
$35.85
|
PP = $35.05
|
|
MB = $36.80
|
Most Recent Note - 8/29/2017 5:50:35 PM
Y - Volume was heavy behind today's small loss while still consolidating near its 50 DMA line ($35.98). Subsequent damaging losses below the recent low ($34.41 on 8/18/17) would raise serious concerns and trigger a technical sell signal. See the latest FSU analysis for more details and a new annotated graph.
>>> FEATURED STOCK ARTICLE : Consolidating Near 50-Day Moving Average - 8/29/2017 |
View all notes |
Set NEW NOTE alert |
Company Profile |
SEC
News |
Chart |
Request a new note
C
A
S
I |
|
|
|
THESE ARE NOT BUY RECOMMENDATIONS!
Comments contained in the body of this report are technical
opinions only. The material herein has been obtained
from sources believed to be reliable and accurate, however,
its accuracy and completeness cannot be guaranteed.
This site is not an investment advisor, hence it does
not endorse or recommend any securities or other investments.
Any recommendation contained in this report may not
be suitable for all investors and it is not to be deemed
an offer or solicitation on our part with respect to
the purchase or sale of any securities. All trademarks,
service marks and trade names appearing in this report
are the property of their respective owners, and are
likewise used for identification purposes only.
This report is a service available
only to active Paid Premium Members.
You may opt-out of receiving report notifications
at any time. Questions or comments may be submitted
by writing to Premium Membership Services 665 S.E. 10 Street, Suite 201 Deerfield Beach, FL 33441-5634 or by calling 1-800-965-8307
or 954-785-1121.
|
|
|