You are not logged in.
This means you
CAN ONLY VIEW reports that were published prior to Tuesday, April 8, 2025.
You
MUST UPGRADE YOUR MEMBERSHIP if you want to see any current reports.
AFTER MARKET UPDATE - WEDNESDAY, AUGUST 16TH, 2017
Previous After Market Report Next After Market Report >>>
|
|
|
|
DOW |
+25.88 |
22,024.87 |
+0.12% |
|
Volume |
730,947,080 |
+4% |
|
Volume |
1,796,082,888 |
+14% |
|
NASDAQ |
+12.10 |
6,345.11 |
+0.19% |
|
Advancers |
1,802 |
61% |
|
Advancers |
1,585 |
57% |
|
S&P 500 |
+3.50 |
2,468.11 |
+0.14% |
|
Decliners |
1,140 |
39% |
|
Decliners |
1,196 |
43% |
|
Russell 2000 |
+0.30 |
1,383.53 |
+0.02% |
|
52 Wk Highs |
80 |
|
|
52 Wk Highs |
56 |
|
|
S&P 600 |
+0.74 |
835.49 |
+0.09% |
|
52 Wk Lows |
95 |
|
|
52 Wk Lows |
86 |
|
|
 |
Major Indices Rose With Higher Volume and More Leadership
Kenneth J. Gruneisen - Passed the CAN SLIM® Master's Exam
Stocks finished higher on Wednesday. The Dow was up 25 points to 22024. The S&P 500 added 3 points to 2468 and the Nasdaq Composite gained 12 points to 6345. Volume totals reported were higher than the prior session totals on the NYSE and on the Nasdaq exchange. Breadth was positive as advancers led decliners by a 3-2 margin on the NYSE and 4-3 on the Nasdaq exchange. There were 39 high-ranked companies from the Leaders List that made new 52-week highs and were listed on the BreakOuts Page, versus the total of 31 on the prior session. New 52-week lows outnumbered new 52-week highs totals on both the NYSE and the Nasdaq exchange. The Featured Stocks Page provides the latest analysis on noteworthy high-ranked leaders. Charts used courtesy of www.stockcharts.com
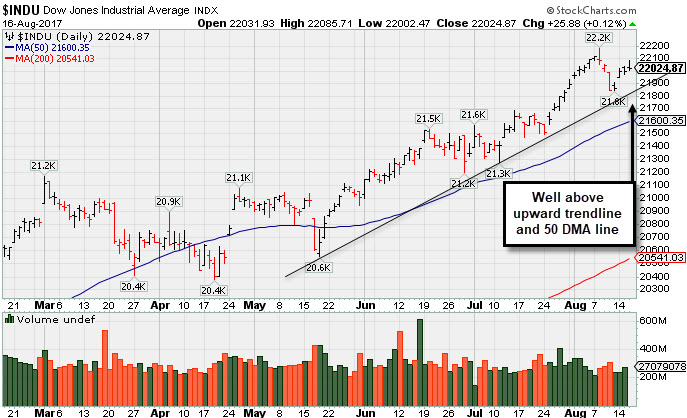
PICTURED: The Dow Jones Industrial Average is consolidating well above its upward trendline and its 50-day moving average (DMA) line.
The major averages' (M criteria) prior uptrend came under pressure while leadership thinned. Any sustainable rally requires hearty market leadership (a large number of high-ranked stocks hitting new highs). In weak markets investors should raise cash and reduce exposure to stocks by selling individual issues on a case-by-case basis as they trigger technical sell signals.
The major averages advanced Wednesday after the Federal Reserve released the minutes from its July FOMC meeting. The release showed Fed officials were divided on the timing of when to raise interest rates. Some policy makers urged caution in a low-inflation environment while more hawkish members expressed concern about risks arising from a labor market which had reached full employment. On the data front, housing starts fell 4.8% while building permits declined 4.1% in July.
Nine of 11 sectors in the S&P 500 ended in positive territory. Retailers rebounded on the session with Costco (COST +1.84%) up and Target (TGT +3.61%) rising as the company reported better-than-expected quarterly profit. Elsewhere in earnings, Agilent Technologies (A +4.65%) rose after quarterly revenue came in above forecasts. Urban Outfitters (URBN +17.48%) rallied as the apparel maker beat estimates on the top and bottom lines. In Health Care, Bristol-Myers Squibb (BMY -0.64%) edged lower amid mixed results in a cancer treatment drug trial. Teva Pharmaceutical (TEVA -2.67%) slid after being the subject of negative analyst commentary.
Treasuries advanced with the benchmark 10-year note up 11/32 to yield 2.23%. In commodities, NYMEX WTI crude slid 1.6% to $46.79/barrel. In FOREX, the Dollar Index fell 0.4%. |
 Kenneth J. Gruneisen started out as a licensed stockbroker in August 1987, a couple of months prior to the historic stock market crash that took the Dow Jones Industrial Average down -22.6% in a single day. He has published daily fact-based fundamental and technical analysis on high-ranked stocks online for two decades. Through FACTBASEDINVESTING.COM, Kenneth provides educational articles, news, market commentary, and other information regarding proven investment systems that work in good times and bad.
Comments contained in the body of this report are technical opinions only and are not necessarily those of Gruneisen Growth Corp. The material herein has been obtained from sources believed to be reliable and accurate, however, its accuracy and completeness cannot be guaranteed. Our firm, employees, and customers may effect transactions, including transactions contrary to any recommendation herein, or have positions in the securities mentioned herein or options with respect thereto. Any recommendation contained in this report may not be suitable for all investors and it is not to be deemed an offer or solicitation on our part with respect to the purchase or sale of any securities. |
|
 |
Gold & Silver and Retail Index Led Group Gainers
Kenneth J. Gruneisen - Passed the CAN SLIM® Master's Exam
On Wednesday the Bank Index ($BKX -0.36%) and the Broker/Dealer Index ($XBD -0.43%) both weighed on the major indices, meanwhile the Retail Index's ($RLX +0.73%) solid gain was a positive influence. The tech sector saw small gains from the Semiconductor Index ($SOX +0.15%) and the Networking Index ($NWX +0.31%), but the Biotechnology Index ($BTK +0.02%) finished flat. The Oil Services Index ($OSX -1.58%) and the Integrated Oil Index ($XOI -1.34%) both were to the downside, meanwhile the Gold & Silver Index ($XAU +2.90%) was a standout gainer. Charts courtesy www.stockcharts.com
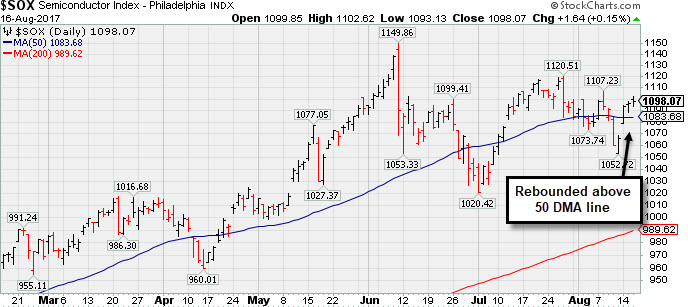 PICTURED: The Semiconductor Index ($SOX +0.15%) recently rebounded back above its 50-day moving average (DMA) line.
| Oil Services |
$OSX |
119.05 |
-1.92 |
-1.59% |
-35.22% |
| Integrated Oil |
$XOI |
1,095.56 |
-14.87 |
-1.34% |
-13.60% |
| Semiconductor |
$SOX |
1,098.07 |
+1.64 |
+0.15% |
+21.14% |
| Networking |
$NWX |
458.04 |
+1.40 |
+0.31% |
+2.68% |
| Broker/Dealer |
$XBD |
229.10 |
-1.00 |
-0.43% |
+11.60% |
| Retail |
$RLX |
1,475.67 |
+10.72 |
+0.73% |
+9.88% |
| Gold & Silver |
$XAU |
84.59 |
+2.38 |
+2.90% |
+7.27% |
| Bank |
$BKX |
95.23 |
-0.34 |
-0.36% |
+3.75% |
| Biotech |
$BTK |
3,867.90 |
+0.67 |
+0.02% |
+25.78% |
|
|
|
 |
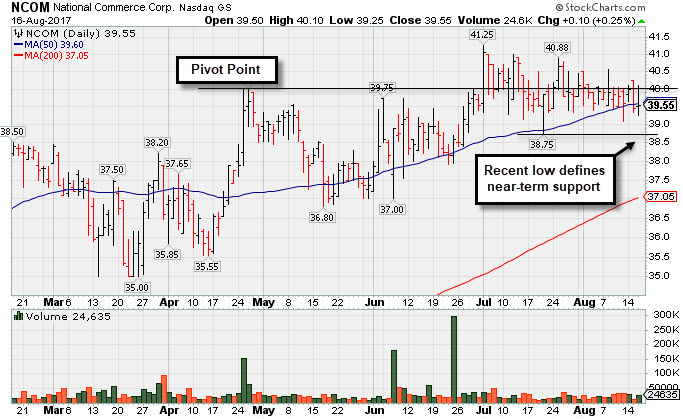
Consolidating Near 50-day Moving Average Line
Kenneth J. Gruneisen - Passed the CAN SLIM® Master's Exam
National Commerce Corp (NCOM +$0.10 or +0.25% to $39.55) has been consolidating in a tight trading range near its 50-day moving average (DMA) line ($39.60). Subsequent damaging losses violating the recent low ($38.75 on 7/20/17) would raise greater concerns and trigger a technical sell signal. Recently it reported Jun '17 earnings +23% on +45% sales revenues, raising fundamental concerns, ending its streak of 9 consecutive quarterly comparisons with earnings increasing above the +25% minimum guideline (C criteria). It annual earnings (A criteria) history has been strong. It is up from its $20 IPO on 3/19/15.
Gains above the pivot point should be backed by a minimum of +40% above average volume may trigger a proper technical buy signal. It stalled after hitting a new 52-week high with a gain backed by only average volume when last shown in this FSU section on 7/10/17 with an annotated graph under the headline, "Recent Breakout Lacked Great Volume Conviction." It was first highlighted in yellow in the 4/25/17 mid-day report with new pivot point cited based on its 1/27/17 high plus 10 cents (read here).
It has a Timeliness rating of B and a Sponsorship rating of B. The number of top-rated funds owning its shares rose from 94 in Jun '16 to 154 in Jun'17, a reassuring sign concerning the I criteria. Its current Up/Down Volume Ratio of 1.4 is an unbiased indication its shares have been under accumulation over the past 50 days. Its small supply of only 10.4 million shares (S criteria) can contribute to greater price volatility in the event of institutional buying or selling.
|
|
|
Color Codes Explained :
Y - Better candidates highlighted by our
staff of experts.
G - Previously featured
in past reports as yellow but may no longer be buyable under the
guidelines.
***Last / Change / Volume data in this table is the closing quote data***
Symbol/Exchange
Company Name
Industry Group |
PRICE |
CHANGE
(%Change) |
Day High |
Volume
(% DAV)
(% 50 day avg vol) |
52 Wk Hi
% From Hi |
Featured
Date |
Price
Featured |
Pivot Featured |
|
Max Buy |
THO
-
NYSE
Thor Industries Inc
AUTOMOTIVE - Recreational Vehicles
|
$105.75
|
+0.20
0.19% |
$105.93
|
418,914
62.34% of 50 DAV
50 DAV is 672,000
|
$115.74
-8.63%
|
8/14/2017
|
$106.67
|
PP = $110.01
|
|
MB = $115.51
|
Most Recent Note - 8/14/2017 9:10:01 PM
Y - Color code is changed to yellow with new pivot point cited based on its 6/28/17 high plus 10 cents. Rebounded above its 50 DMA line ($104.81) helping its technical stance improve. Subsequent volume-driven gains above the pivot point may trigger a new (or add-on) technical buy signal. Still faces some resistance due to overhead supply up through the $115 level.
>>> FEATURED STOCK ARTICLE : Still Faces Some Resistance Due to Overhead Supply - 7/20/2017 |
View all notes |
Set NEW NOTE alert |
Company Profile |
SEC
News |
Chart |
Request a new note
C
A
S
I |
BERY
-
NYSE
Berry Global Group Inc
CONSUMER NON-DURABLES - Packaging and Containers
|
$58.48
|
+0.44
0.76% |
$58.72
|
363,085
41.31% of 50 DAV
50 DAV is 879,000
|
$58.95
-0.80%
|
7/14/2017
|
$57.67
|
PP = $59.05
|
|
MB = $62.00
|
Most Recent Note - 8/14/2017 9:04:25 PM
G - Rebounded above its 50 DMA line ($57.47) and challenged its all-time high with today's quiet gain. Recent lows define near-term support. Reported Jun '17 quarterly earnings +13% on +16% sales revenues, below the +25% minimum earnings guideline (C criteria), raising fundamental concerns. See the latest FSU analysis for more details and a new annotated graph.
>>> FEATURED STOCK ARTICLE : Fundamental Concerns Yet Rebound Helped Technical Stance - 8/14/2017 |
View all notes |
Set NEW NOTE alert |
Company Profile |
SEC
News |
Chart |
Request a new note
C
A
S
I |
HSKA
-
NASDAQ
Heska Corporation
DRUGS - Biotechnology
|
$98.60
|
+0.93
0.95% |
$98.99
|
39,766
58.48% of 50 DAV
50 DAV is 68,000
|
$115.00
-14.26%
|
7/31/2017
|
$114.27
|
PP = $110.35
|
|
MB = $115.87
|
Most Recent Note - 8/14/2017 9:11:44 PM
G - Remains below its 50 DMA line ($99.56), and a rebound is needed for its outlook to improve. Encountering distributional pressure since highlighted in yellow in the 7/31/17 mid-day report with pivot point cited based on its high hit on 5/01/17 plus 10 cents. Failed to produce confirming gains since repeatedly noted - "Subsequent gains and a strong finish above its pivot point may clinch a convincing technical buy signal. Small supply of only 6 million shares in the public float (S criteria) can contribute to greater price volatility in the event of institutional buying or selling."
>>> FEATURED STOCK ARTICLE : Small Supply of Shares and Closed In Lower Half of Intra-day Range - 7/31/2017 |
View all notes |
Set NEW NOTE alert |
Company Profile |
SEC
News |
Chart |
Request a new note
C
A
S
I |
EW
-
NYSE
Edwards Lifesciences Cp
HEALTH SERVICES - Medical Appliances and Equipment
|
$115.57
|
+0.74
0.64% |
$115.93
|
939,129
78.85% of 50 DAV
50 DAV is 1,191,100
|
$121.75
-5.08%
|
7/11/2017
|
$117.23
|
PP = $121.85
|
|
MB = $127.94
|
Most Recent Note - 8/11/2017 5:59:13 PM
G - Perched within striking distance of its 52-week high but its Relative Strength Rating has slumped to 78, below the 80+ minimum guideline for buy candidates. Still lingering below its 50 DMA line ($116.91) which is now starting to slope downward. Fundamentals remain strong. Subsequent volume-driven gains for new highs may trigger a new (or add-on) technical buy signal which could mark the beginning of a new leg up.
>>> FEATURED STOCK ARTICLE : Near 50-Day Moving Average Line, Yet Not Far Off High - 8/7/2017 |
View all notes |
Set NEW NOTE alert |
Company Profile |
SEC
News |
Chart |
Request a new note
C
A
S
I |
STMP
-
NASDAQ
Stamps.com Inc
INTERNET - Internet Software and Services
|
$211.10
|
+0.15
0.07% |
$213.09
|
312,912
63.99% of 50 DAV
50 DAV is 489,000
|
$220.25
-4.15%
|
5/24/2017
|
$133.10
|
PP = $136.10
|
|
MB = $142.91
|
Most Recent Note - 8/11/2017 5:55:51 PM
G - Holding ground near its all-time high after getting very extended from any sound base. Its 50 DMA line and prior highs define important near-term support in the $156 area. Fundamentals remain strong. See the latest FSU analysis for more details and a new annotated graph.
>>> FEATURED STOCK ARTICLE : Blasted Higher After Latest Strong Earnings Report - 8/11/2017 |
View all notes |
Set NEW NOTE alert |
Company Profile |
SEC
News |
Chart |
Request a new note
C
A
S
I |
Symbol/Exchange
Company Name
Industry Group |
PRICE |
CHANGE
(%Change) |
Day High |
Volume
(% DAV)
(% 50 day avg vol) |
52 Wk Hi
% From Hi |
Featured
Date |
Price
Featured |
Pivot Featured |
|
Max Buy |
HTHT
-
NASDAQ
China Lodging Group Ads
LEISURE - Lodging
|
$99.80
|
+2.21
2.26% |
$100.81
|
374,148
140.66% of 50 DAV
50 DAV is 266,000
|
$107.17
-6.88%
|
9/29/2016
|
$46.12
|
PP = $47.82
|
|
MB = $50.21
|
 Most Recent Note - 8/16/2017 12:27:56 PM
G - Due to report earnings news on Thursday, 8/17/17 before the open. Volume and volatility often increase near earnings news. Encountering distributional pressure in recent weeks yet it remains perched near its all-time high, very extended from any sound base. Its 50 DMA line ($88.46) and prior highs in the $88 area define important near-term support.
>>> FEATURED STOCK ARTICLE : Extended From Sound Base With Earnings News Due Next Week - 8/9/2017 |
View all notes |
Set NEW NOTE alert |
Company Profile |
SEC
News |
Chart |
Request a new note
C
A
S
I |
LMAT
-
NASDAQ
Lemaitre Vascular Inc
Medical-Products
|
$34.66
|
-0.05
-0.14% |
$34.89
|
112,592
56.58% of 50 DAV
50 DAV is 199,000
|
$36.09
-3.96%
|
7/28/2017
|
$33.50
|
PP = $33.32
|
|
MB = $34.99
|
Most Recent Note - 8/14/2017 8:58:36 PM
Y - Finished at the session high today with a gain on lighter volume, rising back above its pivot point and avoiding a bad slump into the prior base. Prior highs in the $32-33 area were previously noted as initial support to watch. Disciplined investors avoid chasing extended stocks more than +5% above prior highs, and they always limit losses by selling any stock that falls more than -7% from their purchase price.
>>> FEATURED STOCK ARTICLE : Big Volume-Driven Gain Following Strong Earnings News - 7/28/2017 |
View all notes |
Set NEW NOTE alert |
Company Profile |
SEC
News |
Chart |
Request a new note
C
A
S
I |
BEAT
-
NASDAQ
BioTelemetry Inc
Medical-Services
|
$36.60
|
+0.05
0.14% |
$36.95
|
288,528
62.93% of 50 DAV
50 DAV is 458,500
|
$37.50
-2.40%
|
2/14/2017
|
$25.10
|
PP = $24.55
|
|
MB = $25.78
|
Most Recent Note - 8/14/2017 12:05:19 PM
G - Hitting a new all-time high today, but fundamental concerns remain. Jun '17 quarterly earnings rose +10% on +10% sales revenues, its 2nd consecutive quarterly comparison below the +25% minimum earnings guideline (C criteria). Its 50 DMA line ($26.63) defines near-term support along with prior lows.
>>> FEATURED STOCK ARTICLE : New Highs on Twice Average Volume; Fundamental Concerns Remain - 7/14/2017 |
View all notes |
Set NEW NOTE alert |
Company Profile |
SEC
News |
Chart |
Request a new note
C
A
S
I |
ESNT
-
NYSE
Essent Group Ltd
Finance-MrtgandRel Svc
|
$38.98
|
+0.21
0.54% |
$39.31
|
437,030
76.14% of 50 DAV
50 DAV is 574,000
|
$41.44
-5.94%
|
7/3/2017
|
$38.05
|
PP = $39.60
|
|
MB = $41.58
|
Most Recent Note - 8/14/2017 12:16:12 PM
Y - Gapped up today after a "positive reversal" on the prior session, finding prompt support near the 50 DMA line. Its 200 DMA line and prior lows define near-term support in the $34-35 area. Completed a new Public Offering on 8/08/17, pulling back after spiking to a new all-time high.
>>> FEATURED STOCK ARTICLE : Perched Within Close Striking Distance of a New High - 8/1/2017 |
View all notes |
Set NEW NOTE alert |
Company Profile |
SEC
News |
Chart |
Request a new note
C
A
S
I |
VEEV
-
NYSE
Veeva Systems Inc Cl A
Computer Sftwr-Medical
|
$63.77
|
+0.97
1.54% |
$63.94
|
1,002,146
73.90% of 50 DAV
50 DAV is 1,356,000
|
$68.07
-6.32%
|
7/24/2017
|
$65.91
|
PP = $68.17
|
|
MB = $71.58
|
Most Recent Note - 8/16/2017 5:08:12 PM
Y - Rebounded above its 50 DMA line ($62.52) helping its outlook improve and its color code is changed to yellow. Little resistance remains due to overhead supply up through the $68 level. Volume-driven gains above prior highs are still needed to trigger a new (or add-on) technical buy signal.
>>> FEATURED STOCK ARTICLE : Slump Below 50-Day Moving Average Line Raises Concerns - 8/2/2017 |
View all notes |
Set NEW NOTE alert |
Company Profile |
SEC
News |
Chart |
Request a new note
C
A
S
I |
Symbol/Exchange
Company Name
Industry Group |
PRICE |
CHANGE
(%Change) |
Day High |
Volume
(% DAV)
(% 50 day avg vol) |
52 Wk Hi
% From Hi |
Featured
Date |
Price
Featured |
Pivot Featured |
|
Max Buy |
ANET
-
NYSE
Arista Networks Inc
TELECOMMUNICATIONS - Communication Equipment
|
$173.67
|
+3.08
1.81% |
$174.88
|
847,147
98.39% of 50 DAV
50 DAV is 861,000
|
$176.50
-1.60%
|
8/4/2017
|
$173.31
|
PP = $163.07
|
|
MB = $171.22
|
Most Recent Note - 8/14/2017 9:01:16 PM
Y - Posted a gain today on below average volume, remaining below its "max buy" level. Prior highs in the $162 area define initial support to watch . Fundamentals remain strong.
>>> FEATURED STOCK ARTICLE : Networking Firm Consolidating Above 50-Day Moving Average Line - 7/18/2017 |
View all notes |
Set NEW NOTE alert |
Company Profile |
SEC
News |
Chart |
Request a new note
C
A
S
I |
GRUB
-
NYSE
Grubhub Inc
COMPUTER SOFTWARE and SERVICES - Technical and System Software
|
$54.65
|
+0.30
0.55% |
$55.68
|
899,216
42.92% of 50 DAV
50 DAV is 2,095,000
|
$57.26
-4.56%
|
6/21/2017
|
$47.33
|
PP = $46.94
|
|
MB = $49.29
|
Most Recent Note - 8/14/2017 9:05:50 PM
G - Perched near its all-time high, extended from the prior base after rallying well above its "max buy" level. Reported earnings +13% on +32% sales revenues for the Jun '17 quarter, below the +25% minimum earnings guideline (C criteria) raising fundamental concerns.
>>> FEATURED STOCK ARTICLE : Spiked Into New High Territory Despite Sub Par Earnings News - 8/8/2017 |
View all notes |
Set NEW NOTE alert |
Company Profile |
SEC
News |
Chart |
Request a new note
C
A
S
I |
IBP
-
NYSE
Installed Building Prod
DIVERSIFIED SERVICES - Business/Management Services
|
$58.45
|
-0.85
-1.43% |
$59.50
|
81,226
63.46% of 50 DAV
50 DAV is 128,000
|
$60.00
-2.58%
|
6/13/2017
|
$54.25
|
PP = $55.55
|
|
MB = $58.33
|
Most Recent Note - 8/14/2017 8:55:59 PM
G - Posted a gain on light volume for a new high close, rising above its "max buy" level. A big volume-driven gain on 8/04/17 triggered a technical buy signal. Fundamentals remain strong.
>>> FEATURED STOCK ARTICLE : Volume Cooling While Staying Above 50-Day Moving Average Line - 7/17/2017 |
View all notes |
Set NEW NOTE alert |
Company Profile |
SEC
News |
Chart |
Request a new note
C
A
S
I |
NCOM
-
NASDAQ
National Commerce Corp
BANKING - Regional - Southeast Banks
|
$39.55
|
+0.10
0.25% |
$40.10
|
24,635
74.65% of 50 DAV
50 DAV is 33,000
|
$41.25
-4.12%
|
4/25/2017
|
$38.95
|
PP = $40.09
|
|
MB = $42.09
|
Most Recent Note - 8/16/2017 5:10:12 PM
Y - Consolidating in a tight range near its 50 DMA line ($39.60). Subsequent damaging losses violating the recent low ($38.75 on 7/20/17) would trigger a worrisome technical sell signal. Reported Jun '17 earnings +23% on +45% sales revenues, below the +25% minimum earnings guideline (C criteria), raising fundamental concerns. See the latest FSU analysis for more details and a new annotated graph.
>>> FEATURED STOCK ARTICLE : Consolidating Near 50-day Moving Average Line - 8/16/2017 |
View all notes |
Set NEW NOTE alert |
Company Profile |
SEC
News |
Chart |
Request a new note
C
A
S
I |
HQY
-
NASDAQ
Healthequity Inc
COMPUTER SOFTWARE and SERVICES - Healthcare Information Service
|
$45.46
|
-1.19
-2.55% |
$47.30
|
519,516
100.68% of 50 DAV
50 DAV is 516,000
|
$54.95
-17.27%
|
6/7/2017
|
$50.01
|
PP = $49.35
|
|
MB = $51.82
|
Most Recent Note - 8/16/2017 5:12:46 PM
G - Encountering distributional pressure recently and testing its 200 DMA line ($44.69). A rebound above the 50 DMA line ($49.32) is needed for its outlook to improve. Faces some resistance due to overhead supply up through the $54 level.
>>> FEATURED STOCK ARTICLE : 50-Day Moving Average Violation Triggers Technical Sell Signal - 7/19/2017 |
View all notes |
Set NEW NOTE alert |
Company Profile |
SEC
News |
Chart |
Request a new note
C
A
S
I |
Symbol/Exchange
Company Name
Industry Group |
PRICE |
CHANGE
(%Change) |
Day High |
Volume
(% DAV)
(% 50 day avg vol) |
52 Wk Hi
% From Hi |
Featured
Date |
Price
Featured |
Pivot Featured |
|
Max Buy |
OLLI
-
NASDAQ
Ollie's Bargain Outlet
Retail-DiscountandVariety
|
$44.10
|
+0.45
1.03% |
$44.55
|
413,057
59.95% of 50 DAV
50 DAV is 689,000
|
$46.08
-4.29%
|
7/17/2017
|
$43.96
|
PP = $44.18
|
|
MB = $46.39
|
Most Recent Note - 8/16/2017 5:06:18 PM
Y - Perched within close striking distance of its 52-week high, quietly consolidating above support at its 50 DMA line ($42.87). Confirming gains and a strong close above the pivot point backed by at least +40% above average volume may trigger a new (or add-on) technical buy signal.
>>> FEATURED STOCK ARTICLE : Quietly Consolidating Above 50 Day Moving Average Near High - 8/10/2017 |
View all notes |
Set NEW NOTE alert |
Company Profile |
SEC
News |
Chart |
Request a new note
C
A
S
I |
MOMO
-
NASDAQ
Momo Inc.
INTERNET - Content
|
$44.12
|
-0.11
-0.25% |
$45.45
|
2,899,418
61.23% of 50 DAV
50 DAV is 4,735,500
|
$46.69
-5.50%
|
7/25/2017
|
$44.05
|
PP = $46.05
|
|
MB = $48.35
|
Most Recent Note - 8/14/2017 12:40:31 PM
Y - Gapped up today, finding prompt support at its 50 DMA line. Subsequent volume-driven gains for new highs may trigger a new (or add-on) technical buy signal. Its latest low ($40.50) defines important chart support where a violation would raise more serious concerns.
>>> FEATURED STOCK ARTICLE : Perched Within Striking Distance of Prior High - 7/25/2017 |
View all notes |
Set NEW NOTE alert |
Company Profile |
SEC
News |
Chart |
Request a new note
C
A
S
I |
HLI
-
NYSE
Houlihan Lokey Inc Cl A
Finance-Invest Bnk/Bkrs
|
$35.43
|
+0.03
0.08% |
$35.64
|
119,153
66.57% of 50 DAV
50 DAV is 179,000
|
$39.68
-10.71%
|
5/10/2017
|
$35.85
|
PP = $35.05
|
|
MB = $36.80
|
Most Recent Note - 8/14/2017 12:27:45 PM
Y - Rebounding above its 50 DMA line ($35.66) today helping its outlook improve and its color code is changed to yellow. More damaging losses below the recent low ($34.77 on 8/11/17) would raise serious concerns and trigger a technical sell signal.
>>> FEATURED STOCK ARTICLE : Extended Leader Encounters Distributional Pressure - 7/27/2017 |
View all notes |
Set NEW NOTE alert |
Company Profile |
SEC
News |
Chart |
Request a new note
C
A
S
I |
|
|
|
THESE ARE NOT BUY RECOMMENDATIONS!
Comments contained in the body of this report are technical
opinions only. The material herein has been obtained
from sources believed to be reliable and accurate, however,
its accuracy and completeness cannot be guaranteed.
This site is not an investment advisor, hence it does
not endorse or recommend any securities or other investments.
Any recommendation contained in this report may not
be suitable for all investors and it is not to be deemed
an offer or solicitation on our part with respect to
the purchase or sale of any securities. All trademarks,
service marks and trade names appearing in this report
are the property of their respective owners, and are
likewise used for identification purposes only.
This report is a service available
only to active Paid Premium Members.
You may opt-out of receiving report notifications
at any time. Questions or comments may be submitted
by writing to Premium Membership Services 665 S.E. 10 Street, Suite 201 Deerfield Beach, FL 33441-5634 or by calling 1-800-965-8307
or 954-785-1121.
|
|
|