You are not logged in.
This means you
CAN ONLY VIEW reports that were published prior to Thursday, March 20, 2025.
You
MUST UPGRADE YOUR MEMBERSHIP if you want to see any current reports.
AFTER MARKET UPDATE - FRIDAY, AUGUST 25TH, 2017
Previous After Market Report Next After Market Report >>>
|
|
|
|
DOW |
+30.27 |
21,813.67 |
+0.14% |
|
Volume |
663,377,240 |
-8% |
|
Volume |
1,436,039,007 |
-11% |
|
NASDAQ |
-5.69 |
6,265.64 |
-0.09% |
|
Advancers |
1,940 |
67% |
|
Advancers |
1,736 |
62% |
|
S&P 500 |
+4.08 |
2,443.05 |
+0.17% |
|
Decliners |
955 |
33% |
|
Decliners |
1,053 |
38% |
|
Russell 2000 |
+3.58 |
1,377.45 |
+0.26% |
|
52 Wk Highs |
108 |
|
|
52 Wk Highs |
79 |
|
|
S&P 600 |
+3.68 |
827.65 |
+0.45% |
|
52 Wk Lows |
18 |
|
|
52 Wk Lows |
32 |
|
|
 |
Indices Ended Mixed and Little Changed on Lighter Volume Totals
Kenneth J. Gruneisen - Passed the CAN SLIM® Master's Exam
Stocks closed mixed on Friday. The Dow was up 31 points to 21813. The S&P 500 added 4 points to 2445 and the Nasdaq Composite was off 5 points to 6265. Volume totals reported were lighter than the prior session total on the NYSE and on the Nasdaq exchange. Breadth was positive as advancers led decliners by a 2-1 margin on the NYSE and by an 8-5 margin on the Nasdaq exchange. There were 36 high-ranked companies from the Leaders List that made new 52-week highs and were listed on the BreakOuts Page, versus the total of 28 on the prior session. New 52-week highs outnumbered shrinking new 52-week lows totals on both the NYSE and the Nasdaq exchange. The Featured Stocks Page provides the latest analysis on noteworthy high-ranked leaders. Charts used courtesy of www.stockcharts.com
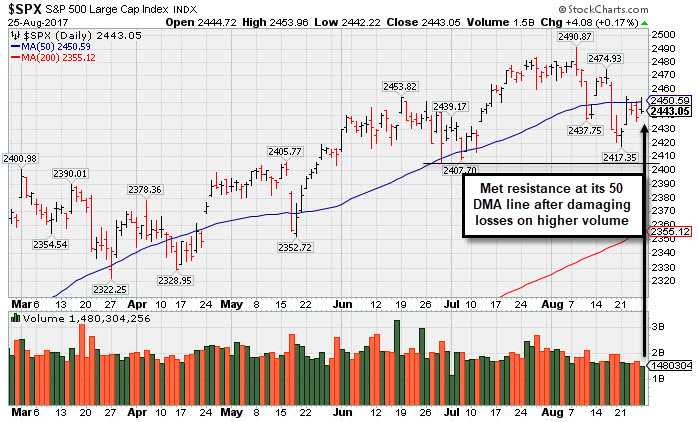 PICTURED: The S&P 500 Index met resistance at its 50-day moving average (DMA) line this week after damaging volume-driven losses. Recent lows define the important support to watch. The major averages' (M criteria) prior uptrend has been under pressure while leadership has been thinning. Investors should be ready to raise cash and reduce exposure to stocks by selling individual issues on a case-by-case basis as they trigger technical sell signals.
The major averages fluctuated on the session as investors weighed comments from Fed Chair Janet Yellen and European Central Bank President Mario Draghi. In Jackson Hole, Wyoming, Yellen mainly defended financial regulations set in place after the financial crisis. Meanwhile Draghi told symposium attendees that the global recovery is firming up. President Trump’s chief economic advisor Gary Cohn added to market momentum after saying he expects tax reform to get done this year.
Nine of 11 sectors in the S&P 500 Index finished in positive territory. Some Consumer Staple names rebounded from yesterday’s sell-off amid Amazon’s (AMZN -0.75%) plans to disrupt the broader grocery sub-sector. In response, Kroger (KR +3.03%) was a notable gainer. In earnings, software designer Autodesk (ADSK +3.94%) following a strong earnings report, which highlighted growing new product subscriptions. Elsewhere, Ulta Beauty (ULTA -9.14%) amid tepid earnings and increased competitive pressures.
Treasuries were mostly higher with the benchmark 10-year note up 6/32 to yield 2.17%. In commodities, NYMEX WTI crude rose 0.7% to $47.80/barrel as the U.S. petroleum industry braces for potential output disruptions from Hurricane Harvey. In FOREX, the U.S. Dollar index fell 0.5%, while the Euro hit a two-and-a-half year high against the greenback following Draghi’s comments on the global recovery. |
 Kenneth J. Gruneisen started out as a licensed stockbroker in August 1987, a couple of months prior to the historic stock market crash that took the Dow Jones Industrial Average down -22.6% in a single day. He has published daily fact-based fundamental and technical analysis on high-ranked stocks online for two decades. Through FACTBASEDINVESTING.COM, Kenneth provides educational articles, news, market commentary, and other information regarding proven investment systems that work in good times and bad.
Comments contained in the body of this report are technical opinions only and are not necessarily those of Gruneisen Growth Corp. The material herein has been obtained from sources believed to be reliable and accurate, however, its accuracy and completeness cannot be guaranteed. Our firm, employees, and customers may effect transactions, including transactions contrary to any recommendation herein, or have positions in the securities mentioned herein or options with respect thereto. Any recommendation contained in this report may not be suitable for all investors and it is not to be deemed an offer or solicitation on our part with respect to the purchase or sale of any securities. |
|
 |
Oil Services Index Posted Standout Gain
Kenneth J. Gruneisen - Passed the CAN SLIM® Master's Exam
On Friday the Broker/Dealer Index ($XBD +0.21%) posted a small gain yet it outpaced the little changed Bank Index ($BKX +0.05%) and the Retail Index ($RLX +0.09%). The tech sector was led by the Networking Index ($NWX +0.38%), meanwhile the Semiconductor Index ($SOX -0.50%) and the Biotechnology Index ($BTK -0.64%) both fell. The Oil Services Index ($OSX +1.85%) posted a standout gain rebounding from multi-year lows. Meanwhile the Integrated Oil Index ($XOI +0.38%) edged higher and the Gold & Silver Index ($XAU -0.36%) edged lower. Charts courtesy www.stockcharts.com
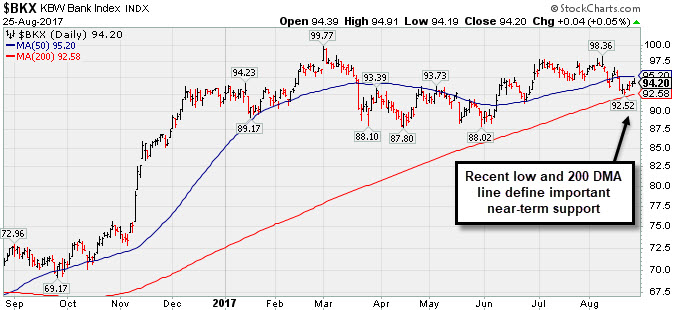 PICTURED: The Bank Index ($BKX +0.05%) recently and bounced at its 200-day moving average (DMA) line. More damaging losses would raise greater concerns.
| Oil Services |
$OSX |
121.97 |
+2.21 |
+1.85% |
-33.64% |
| Integrated Oil |
$XOI |
1,103.64 |
+4.14 |
+0.38% |
-12.96% |
| Semiconductor |
$SOX |
1,080.50 |
-5.43 |
-0.50% |
+19.20% |
| Networking |
$NWX |
457.50 |
+1.74 |
+0.38% |
+2.56% |
| Broker/Dealer |
$XBD |
226.93 |
+0.48 |
+0.21% |
+10.55% |
| Retail |
$RLX |
1,449.17 |
+1.35 |
+0.09% |
+7.91% |
| Gold & Silver |
$XAU |
85.82 |
-0.31 |
-0.36% |
+8.83% |
| Bank |
$BKX |
94.20 |
+0.05 |
+0.05% |
+2.63% |
| Biotech |
$BTK |
3,883.95 |
-25.12 |
-0.64% |
+26.31% |
|
|
|
 |
Pullback Followed Latest Strong Earnings Report From Tech Leader
Kenneth J. Gruneisen - Passed the CAN SLIM® Master's Exam
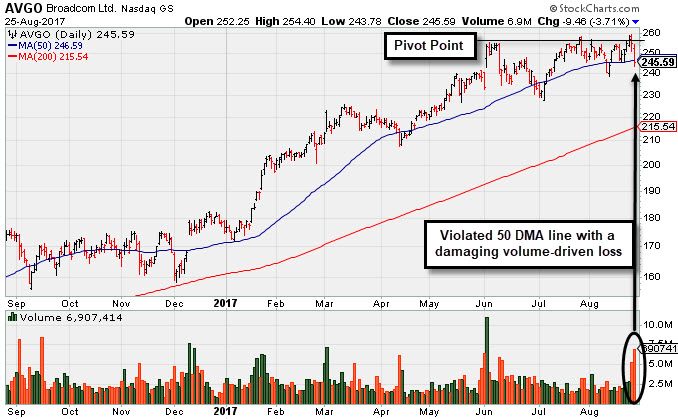
Broadcom Limited (AVGO -$9.46 or -3.71% to $245.59) pulled back with above average volume and violated its 50-day moving average (DMA) line ($246.59) today triggering a technical sell signal. The weak action came after it reported earnings +42% on +18% sales revenues for the Jul '17 quarter. Volume and volatility often increase near earnings news. Disciplined investors always watch for a proper technical buy signal before taking action. avoid chasing stocks more than +5% above prior highs, and strictly limit losses by selling any stock that falls more than -7% from their purchase price.
Note that AVGO failed to produce a technical buy signal after highlighted in yellow with pivot point cited based on its 6/05/17 high plus 10 cents as it was noted in the 8/24/17 mid-day report - "Subsequent volume-driven gains above the pivot and for new highs may trigger a technical buy signal. Prior quarterly and annual earnings history (C and A criteria) is a good match with the fact-based investment system's fundamental guidelines."
The Jul '17 quarter marked its 5th consecutive quarterly earnings increase above the +25% minimum guideline (C criteria). Earnings rose by +29%, +38%, +51%, +46%, and +42% in the Jul ,Oct '16, Jan, Apr, and Jul '17 quarterly comparisons versus the year ago periods. Sales revenues rose +119%, +125%, +134%, +18% and +18% during that time span. Its annual earnings (A criteria) history has been strong.
This Singapore-based Electronics - Semiconductor firm was mentioned in the 5/27/15 commentary (read here) on M&A news, as it combined with Avago Technologies Ltd, which was last shown in this FSU section on 6/18/15 under the headline, "Volume Totals Cooling During Consolidation After Breakout".
The number of top-rated funds owning its share rose from 2,095 in Sep '16 to 2,265 in Jun '17, a reassuring sign concerning the I criteria. Other leadership in the Semiconductor group has been a reassuring sign concerning the L criteria.
|
|
|
Color Codes Explained :
Y - Better candidates highlighted by our
staff of experts.
G - Previously featured
in past reports as yellow but may no longer be buyable under the
guidelines.
***Last / Change / Volume data in this table is the closing quote data***
Symbol/Exchange
Company Name
Industry Group |
PRICE |
CHANGE
(%Change) |
Day High |
Volume
(% DAV)
(% 50 day avg vol) |
52 Wk Hi
% From Hi |
Featured
Date |
Price
Featured |
Pivot Featured |
|
Max Buy |
THO
-
NYSE
Thor Industries Inc
AUTOMOTIVE - Recreational Vehicles
|
$103.59
|
+0.15
0.15% |
$104.34
|
347,745
71.85% of 50 DAV
50 DAV is 484,000
|
$115.74
-10.50%
|
8/14/2017
|
$106.67
|
PP = $110.01
|
|
MB = $115.51
|
Most Recent Note - 8/21/2017 5:55:27 PM
G - Still sputtering below its 50 DMA line ($105). A rebound above the 50 DMA line is needed for its outlook improve. Subsequent volume-driven gains above the pivot point may trigger a new (or add-on) technical buy signal. See the latest FSU analysis for more details and a new annotated graph.
>>> FEATURED STOCK ARTICLE : Slump Below 50-Day Average Hurt Technical Stance - 8/21/2017 |
View all notes |
Set NEW NOTE alert |
Company Profile |
SEC
News |
Chart |
Request a new note
C
A
S
I |
BERY
-
NYSE
Berry Plastics Group Inc
CONSUMER NON-DURABLES - Packaging and Containers
|
$56.90
|
+0.26
0.46% |
$57.05
|
685,370
80.29% of 50 DAV
50 DAV is 853,600
|
$58.95
-3.48%
|
7/14/2017
|
$57.67
|
PP = $59.05
|
|
MB = $62.00
|
Most Recent Note - 8/21/2017 6:02:19 PM
G - Slumped below its 50 DMA line ($57.45) with today's loss on lighter volume. The recent low defines important near-term support ($55.60 on 8/03/17). Reported Jun '17 quarterly earnings +13% on +16% sales revenues, below the +25% minimum earnings guideline (C criteria), raising fundamental concerns.
>>> FEATURED STOCK ARTICLE : Fundamental Concerns Yet Rebound Helped Technical Stance - 8/14/2017 |
View all notes |
Set NEW NOTE alert |
Company Profile |
SEC
News |
Chart |
Request a new note
C
A
S
I |
HSKA
-
NASDAQ
Heska Corporation
DRUGS - Biotechnology
|
$95.80
|
-3.22
-3.25% |
$99.30
|
31,541
47.79% of 50 DAV
50 DAV is 66,000
|
$115.00
-16.70%
|
7/31/2017
|
$114.27
|
PP = $110.35
|
|
MB = $115.87
|
Most Recent Note - 8/21/2017 6:07:50 PM
G - Rebounded near its 50 DMA line ($99.91) with today's gain on higher (near average) volume. Encountered distributional pressure since highlighted in yellow in the 7/31/17 mid-day report with pivot point cited based on its high hit on 5/01/17 plus 10 cents. Failed to produce confirming gains since repeatedly noted - "Subsequent gains and a strong finish above its pivot point may clinch a convincing technical buy signal. Small supply of only 6 million shares in the public float (S criteria) can contribute to greater price volatility in the event of institutional buying or selling."
>>> FEATURED STOCK ARTICLE : Small Supply of Shares and Closed In Lower Half of Intra-day Range - 7/31/2017 |
View all notes |
Set NEW NOTE alert |
Company Profile |
SEC
News |
Chart |
Request a new note
C
A
S
I |
AVGO
-
NASDAQ
Broadcom Limited
ELECTRONICS - Semiconductor - Broad Line
|
$245.59
|
-9.46
-3.71% |
$254.40
|
6,906,009
287.15% of 50 DAV
50 DAV is 2,405,000
|
$259.36
-5.31%
|
8/24/2017
|
$252.44
|
PP = $256.89
|
|
MB = $269.73
|
 Most Recent Note - 8/25/2017 6:10:35 PM
G - Color code is changed to green after it pulled back and closed below its 50 DMA line ($246.59) today raising concerns and triggering a technical sell signal. Reported earnings +42% on +18% sales revenues for the Jul '17 quarter. Volume and volatility often increase near earnings news. It was highlighted in the 8/24/17 mid-day report - "Subsequent volume-driven gains above the pivot and for new highs may trigger a technical buy signal. Prior quarterly and annual earnings history (C and A criteria) is a good match with the fact-based investment system's fundamental guidelines." See the latest FSU analysis for more details and a new annotated graph.
>>> FEATURED STOCK ARTICLE : Pullback Followed Latest Strong Earnings Report From Tech Leader - 8/25/2017 |
View all notes |
Set NEW NOTE alert |
Company Profile |
SEC
News |
Chart |
Request a new note
C
A
S
I |
EW
-
NYSE
Edwards Lifesciences Cp
HEALTH SERVICES - Medical Appliances and Equipment
|
$111.76
|
-0.99
-0.88% |
$113.40
|
1,206,386
99.36% of 50 DAV
50 DAV is 1,214,200
|
$121.75
-8.21%
|
7/11/2017
|
$117.23
|
PP = $121.85
|
|
MB = $127.94
|
Most Recent Note - 8/23/2017 1:04:26 PM
G - Sputtering yet still perched only -7.2% off its 52-week and all-time high. Relative Strength Rating has slumped to 77, below the 80+ minimum guideline for buy candidates. A rebound above its 50 DMA line ($116.53) is needed for its outlook to improve. Fundamentals remain strong.
>>> FEATURED STOCK ARTICLE : Near 50-Day Moving Average Line, Yet Not Far Off High - 8/7/2017 |
View all notes |
Set NEW NOTE alert |
Company Profile |
SEC
News |
Chart |
Request a new note
C
A
S
I |
Symbol/Exchange
Company Name
Industry Group |
PRICE |
CHANGE
(%Change) |
Day High |
Volume
(% DAV)
(% 50 day avg vol) |
52 Wk Hi
% From Hi |
Featured
Date |
Price
Featured |
Pivot Featured |
|
Max Buy |
STMP
-
NASDAQ
Stamps.com Inc
INTERNET - Internet Software and Services
|
$193.00
|
-1.90
-0.97% |
$197.00
|
365,113
75.75% of 50 DAV
50 DAV is 482,000
|
$220.25
-12.37%
|
5/24/2017
|
$133.10
|
PP = $136.10
|
|
MB = $142.91
|
Most Recent Note - 8/24/2017 6:27:39 PM
G - Slumped with higher volume today while retreating from its all-time high. It is very extended from any sound base. Its 50 DMA line ($167) and prior highs define important near-term support in the $156 area. Fundamentals remain strong.
>>> FEATURED STOCK ARTICLE : Blasted Higher After Latest Strong Earnings Report - 8/11/2017 |
View all notes |
Set NEW NOTE alert |
Company Profile |
SEC
News |
Chart |
Request a new note
C
A
S
I |
HTHT
-
NASDAQ
China Lodging Group Ads
LEISURE - Lodging
|
$110.20
|
-1.90
-1.69% |
$112.62
|
310,133
103.38% of 50 DAV
50 DAV is 300,000
|
$118.00
-6.61%
|
9/29/2016
|
$46.12
|
PP = $47.82
|
|
MB = $50.21
|
Most Recent Note - 8/23/2017 1:07:51 PM
G - Perched at its all-time high following volume-driven gains, very extended from any sound base. Last week it reported earnings +19% on +18% sales revenues for the Jun '17 quarter, below the +25% minimum earnings guideline (C criteria). Its 50 DMA line ($91.34) defines support above prior highs in the $88 area.
>>> FEATURED STOCK ARTICLE : Extended From Sound Base With Earnings News Due Next Week - 8/9/2017 |
View all notes |
Set NEW NOTE alert |
Company Profile |
SEC
News |
Chart |
Request a new note
C
A
S
I |
LMAT
-
NASDAQ
Lemaitre Vascular Inc
Medical-Products
|
$34.07
|
-0.14
-0.41% |
$34.41
|
174,526
87.26% of 50 DAV
50 DAV is 200,000
|
$36.09
-5.60%
|
7/28/2017
|
$33.50
|
PP = $33.32
|
|
MB = $34.99
|
Most Recent Note - 8/21/2017 6:10:25 PM
Y - Volume totals have been cooling since its breakout while stubbornly holding its ground above prior highs in the $32-33 area previously noted as initial support to watch. Disciplined investors avoid chasing extended stocks more than +5% above prior highs, and they always limit losses by selling any stock that falls more than -7% from their purchase price.
>>> FEATURED STOCK ARTICLE : Big Volume-Driven Gain Following Strong Earnings News - 7/28/2017 |
View all notes |
Set NEW NOTE alert |
Company Profile |
SEC
News |
Chart |
Request a new note
C
A
S
I |
BEAT
-
NASDAQ
BioTelemetry Inc
Medical-Services
|
$35.50
|
-0.30
-0.84% |
$36.40
|
200,916
46.44% of 50 DAV
50 DAV is 432,600
|
$37.50
-5.33%
|
2/14/2017
|
$25.10
|
PP = $24.55
|
|
MB = $25.78
|
Most Recent Note - 8/25/2017 2:21:30 PM
G - Consolidating near its 52-week high. Fundamental concerns remain. Jun '17 quarterly earnings rose +10% on +10% sales revenues, its 2nd consecutive quarterly comparison below the +25% minimum earnings guideline (C criteria). Its 50 DMA line ($33.65) defines near-term support along with prior lows.
>>> FEATURED STOCK ARTICLE : Technically Strong Despite Recent Fundamental Concerns - 8/17/2017 |
View all notes |
Set NEW NOTE alert |
Company Profile |
SEC
News |
Chart |
Request a new note
C
A
S
I |
ESNT
-
NYSE
Essent Group Ltd
Finance-MrtgandRel Svc
|
$38.40
|
-0.81
-2.07% |
$39.44
|
565,923
94.64% of 50 DAV
50 DAV is 598,000
|
$41.44
-7.34%
|
7/3/2017
|
$38.05
|
PP = $39.60
|
|
MB = $41.58
|
Most Recent Note - 8/23/2017 1:01:58 PM
Y - Today's volume-driven gain has it nearly challenging its prior high. Completed a new Public Offering on 8/08/17. Recently found prompt support near its 50 DMA line ($38). Its 200 DMA line and prior lows define the next important support in the $34-35 area.
>>> FEATURED STOCK ARTICLE : Perched Within Close Striking Distance of a New High - 8/1/2017 |
View all notes |
Set NEW NOTE alert |
Company Profile |
SEC
News |
Chart |
Request a new note
C
A
S
I |
Symbol/Exchange
Company Name
Industry Group |
PRICE |
CHANGE
(%Change) |
Day High |
Volume
(% DAV)
(% 50 day avg vol) |
52 Wk Hi
% From Hi |
Featured
Date |
Price
Featured |
Pivot Featured |
|
Max Buy |
VEEV
-
NYSE
Veeva Systems Inc Cl A
Computer Sftwr-Medical
|
$55.81
|
-8.78
-13.59% |
$59.80
|
7,729,674
653.95% of 50 DAV
50 DAV is 1,182,000
|
$68.07
-18.01%
|
7/24/2017
|
$65.91
|
PP = $68.17
|
|
MB = $71.58
|
Most Recent Note - 8/25/2017 2:17:54 PM
G - Reported Jul '17 earnings +53% on +27% sales revenues. Members were recently reminded, "Volume and volatility often increase near earnings news." Gapped down today violating its 50 DMA line and undercutting prior lows with a damaging volume-driven loss triggering technical sell signals and its color code is changed to green.
>>> FEATURED STOCK ARTICLE : Slump Below 50-Day Moving Average Line Raises Concerns - 8/2/2017 |
View all notes |
Set NEW NOTE alert |
Company Profile |
SEC
News |
Chart |
Request a new note
C
A
S
I |
ANET
-
NYSE
Arista Networks Inc
TELECOMMUNICATIONS - Communication Equipment
|
$173.73
|
-1.38
-0.79% |
$176.88
|
418,394
48.43% of 50 DAV
50 DAV is 864,000
|
$176.50
-1.57%
|
8/4/2017
|
$173.31
|
PP = $163.07
|
|
MB = $171.22
|
Most Recent Note - 8/23/2017 6:26:58 PM
G - Recently wedged above its "max buy" level with small gains lacking great volume conviction and its color code was changed to green. Prior highs in the $162 area define initial support to watch above its 50 DMA line ($158). Fundamentals remain strong. See the latest FSU analysis for more details and a new annotated graph.
>>> FEATURED STOCK ARTICLE : Gapped Up After Earnings Repairing 50-Day Moving Average Violation - 8/23/2017 |
View all notes |
Set NEW NOTE alert |
Company Profile |
SEC
News |
Chart |
Request a new note
C
A
S
I |
GRUB
-
NYSE
Grubhub Inc
COMPUTER SOFTWARE and SERVICES - Technical and System Software
|
$54.15
|
-0.38
-0.70% |
$54.93
|
732,416
36.77% of 50 DAV
50 DAV is 1,992,000
|
$57.26
-5.43%
|
6/21/2017
|
$47.33
|
PP = $46.94
|
|
MB = $49.29
|
Most Recent Note - 8/25/2017 2:23:48 PM
G - Volume totals have been cooling while stubbornly holding its ground near its all-time high. Prior highs and its 50 DMA line define near-term support in the $47-48 area. Recently reported earnings +13% on +32% sales revenues for the Jun '17 quarter, below the +25% minimum earnings guideline (C criteria) raising fundamental concerns.
>>> FEATURED STOCK ARTICLE : Spiked Into New High Territory Despite Sub Par Earnings News - 8/8/2017 |
View all notes |
Set NEW NOTE alert |
Company Profile |
SEC
News |
Chart |
Request a new note
C
A
S
I |
IBP
-
NYSE
Installed Building Prod
DIVERSIFIED SERVICES - Business/Management Services
|
$54.55
|
-0.30
-0.55% |
$55.05
|
102,372
92.23% of 50 DAV
50 DAV is 111,000
|
$60.00
-9.08%
|
6/13/2017
|
$54.25
|
PP = $55.55
|
|
MB = $58.33
|
Most Recent Note - 8/23/2017 6:29:00 PM
Y - Pulled back today with lighter volume, consolidating near prior highs in the $55 area defining initial support above its 50 DMA line ($54.17).
>>> FEATURED STOCK ARTICLE : Consolidating Near Prior High Following Breakout - 8/18/2017 |
View all notes |
Set NEW NOTE alert |
Company Profile |
SEC
News |
Chart |
Request a new note
C
A
S
I |
NCOM
-
NASDAQ
National Commerce Corp
BANKING - Regional - Southeast Banks
|
$39.90
|
-0.20
-0.50% |
$40.23
|
32,294
107.65% of 50 DAV
50 DAV is 30,000
|
$41.25
-3.27%
|
4/25/2017
|
$38.95
|
PP = $40.09
|
|
MB = $42.09
|
Most Recent Note - 8/25/2017 2:25:33 PM
G - Rebounded above its 50 DMA line ($39.70) this week, helping its technical stance and outlook improve. Reported Jun '17 earnings +23% on +45% sales revenues, below the +25% minimum earnings guideline (C criteria), raising fundamental concerns.
>>> FEATURED STOCK ARTICLE : Consolidating Near 50-day Moving Average Line - 8/16/2017 |
View all notes |
Set NEW NOTE alert |
Company Profile |
SEC
News |
Chart |
Request a new note
C
A
S
I |
Symbol/Exchange
Company Name
Industry Group |
PRICE |
CHANGE
(%Change) |
Day High |
Volume
(% DAV)
(% 50 day avg vol) |
52 Wk Hi
% From Hi |
Featured
Date |
Price
Featured |
Pivot Featured |
|
Max Buy |
OLLI
-
NASDAQ
Ollie's Bargain Outlet
Retail-DiscountandVariety
|
$43.70
|
+0.15
0.34% |
$44.00
|
838,207
125.48% of 50 DAV
50 DAV is 668,000
|
$46.08
-5.15%
|
7/17/2017
|
$43.96
|
PP = $44.18
|
|
MB = $46.39
|
Most Recent Note - 8/25/2017 2:28:58 PM
Y - Consolidating just above support at its 50 DMA line ($43.08) and recent low ($42.81 on 8/11/17). Due to release its financial results for the second quarter of fiscal 2017 on Tuesday, August 29, 2017 after the market close. Confirming gains and a strong close above the pivot point backed by at least +40% above average volume may trigger a new (or add-on) technical buy signal.
>>> FEATURED STOCK ARTICLE : Quietly Consolidating Above 50 Day Moving Average Near High - 8/10/2017 |
View all notes |
Set NEW NOTE alert |
Company Profile |
SEC
News |
Chart |
Request a new note
C
A
S
I |
MOMO
-
NASDAQ
Momo Inc Ads Cl A
INTERNET - Content
|
$35.59
|
-2.39
-6.29% |
$38.68
|
15,240,241
281.91% of 50 DAV
50 DAV is 5,406,000
|
$46.69
-23.77%
|
7/25/2017
|
$44.05
|
PP = $46.05
|
|
MB = $48.35
|
Most Recent Note - 8/25/2017 6:13:09 PM
Ended near the session low today with a big loss on above average volume. It will be dropped from the Featured Stocks list tonight. On 8/22/17 it violated its 50 DMA line triggering a technical sell signal with a damaging volume-driven loss and its color code was changed to green. Only a prompt rebound above the 50 DMA line would help its outlook improve. Reported earnings +192% on +215% sales revenues for the Jun '17 quarter versus the year ago period. Volume and volatility often increase near earnings news. See the latest FSU analysis for additional details and an annotated graph.
>>> FEATURED STOCK ARTICLE : Gap Down Violation of 50-Day Average Triggered Technical Sell Signal - 8/24/2017 |
View all notes |
Set NEW NOTE alert |
Company Profile |
SEC
News |
Chart |
Request a new note
C
A
S
I |
HLI
-
NYSE
Houlihan Lokey Inc Cl A
Finance-Invest Bnk/Bkrs
|
$36.21
|
+0.22
0.61% |
$36.24
|
150,748
84.22% of 50 DAV
50 DAV is 179,000
|
$39.68
-8.74%
|
5/10/2017
|
$35.85
|
PP = $35.05
|
|
MB = $36.80
|
Most Recent Note - 8/21/2017 6:06:27 PM
Y - Managed a positive reversal on the prior session, finding support while consolidating near its 50 DMA line ($35.84). Damaging losses below the recent low ($34.41 on 8/18/17) would raise serious concerns and trigger a technical sell signal.
>>> FEATURED STOCK ARTICLE : Extended Leader Encounters Distributional Pressure - 7/27/2017 |
View all notes |
Set NEW NOTE alert |
Company Profile |
SEC
News |
Chart |
Request a new note
C
A
S
I |
|
|
|
THESE ARE NOT BUY RECOMMENDATIONS!
Comments contained in the body of this report are technical
opinions only. The material herein has been obtained
from sources believed to be reliable and accurate, however,
its accuracy and completeness cannot be guaranteed.
This site is not an investment advisor, hence it does
not endorse or recommend any securities or other investments.
Any recommendation contained in this report may not
be suitable for all investors and it is not to be deemed
an offer or solicitation on our part with respect to
the purchase or sale of any securities. All trademarks,
service marks and trade names appearing in this report
are the property of their respective owners, and are
likewise used for identification purposes only.
This report is a service available
only to active Paid Premium Members.
You may opt-out of receiving report notifications
at any time. Questions or comments may be submitted
by writing to Premium Membership Services 665 S.E. 10 Street, Suite 201 Deerfield Beach, FL 33441-5634 or by calling 1-800-965-8307
or 954-785-1121.
|
|
|