You are not logged in.
This means you
CAN ONLY VIEW reports that were published prior to Thursday, March 20, 2025.
You
MUST UPGRADE YOUR MEMBERSHIP if you want to see any current reports.
AFTER MARKET UPDATE - MONDAY, AUGUST 28TH, 2017
Previous After Market Report Next After Market Report >>>
|
|
|
|
DOW |
-5.27 |
21,808.40 |
-0.02% |
|
Volume |
705,040,090 |
+6% |
|
Volume |
1,553,705,130 |
+8% |
|
NASDAQ |
+17.38 |
6,283.02 |
+0.28% |
|
Advancers |
1,385 |
47% |
|
Advancers |
1,410 |
49% |
|
S&P 500 |
+1.19 |
2,444.24 |
+0.05% |
|
Decliners |
1,545 |
53% |
|
Decliners |
1,452 |
51% |
|
Russell 2000 |
+4.78 |
1,382.23 |
+0.35% |
|
52 Wk Highs |
89 |
|
|
52 Wk Highs |
66 |
|
|
S&P 600 |
+0.49 |
828.14 |
+0.06% |
|
52 Wk Lows |
55 |
|
|
52 Wk Lows |
39 |
|
|
 |
Major Indices Ended Mixed and Little Changed
Kenneth J. Gruneisen - Passed the CAN SLIM® Master's Exam
Stocks finished mixed on light volume Monday. The Dow was off 5 points to 21808. The S&P 500 added 1 point to 2444 and the Nasdaq Composite gained 17 points to 6283. Volume totals reported were higher than the prior session totals on the NYSE and on the Nasdaq exchange. Breadth was nearly even but advancers very narrowly trailed decliners on the NYSE and on the Nasdaq exchange. There were 34 high-ranked companies from the Leaders List that made new 52-week highs and were listed on the BreakOuts Page, versus the total of 36 on the prior session. New 52-week highs outnumbered new 52-week lows totals on both the NYSE and the Nasdaq exchange. The Featured Stocks Page provides the latest analysis on noteworthy high-ranked leaders. Charts used courtesy of www.stockcharts.com
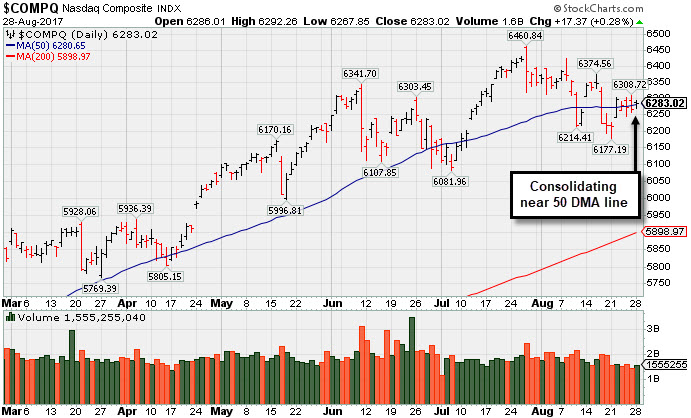 PICTURED: The Nasdaq Composite Index is consolidating near its 50-day moving average (DMA) line after damaging volume-driven losses. The recent low defines important near-term support to watch. The major averages' (M criteria) prior uptrend has been under pressure while leadership has been thinning. Investors should be ready to raise cash and reduce exposure to stocks by selling individual issues on a case-by-case basis as they trigger technical sell signals.
The major averages fluctuated as investors gauged the fallout from Hurricane Harvey and looked forward to a busy week of economic data. On the data front, a preliminary report showed that wholesale inventories rose 0.4% in July, above the expected 0.3% climb. A separate release showed that manufacturing activity in the Dallas Fed region increased slightly in August.
Six of 11 sectors in the S&P 500 finished in positive territory. Health Care and Technology stocks outperformed while Energy shares lagged. Financials also underperformed amid weakness in the insurance group. In M&A news, Kite Pharmaceuticals (KITE +28.00%) soared after Gilead Sciences (GILD +1.22%) announced it will purchase the company for $11.9 billion. Expedia (EXPE -4.51%) fell on news current CEO Dara Khosrowshahi is leaving to take the top job at Uber.
Treasuries were mixed with the curve steepening amid auctions of two and five-year paper. The benchmark 10-year note ended 2/32 higher to yield 2.16%. NYMEX WTI crude slipped 2.4% to $46.25/barrel while gasoline prices jumped 3.6% as traders assed the damage Hurricane Harvey has had on Houston. According to the Wall Street Journal, 15% of U.S. refining capacity was knocked offline this weekend. In FOREX the dollar traded near the lowest level since January 15 against the euro.
|
 Kenneth J. Gruneisen started out as a licensed stockbroker in August 1987, a couple of months prior to the historic stock market crash that took the Dow Jones Industrial Average down -22.6% in a single day. He has published daily fact-based fundamental and technical analysis on high-ranked stocks online for two decades. Through FACTBASEDINVESTING.COM, Kenneth provides educational articles, news, market commentary, and other information regarding proven investment systems that work in good times and bad.
Comments contained in the body of this report are technical opinions only and are not necessarily those of Gruneisen Growth Corp. The material herein has been obtained from sources believed to be reliable and accurate, however, its accuracy and completeness cannot be guaranteed. Our firm, employees, and customers may effect transactions, including transactions contrary to any recommendation herein, or have positions in the securities mentioned herein or options with respect thereto. Any recommendation contained in this report may not be suitable for all investors and it is not to be deemed an offer or solicitation on our part with respect to the purchase or sale of any securities. |
|
 |
Gold & Silver Index Posted Standout Gain
Kenneth J. Gruneisen - Passed the CAN SLIM® Master's Exam
On Monday the Broker/Dealer Index ($XBD -0.37%) and Bank Index ($BKX -0.55%) both created a drag on the major averages while the Retail Index ($RLX +0.08%) held its ground. The tech sector was led by the Biotechnology Index ($BTK +2.97%), and the Semiconductor Index ($SOX +0.20%) inched higher, but the Networking Index ($NWX -0.29%) edged lower. The Oil Services Index ($OSX -1.29%) fell and the Integrated Oil Index ($XOI -0.37%) also edged lower, meanwhile the Gold & Silver Index ($XAU +3.91%) was a standout gainer. Charts courtesy www.stockcharts.com
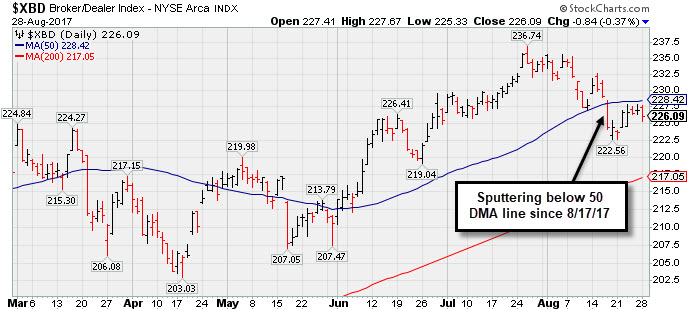 PICTURED: The Broker/Dealer Index ($XBD -0.37%) has recently been sputtering below its 50-day moving average (DMA) line. More damaging losses would raise greater concerns, but a subsequent rebound above the 50 DMA line would help the broader market outlook, since the financial indexes have a history of being reliable "leading indicators".
| Oil Services |
$OSX |
120.48 |
-1.49 |
-1.22% |
-34.45% |
| Integrated Oil |
$XOI |
1,099.61 |
-4.03 |
-0.37% |
-13.28% |
| Semiconductor |
$SOX |
1,082.62 |
+2.12 |
+0.20% |
+19.43% |
| Networking |
$NWX |
456.16 |
-1.35 |
-0.29% |
+2.25% |
| Broker/Dealer |
$XBD |
226.09 |
-0.84 |
-0.37% |
+10.14% |
| Retail |
$RLX |
1,450.36 |
+1.19 |
+0.08% |
+8.00% |
| Gold & Silver |
$XAU |
89.18 |
+3.36 |
+3.92% |
+13.09% |
| Bank |
$BKX |
93.68 |
-0.52 |
-0.55% |
+2.06% |
| Biotech |
$BTK |
3,999.44 |
+115.49 |
+2.97% |
+30.06% |
|
|
|
 |
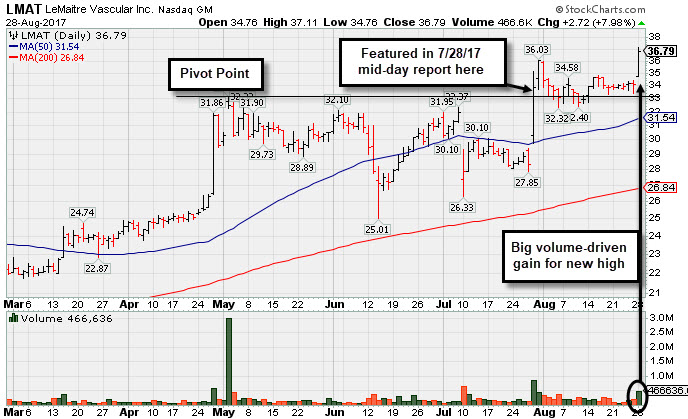
Volume-Driven Gain for New High And Strong Finish Bode Well
Kenneth J. Gruneisen - Passed the CAN SLIM® Master's Exam
Lemaitre Vascular Inc (LMAT +$2.72 or +7.98% to $36.79) gapped up today and rallied with +134% above average volume hitting another new all-time high after a brief consolidation. Its color code was changed to green after rising more than +5% above the previous pivot point cited. The finish in the upper third of its intra-day session range bodes very well for the near term, whereas a weak finish would have been an indication it was encountering prompt distributional pressure when hitting new highs.
Disciplined investors avoid chasing extended stocks more than +5% above prior highs, and they always limit losses by selling any stock that falls more than -7% from their purchase price. LMAT was highlighted in yellow in the 7/28/17 mid-day report (read here) with new pivot point cited based on its 5/02/17 high plus 10 cents. It triggered a technical buy signal as it powered to a new all-time high after gapping up for a big volume-driven gain following earnings news. It reported earnings +64% on +15% sales revenues for the Jun '17 quarter, Three of the past four quarterly comparisons were above the +25% minimum guideline (C criteria).
LMAT was last shown in this FSU section on 7/28/17 with an annotated graph under the headline, "Big Volume-Driven Gain Following Strong Earnings News". The high-ranked Medical - Products firm was first highlighted in yellow with a pivot point based on its 9/20/16 high plus 10 cents in the 10/27/16 mid-day report (read here).
Its current Up/Down Volume ratio of 1.2 is an unbiased indication that its shares were under some accumulation over the past 50 days. The number of top-rated funds owning its share rose from 184 in Dec '15 to 249 in Jun '17, a reassuring sign concerning the I criteria. Its small supply of 14.5 million shares (S criteria) in the public float can contribute to greater price volatility in the event of institutional buying or selling. |
|
|
Color Codes Explained :
Y - Better candidates highlighted by our
staff of experts.
G - Previously featured
in past reports as yellow but may no longer be buyable under the
guidelines.
***Last / Change / Volume data in this table is the closing quote data***
Symbol/Exchange
Company Name
Industry Group |
PRICE |
CHANGE
(%Change) |
Day High |
Volume
(% DAV)
(% 50 day avg vol) |
52 Wk Hi
% From Hi |
Featured
Date |
Price
Featured |
Pivot Featured |
|
Max Buy |
THO
-
NYSE
Thor Industries Inc
AUTOMOTIVE - Recreational Vehicles
|
$108.71
|
+5.12
4.94% |
$113.65
|
3,377,565
704.25% of 50 DAV
50 DAV is 479,600
|
$115.74
-6.07%
|
8/14/2017
|
$106.67
|
PP = $110.01
|
|
MB = $115.51
|
 Most Recent Note - 8/28/2017 1:38:51 PM
Y - Gapped up today rebounding above its 50 DMA line ($105) helping its technical stance and outlook improve and its color code is changed to yellow. Encountered distributional pressure after earlier gains lifted it above the previously cited pivot point and challenged its all-time high. A strong finish may help clinch a convincing new (or add-on) technical buy signal, however its current Relative Strength Rating of 79 is just below the 80+ minimum guideline for buy candidates under the fact-based investment system.
>>> FEATURED STOCK ARTICLE : Slump Below 50-Day Average Hurt Technical Stance - 8/21/2017 |
View all notes |
Set NEW NOTE alert |
Company Profile |
SEC
News |
Chart |
Request a new note
C
A
S
I |
BERY
-
NYSE
Berry Plastics Group Inc
CONSUMER NON-DURABLES - Packaging and Containers
|
$55.69
|
-1.21
-2.13% |
$57.14
|
871,924
102.05% of 50 DAV
50 DAV is 854,400
|
$58.95
-5.53%
|
7/14/2017
|
$57.67
|
PP = $59.05
|
|
MB = $62.00
|
Most Recent Note - 8/28/2017 6:08:56 PM
G - Testing the recent low that defines important near-term support ($55.60 on 8/03/17), it slumped further below its 50 DMA line ($57.35) today and finished near the session low with a loss on higher volume, raising concerns. Reported Jun '17 quarterly earnings +13% on +16% sales revenues, below the +25% minimum earnings guideline (C criteria), raising fundamental concerns.
>>> FEATURED STOCK ARTICLE : Fundamental Concerns Yet Rebound Helped Technical Stance - 8/14/2017 |
View all notes |
Set NEW NOTE alert |
Company Profile |
SEC
News |
Chart |
Request a new note
C
A
S
I |
HSKA
-
NASDAQ
Heska Corporation
DRUGS - Biotechnology
|
$97.68
|
+1.88
1.96% |
$97.99
|
39,620
60.95% of 50 DAV
50 DAV is 65,000
|
$115.00
-15.06%
|
7/31/2017
|
$114.27
|
PP = $110.35
|
|
MB = $115.87
|
Most Recent Note - 8/28/2017 6:11:36 PM
G - Sputtering below its 50 DMA line ($100.33) which recently acted as resistance when rebounding. Encountered distributional pressure since highlighted in yellow in the 7/31/17 mid-day report with pivot point cited based on its high hit on 5/01/17 plus 10 cents. Failed to produce confirming gains since repeatedly noted - "Subsequent gains and a strong finish above its pivot point may clinch a convincing technical buy signal. Small supply of only 6 million shares in the public float (S criteria) can contribute to greater price volatility in the event of institutional buying or selling."
>>> FEATURED STOCK ARTICLE : Small Supply of Shares and Closed In Lower Half of Intra-day Range - 7/31/2017 |
View all notes |
Set NEW NOTE alert |
Company Profile |
SEC
News |
Chart |
Request a new note
C
A
S
I |
AVGO
-
NASDAQ
Broadcom Limited
ELECTRONICS - Semiconductor - Broad Line
|
$243.25
|
-2.34
-0.95% |
$247.64
|
3,377,903
135.77% of 50 DAV
50 DAV is 2,488,000
|
$259.36
-6.21%
|
8/24/2017
|
$252.44
|
PP = $256.89
|
|
MB = $269.73
|
Most Recent Note - 8/25/2017 6:10:35 PM
G - Color code is changed to green after it pulled back and closed below its 50 DMA line ($246.59) today raising concerns and triggering a technical sell signal. Reported earnings +42% on +18% sales revenues for the Jul '17 quarter. Volume and volatility often increase near earnings news. It was highlighted in the 8/24/17 mid-day report - "Subsequent volume-driven gains above the pivot and for new highs may trigger a technical buy signal. Prior quarterly and annual earnings history (C and A criteria) is a good match with the fact-based investment system's fundamental guidelines." See the latest FSU analysis for more details and a new annotated graph.
>>> FEATURED STOCK ARTICLE : Pullback Followed Latest Strong Earnings Report From Tech Leader - 8/25/2017 |
View all notes |
Set NEW NOTE alert |
Company Profile |
SEC
News |
Chart |
Request a new note
C
A
S
I |
EW
-
NYSE
Edwards Lifesciences Cp
HEALTH SERVICES - Medical Appliances and Equipment
|
$113.11
|
+1.35
1.21% |
$113.45
|
1,045,807
85.62% of 50 DAV
50 DAV is 1,221,400
|
$121.75
-7.10%
|
7/11/2017
|
$117.23
|
PP = $121.85
|
|
MB = $127.94
|
Most Recent Note - 8/23/2017 1:04:26 PM
G - Sputtering yet still perched only -7.2% off its 52-week and all-time high. Relative Strength Rating has slumped to 77, below the 80+ minimum guideline for buy candidates. A rebound above its 50 DMA line ($116.53) is needed for its outlook to improve. Fundamentals remain strong.
>>> FEATURED STOCK ARTICLE : Near 50-Day Moving Average Line, Yet Not Far Off High - 8/7/2017 |
View all notes |
Set NEW NOTE alert |
Company Profile |
SEC
News |
Chart |
Request a new note
C
A
S
I |
Symbol/Exchange
Company Name
Industry Group |
PRICE |
CHANGE
(%Change) |
Day High |
Volume
(% DAV)
(% 50 day avg vol) |
52 Wk Hi
% From Hi |
Featured
Date |
Price
Featured |
Pivot Featured |
|
Max Buy |
STMP
-
NASDAQ
Stamps.com Inc
INTERNET - Internet Software and Services
|
$190.60
|
-2.40
-1.24% |
$194.00
|
407,772
84.42% of 50 DAV
50 DAV is 483,000
|
$220.25
-13.46%
|
5/24/2017
|
$133.10
|
PP = $136.10
|
|
MB = $142.91
|
Most Recent Note - 8/24/2017 6:27:39 PM
G - Slumped with higher volume today while retreating from its all-time high. It is very extended from any sound base. Its 50 DMA line ($167) and prior highs define important near-term support in the $156 area. Fundamentals remain strong.
>>> FEATURED STOCK ARTICLE : Blasted Higher After Latest Strong Earnings Report - 8/11/2017 |
View all notes |
Set NEW NOTE alert |
Company Profile |
SEC
News |
Chart |
Request a new note
C
A
S
I |
HTHT
-
NASDAQ
China Lodging Group Ads
LEISURE - Lodging
|
$106.31
|
-3.89
-3.53% |
$111.98
|
877,318
291.47% of 50 DAV
50 DAV is 301,000
|
$118.00
-9.91%
|
9/29/2016
|
$46.12
|
PP = $47.82
|
|
MB = $50.21
|
Most Recent Note - 8/28/2017 1:13:13 PM
G - Above average volume is behind today's 4th consecutive loss. Retreating from its all-time high after repeatedly noted - "Very extended from any sound base. Last week it reported earnings +19% on +18% sales revenues for the Jun '17 quarter, below the +25% minimum earnings guideline (C criteria). Its 50 DMA line ($91.34) defines support above prior highs in the $88 area."
>>> FEATURED STOCK ARTICLE : Extended From Sound Base With Earnings News Due Next Week - 8/9/2017 |
View all notes |
Set NEW NOTE alert |
Company Profile |
SEC
News |
Chart |
Request a new note
C
A
S
I |
LMAT
-
NASDAQ
Lemaitre Vascular Inc
Medical-Products
|
$36.79
|
+2.72
7.98% |
$37.11
|
460,836
231.58% of 50 DAV
50 DAV is 199,000
|
$36.09
1.94%
|
7/28/2017
|
$33.50
|
PP = $33.32
|
|
MB = $34.99
|
Most Recent Note - 8/28/2017 6:06:29 PM
G - Gapped up today hitting another new all-time high with a big gain backed by +134% above average volume after a brief consolidation. Color code was changed to green after rising more than +5% above the previous pivot point cited. See the latest FSU analysis for more details and a new annotated graph.
>>> FEATURED STOCK ARTICLE : Volume-Driven Gain for New High And Strong Finish Bode Well - 8/28/2017 |
View all notes |
Set NEW NOTE alert |
Company Profile |
SEC
News |
Chart |
Request a new note
C
A
S
I |
BEAT
-
NASDAQ
BioTelemetry Inc
Medical-Services
|
$36.25
|
+0.75
2.11% |
$36.30
|
258,687
60.16% of 50 DAV
50 DAV is 430,000
|
$37.50
-3.33%
|
2/14/2017
|
$25.10
|
PP = $24.55
|
|
MB = $25.78
|
Most Recent Note - 8/25/2017 2:21:30 PM
G - Consolidating near its 52-week high. Fundamental concerns remain. Jun '17 quarterly earnings rose +10% on +10% sales revenues, its 2nd consecutive quarterly comparison below the +25% minimum earnings guideline (C criteria). Its 50 DMA line ($33.65) defines near-term support along with prior lows.
>>> FEATURED STOCK ARTICLE : Technically Strong Despite Recent Fundamental Concerns - 8/17/2017 |
View all notes |
Set NEW NOTE alert |
Company Profile |
SEC
News |
Chart |
Request a new note
C
A
S
I |
ESNT
-
NYSE
Essent Group Ltd
Finance-MrtgandRel Svc
|
$38.13
|
-0.27
-0.70% |
$38.60
|
381,863
63.22% of 50 DAV
50 DAV is 604,000
|
$41.44
-7.99%
|
7/3/2017
|
$38.05
|
PP = $39.60
|
|
MB = $41.58
|
Most Recent Note - 8/23/2017 1:01:58 PM
Y - Today's volume-driven gain has it nearly challenging its prior high. Completed a new Public Offering on 8/08/17. Recently found prompt support near its 50 DMA line ($38). Its 200 DMA line and prior lows define the next important support in the $34-35 area.
>>> FEATURED STOCK ARTICLE : Perched Within Close Striking Distance of a New High - 8/1/2017 |
View all notes |
Set NEW NOTE alert |
Company Profile |
SEC
News |
Chart |
Request a new note
C
A
S
I |
Symbol/Exchange
Company Name
Industry Group |
PRICE |
CHANGE
(%Change) |
Day High |
Volume
(% DAV)
(% 50 day avg vol) |
52 Wk Hi
% From Hi |
Featured
Date |
Price
Featured |
Pivot Featured |
|
Max Buy |
VEEV
-
NYSE
Veeva Systems Inc Cl A
Computer Sftwr-Medical
|
$57.13
|
+1.32
2.37% |
$57.95
|
3,472,371
267.37% of 50 DAV
50 DAV is 1,298,700
|
$68.07
-16.07%
|
7/24/2017
|
$65.91
|
PP = $68.17
|
|
MB = $71.58
|
Most Recent Note - 8/28/2017 6:14:07 PM
G - Posted a solid gain with above average volume today. On the prior session it gapped down violating its 50 DMA line and undercutting prior lows with a damaging volume-driven loss triggering technical sell signals and its color code was changed to green. A prompt rebound above the 50 DMA line is needed for its outlook to improve. Reported Jul '17 earnings +53% on +27% sales revenues. Members were recently reminded, "Volume and volatility often increase near earnings news."
>>> FEATURED STOCK ARTICLE : Slump Below 50-Day Moving Average Line Raises Concerns - 8/2/2017 |
View all notes |
Set NEW NOTE alert |
Company Profile |
SEC
News |
Chart |
Request a new note
C
A
S
I |
ANET
-
NYSE
Arista Networks Inc
TELECOMMUNICATIONS - Communication Equipment
|
$174.11
|
+0.38
0.22% |
$175.76
|
523,471
60.80% of 50 DAV
50 DAV is 861,000
|
$176.88
-1.57%
|
8/4/2017
|
$173.31
|
PP = $163.07
|
|
MB = $171.22
|
Most Recent Note - 8/23/2017 6:26:58 PM
G - Recently wedged above its "max buy" level with small gains lacking great volume conviction and its color code was changed to green. Prior highs in the $162 area define initial support to watch above its 50 DMA line ($158). Fundamentals remain strong. See the latest FSU analysis for more details and a new annotated graph.
>>> FEATURED STOCK ARTICLE : Gapped Up After Earnings Repairing 50-Day Moving Average Violation - 8/23/2017 |
View all notes |
Set NEW NOTE alert |
Company Profile |
SEC
News |
Chart |
Request a new note
C
A
S
I |
GRUB
-
NYSE
Grubhub Inc
COMPUTER SOFTWARE and SERVICES - Technical and System Software
|
$54.13
|
-0.02
-0.04% |
$54.60
|
1,383,613
69.81% of 50 DAV
50 DAV is 1,982,000
|
$57.26
-5.47%
|
6/21/2017
|
$47.33
|
PP = $46.94
|
|
MB = $49.29
|
Most Recent Note - 8/25/2017 2:23:48 PM
G - Volume totals have been cooling while stubbornly holding its ground near its all-time high. Prior highs and its 50 DMA line define near-term support in the $47-48 area. Recently reported earnings +13% on +32% sales revenues for the Jun '17 quarter, below the +25% minimum earnings guideline (C criteria) raising fundamental concerns.
>>> FEATURED STOCK ARTICLE : Spiked Into New High Territory Despite Sub Par Earnings News - 8/8/2017 |
View all notes |
Set NEW NOTE alert |
Company Profile |
SEC
News |
Chart |
Request a new note
C
A
S
I |
IBP
-
NYSE
Installed Building Prod
DIVERSIFIED SERVICES - Business/Management Services
|
$54.30
|
-0.25
-0.46% |
$54.45
|
167,488
150.89% of 50 DAV
50 DAV is 111,000
|
$60.00
-9.50%
|
6/13/2017
|
$54.25
|
PP = $55.55
|
|
MB = $58.33
|
Most Recent Note - 8/23/2017 6:29:00 PM
Y - Pulled back today with lighter volume, consolidating near prior highs in the $55 area defining initial support above its 50 DMA line ($54.17).
>>> FEATURED STOCK ARTICLE : Consolidating Near Prior High Following Breakout - 8/18/2017 |
View all notes |
Set NEW NOTE alert |
Company Profile |
SEC
News |
Chart |
Request a new note
C
A
S
I |
NCOM
-
NASDAQ
National Commerce Corp
BANKING - Regional - Southeast Banks
|
$39.70
|
-0.20
-0.50% |
$39.95
|
18,253
60.84% of 50 DAV
50 DAV is 30,000
|
$41.25
-3.76%
|
4/25/2017
|
$38.95
|
PP = $40.09
|
|
MB = $42.09
|
Most Recent Note - 8/25/2017 2:25:33 PM
G - Rebounded above its 50 DMA line ($39.70) this week, helping its technical stance and outlook improve. Reported Jun '17 earnings +23% on +45% sales revenues, below the +25% minimum earnings guideline (C criteria), raising fundamental concerns.
>>> FEATURED STOCK ARTICLE : Consolidating Near 50-day Moving Average Line - 8/16/2017 |
View all notes |
Set NEW NOTE alert |
Company Profile |
SEC
News |
Chart |
Request a new note
C
A
S
I |
Symbol/Exchange
Company Name
Industry Group |
PRICE |
CHANGE
(%Change) |
Day High |
Volume
(% DAV)
(% 50 day avg vol) |
52 Wk Hi
% From Hi |
Featured
Date |
Price
Featured |
Pivot Featured |
|
Max Buy |
OLLI
-
NASDAQ
Ollie's Bargain Outlet
Retail-DiscountandVariety
|
$43.85
|
+0.15
0.34% |
$44.13
|
868,345
128.64% of 50 DAV
50 DAV is 675,000
|
$46.08
-4.83%
|
7/17/2017
|
$43.96
|
PP = $44.18
|
|
MB = $46.39
|
Most Recent Note - 8/25/2017 2:28:58 PM
Y - Consolidating just above support at its 50 DMA line ($43.08) and recent low ($42.81 on 8/11/17). Due to release its financial results for the second quarter of fiscal 2017 on Tuesday, August 29, 2017 after the market close. Confirming gains and a strong close above the pivot point backed by at least +40% above average volume may trigger a new (or add-on) technical buy signal.
>>> FEATURED STOCK ARTICLE : Quietly Consolidating Above 50 Day Moving Average Near High - 8/10/2017 |
View all notes |
Set NEW NOTE alert |
Company Profile |
SEC
News |
Chart |
Request a new note
C
A
S
I |
HLI
-
NYSE
Houlihan Lokey Inc Cl A
Finance-Invest Bnk/Bkrs
|
$36.14
|
-0.07
-0.19% |
$36.36
|
745,695
416.59% of 50 DAV
50 DAV is 179,000
|
$39.68
-8.92%
|
5/10/2017
|
$35.85
|
PP = $35.05
|
|
MB = $36.80
|
Most Recent Note - 8/28/2017 6:10:29 PM
Y - Volume was heavy behind today's small loss while still consolidating near its 50 DMA line ($35.98). Subsequent damaging losses below the recent low ($34.41 on 8/18/17) would raise serious concerns and trigger a technical sell signal.
>>> FEATURED STOCK ARTICLE : Extended Leader Encounters Distributional Pressure - 7/27/2017 |
View all notes |
Set NEW NOTE alert |
Company Profile |
SEC
News |
Chart |
Request a new note
C
A
S
I |
|
|
|
THESE ARE NOT BUY RECOMMENDATIONS!
Comments contained in the body of this report are technical
opinions only. The material herein has been obtained
from sources believed to be reliable and accurate, however,
its accuracy and completeness cannot be guaranteed.
This site is not an investment advisor, hence it does
not endorse or recommend any securities or other investments.
Any recommendation contained in this report may not
be suitable for all investors and it is not to be deemed
an offer or solicitation on our part with respect to
the purchase or sale of any securities. All trademarks,
service marks and trade names appearing in this report
are the property of their respective owners, and are
likewise used for identification purposes only.
This report is a service available
only to active Paid Premium Members.
You may opt-out of receiving report notifications
at any time. Questions or comments may be submitted
by writing to Premium Membership Services 665 S.E. 10 Street, Suite 201 Deerfield Beach, FL 33441-5634 or by calling 1-800-965-8307
or 954-785-1121.
|
|
|