You are not logged in.
This means you
CAN ONLY VIEW reports that were published prior to Thursday, March 20, 2025.
You
MUST UPGRADE YOUR MEMBERSHIP if you want to see any current reports.
AFTER MARKET UPDATE - FRIDAY, AUGUST 18TH, 2017
Previous After Market Report Next After Market Report >>>
|
|
|
|
DOW |
-76.22 |
21,674.51 |
-0.35% |
|
Volume |
924,590,340 |
+21% |
|
Volume |
1,965,284,791 |
-3% |
|
NASDAQ |
-5.38 |
6,216.53 |
-0.09% |
|
Advancers |
1,513 |
53% |
|
Advancers |
1,449 |
51% |
|
S&P 500 |
-4.46 |
2,425.55 |
-0.18% |
|
Decliners |
1,360 |
47% |
|
Decliners |
1,381 |
49% |
|
Russell 2000 |
-1.15 |
1,357.79 |
-0.08% |
|
52 Wk Highs |
36 |
|
|
52 Wk Highs |
27 |
|
|
S&P 600 |
-1.45 |
818.38 |
-0.18% |
|
52 Wk Lows |
163 |
|
|
52 Wk Lows |
119 |
|
|
 |
Leadership Thinned as Major Indices Slumped
Kenneth J. Gruneisen - Passed the CAN SLIM® Master's Exam
For the week, the Dow was down 0.8%, the S&P 500 lost 0.6% and the Nasdaq Composite fell 0.6%. Stocks finished lower on Friday. The Dow was down 76 points to 21674, slumping near its 50-day moving average (DMA) line. The S&P 500 lost 4 points to 2425 and the Nasdaq Composite fell 5 points to 6216, both indices slumped below their respective 50-day moving average (DMA) lines. Volume totals reported were mixed, higher than the prior session total on the NYSE and lower on the Nasdaq exchange. Breadth was slightly positive as advancers led decliners by a narrow margin on the NYSE and on the Nasdaq exchange. There were 11 high-ranked companies from the Leaders List that made new 52-week highs and were listed on the BreakOuts Page, versus the total of 17 on the prior session. New 52-week lows totals solidly outnumbered shrinking new 52-week highs totals on both the NYSE and the Nasdaq exchange. The Featured Stocks Page provides the latest analysis on noteworthy high-ranked leaders. Charts used courtesy of www.stockcharts.com
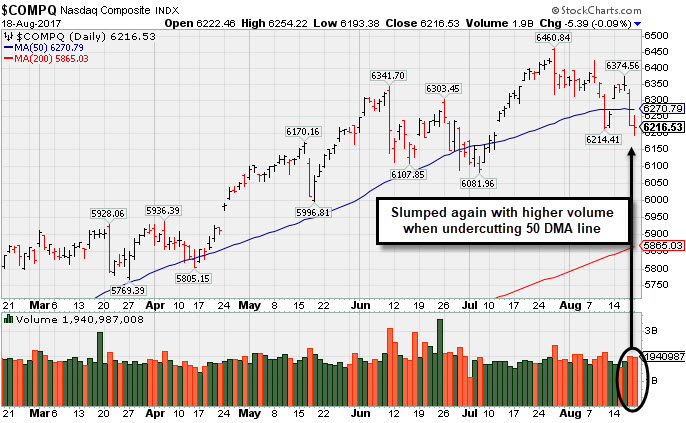
PICTURED: The Nasdaq Composite Index slumped again with higher volume when undercutting its 50-day moving average (DMA) line. The major averages' (M criteria) prior uptrend is under pressure while leadership has been thinning. Investors should be ready to raise cash and reduce exposure to stocks by selling individual issues on a case-by-case basis as they trigger technical sell signals.
The major averages declined on the session Friday as investors digested an update on the political front. U.S. equities briefly pared early losses and turned higher Friday after Steve Bannon, one of President Donald Trump's top advisors, left the administration. In economic news, the University of Michigan preliminary report on consumer sentiment for August came in at 97.6. Overseas, European shares retreated after a suspected terrorist attack in Barcelona, Spain left 14 people dead.
Eight of 11 sectors in the S&P 500 ended in negative territory. Industrials finished lower with Deere & Co (DE -5.38%) lower after quarterly revenue came in below expectations. Retail stocks underperformed with Foot Locker (FL -27.92%) plunging. Shares of Nike (NKE -4.4%) fell in sympathy with the news. Elsewhere in the consumer space, Estee Lauder (EL +7.73%) rose as the cosmetics maker reported better-than-expected quarterly profit. Ross Stores (ROST +10.67%) rose after posting comparable-store sales that firmly beat analysts’ estimates. In Technology, Applied Materials (AMAT +2.74%) rose as the company provided strong current-quarter guidance.
Treasuries edged lower with the benchmark 10-year note down 2/32 to yield 2.19%. In commodities, NYMEX WTI crude added 3.2% to $48.61/barrel. In FOREX, the Dollar Index fell 0.2%. |
 Kenneth J. Gruneisen started out as a licensed stockbroker in August 1987, a couple of months prior to the historic stock market crash that took the Dow Jones Industrial Average down -22.6% in a single day. He has published daily fact-based fundamental and technical analysis on high-ranked stocks online for two decades. Through FACTBASEDINVESTING.COM, Kenneth provides educational articles, news, market commentary, and other information regarding proven investment systems that work in good times and bad.
Comments contained in the body of this report are technical opinions only and are not necessarily those of Gruneisen Growth Corp. The material herein has been obtained from sources believed to be reliable and accurate, however, its accuracy and completeness cannot be guaranteed. Our firm, employees, and customers may effect transactions, including transactions contrary to any recommendation herein, or have positions in the securities mentioned herein or options with respect thereto. Any recommendation contained in this report may not be suitable for all investors and it is not to be deemed an offer or solicitation on our part with respect to the purchase or sale of any securities. |
|
 |
Retail Index Fell; Energy-Linked Groups Led Gainers
Kenneth J. Gruneisen - Passed the CAN SLIM® Master's Exam
On Friday the Bank Index ($BKX +0.02%) and the Broker/Dealer Index ($XBD +0.01%) both finished flat, but the weak Retail Index ($RLX -0.40%) weighed on the major indices. The tech sector was mixed as the Semiconductor Index ($SOX +0.20%) edged higher but both the Networking Index ($NWX -0.13%) and the Biotechnology Index ($BTK -0.30%) fell slightly. The Oil Services Index ($OSX +1.39%) and the Integrated Oil Index ($XOI +0.70%) both posted solid gains, meanwhile the Gold & Silver Index ($XAU -0.48%) finished to the downside. Charts courtesy www.stockcharts.com
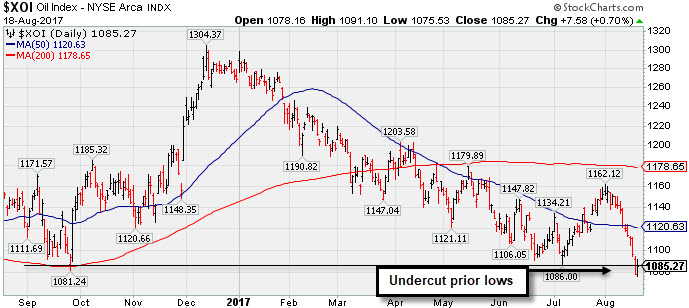 PICTURED: The Integrated Oil Index ($XOI +0.70%) undercut its prior lows with Thursday's big loss, then rebounded on Friday's session.
| Oil Services |
$OSX |
119.42 |
+1.63 |
+1.38% |
-35.02% |
| Integrated Oil |
$XOI |
1,085.27 |
+7.58 |
+0.70% |
-14.41% |
| Semiconductor |
$SOX |
1,071.89 |
+2.19 |
+0.20% |
+18.25% |
| Networking |
$NWX |
449.76 |
-0.57 |
-0.13% |
+0.82% |
| Broker/Dealer |
$XBD |
224.42 |
+0.02 |
+0.01% |
+9.32% |
| Retail |
$RLX |
1,445.35 |
-5.75 |
-0.40% |
+7.62% |
| Gold & Silver |
$XAU |
83.90 |
-0.41 |
-0.49% |
+6.39% |
| Bank |
$BKX |
93.24 |
+0.02 |
+0.02% |
+1.58% |
| Biotech |
$BTK |
3,787.17 |
-11.34 |
-0.30% |
+23.16% |
|
|
|
 |
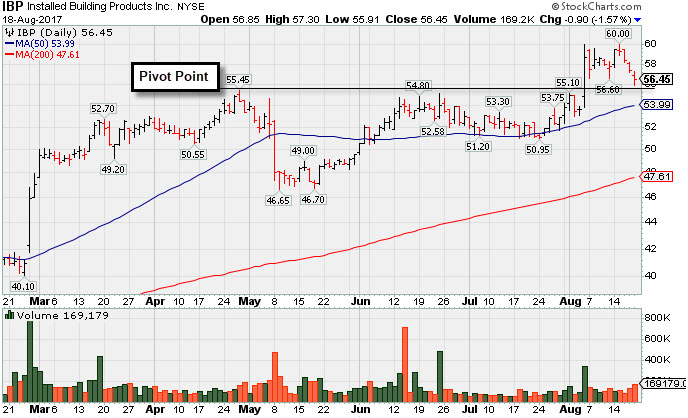
Consolidating Near Prior High Following Breakout
Kenneth J. Gruneisen - Passed the CAN SLIM® Master's Exam
Installed Building Products' (IBP -$0.90 or -1.57% to $56.45) slumped back below its "max buy" level. Prior highs define initial support after its big volume-driven gain on 8/04/17 triggered a technical buy signal.
Fundamentals remain strong after reporting earnings +48% on +33% sales revenues for the Jun '17 quarter. The 3 latest quarterly comparisons had earnings increases well above the +25% minimum guideline (C criteria). Its annual earnings (A criteria) history has been strong since its $11 IPO on 2/13/14.
The high-ranked Building - Maintenance & Service firm has seen the number of top-rated funds owning its shares rose from 226 in Mar '16 to 286 in Jun '17, a reassuring sign concerning the I criteria. Its small supply of only 31.9 million shares outstanding (S criteria) can contribute to greater price volatility in the event of institutional buying or selling. It currently has a Timeliness Rating of A and a Sponsorship Rating of B.
|
|
|
Color Codes Explained :
Y - Better candidates highlighted by our
staff of experts.
G - Previously featured
in past reports as yellow but may no longer be buyable under the
guidelines.
***Last / Change / Volume data in this table is the closing quote data***
Symbol/Exchange
Company Name
Industry Group |
PRICE |
CHANGE
(%Change) |
Day High |
Volume
(% DAV)
(% 50 day avg vol) |
52 Wk Hi
% From Hi |
Featured
Date |
Price
Featured |
Pivot Featured |
|
Max Buy |
THO
-
NYSE
Thor Industries Inc
AUTOMOTIVE - Recreational Vehicles
|
$102.73
|
+0.14
0.14% |
$103.12
|
326,309
59.05% of 50 DAV
50 DAV is 552,600
|
$115.74
-11.24%
|
8/14/2017
|
$106.67
|
PP = $110.01
|
|
MB = $115.51
|
Most Recent Note - 8/17/2017 3:40:26 PM
G - Color code is changed to green after slumping below its 50 DMA line ($105). Only a prompt rebound above the 50 DMA line would help its outlook improve. Subsequent volume-driven gains above the pivot point may trigger a new (or add-on) technical buy signal. Faces resistance due to overhead supply up through the $115 level.
>>> FEATURED STOCK ARTICLE : Still Faces Some Resistance Due to Overhead Supply - 7/20/2017 |
View all notes |
Set NEW NOTE alert |
Company Profile |
SEC
News |
Chart |
Request a new note
C
A
S
I |
BERY
-
NYSE
Berry Global Group Inc
CONSUMER NON-DURABLES - Packaging and Containers
|
$57.82
|
-0.45
-0.77% |
$58.22
|
937,545
107.52% of 50 DAV
50 DAV is 872,000
|
$58.95
-1.92%
|
7/14/2017
|
$57.67
|
PP = $59.05
|
|
MB = $62.00
|
Most Recent Note - 8/14/2017 9:04:25 PM
G - Rebounded above its 50 DMA line ($57.47) and challenged its all-time high with today's quiet gain. Recent lows define near-term support. Reported Jun '17 quarterly earnings +13% on +16% sales revenues, below the +25% minimum earnings guideline (C criteria), raising fundamental concerns. See the latest FSU analysis for more details and a new annotated graph.
>>> FEATURED STOCK ARTICLE : Fundamental Concerns Yet Rebound Helped Technical Stance - 8/14/2017 |
View all notes |
Set NEW NOTE alert |
Company Profile |
SEC
News |
Chart |
Request a new note
C
A
S
I |
HSKA
-
NASDAQ
Heska Corporation
DRUGS - Biotechnology
|
$97.79
|
-0.80
-0.81% |
$98.02
|
46,078
68.77% of 50 DAV
50 DAV is 67,000
|
$115.00
-14.97%
|
7/31/2017
|
$114.27
|
PP = $110.35
|
|
MB = $115.87
|
Most Recent Note - 8/14/2017 9:11:44 PM
G - Remains below its 50 DMA line ($99.56), and a rebound is needed for its outlook to improve. Encountering distributional pressure since highlighted in yellow in the 7/31/17 mid-day report with pivot point cited based on its high hit on 5/01/17 plus 10 cents. Failed to produce confirming gains since repeatedly noted - "Subsequent gains and a strong finish above its pivot point may clinch a convincing technical buy signal. Small supply of only 6 million shares in the public float (S criteria) can contribute to greater price volatility in the event of institutional buying or selling."
>>> FEATURED STOCK ARTICLE : Small Supply of Shares and Closed In Lower Half of Intra-day Range - 7/31/2017 |
View all notes |
Set NEW NOTE alert |
Company Profile |
SEC
News |
Chart |
Request a new note
C
A
S
I |
EW
-
NYSE
Edwards Lifesciences Cp
HEALTH SERVICES - Medical Appliances and Equipment
|
$113.11
|
-0.46
-0.41% |
$113.61
|
1,111,783
92.94% of 50 DAV
50 DAV is 1,196,300
|
$121.75
-7.10%
|
7/11/2017
|
$117.23
|
PP = $121.85
|
|
MB = $127.94
|
Most Recent Note - 8/17/2017 11:17:34 AM
G - Perched only -5.6% off its 52-week and all-time high. Relative Strength Rating has slumped to 77, below the 80+ minimum guideline for buy candidates. A rebound above its 50 DMA line ($116.74) is needed for its outlook to improve. Fundamentals remain strong.
>>> FEATURED STOCK ARTICLE : Near 50-Day Moving Average Line, Yet Not Far Off High - 8/7/2017 |
View all notes |
Set NEW NOTE alert |
Company Profile |
SEC
News |
Chart |
Request a new note
C
A
S
I |
STMP
-
NASDAQ
Stamps.com Inc
INTERNET - Internet Software and Services
|
$210.35
|
+1.50
0.72% |
$211.45
|
322,284
65.77% of 50 DAV
50 DAV is 490,000
|
$220.25
-4.49%
|
5/24/2017
|
$133.10
|
PP = $136.10
|
|
MB = $142.91
|
Most Recent Note - 8/17/2017 11:21:15 AM
G - Still stubbornly holding ground near its all-time high, extended from any sound base. Its 50 DMA line ($161) and prior highs define important near-term support in the $156 area. Fundamentals remain strong.
>>> FEATURED STOCK ARTICLE : Blasted Higher After Latest Strong Earnings Report - 8/11/2017 |
View all notes |
Set NEW NOTE alert |
Company Profile |
SEC
News |
Chart |
Request a new note
C
A
S
I |
Symbol/Exchange
Company Name
Industry Group |
PRICE |
CHANGE
(%Change) |
Day High |
Volume
(% DAV)
(% 50 day avg vol) |
52 Wk Hi
% From Hi |
Featured
Date |
Price
Featured |
Pivot Featured |
|
Max Buy |
HTHT
-
NASDAQ
China Lodging Group Ads
LEISURE - Lodging
|
$108.79
|
-0.60
-0.55% |
$110.76
|
368,973
129.46% of 50 DAV
50 DAV is 285,000
|
$110.72
-1.74%
|
9/29/2016
|
$46.12
|
PP = $47.82
|
|
MB = $50.21
|
 Most Recent Note - 8/18/2017 1:20:51 PM
G - Gapped up on the prior session and it is perched at its all-time high, very extended from any sound base. Reported earnings +19% on +18% sales revenues for the Jun '17 quarter, below the +25% minimum earnings guideline (C criteria). Volume and volatility often increase near earnings news. Its 50 DMA line coincides with prior highs in the $88 area defining very important near-term support.
>>> FEATURED STOCK ARTICLE : Extended From Sound Base With Earnings News Due Next Week - 8/9/2017 |
View all notes |
Set NEW NOTE alert |
Company Profile |
SEC
News |
Chart |
Request a new note
C
A
S
I |
LMAT
-
NASDAQ
Lemaitre Vascular Inc
Medical-Products
|
$33.96
|
-0.15
-0.44% |
$34.05
|
223,875
109.74% of 50 DAV
50 DAV is 204,000
|
$36.09
-5.90%
|
7/28/2017
|
$33.50
|
PP = $33.32
|
|
MB = $34.99
|
Most Recent Note - 8/14/2017 8:58:36 PM
Y - Finished at the session high today with a gain on lighter volume, rising back above its pivot point and avoiding a bad slump into the prior base. Prior highs in the $32-33 area were previously noted as initial support to watch. Disciplined investors avoid chasing extended stocks more than +5% above prior highs, and they always limit losses by selling any stock that falls more than -7% from their purchase price.
>>> FEATURED STOCK ARTICLE : Big Volume-Driven Gain Following Strong Earnings News - 7/28/2017 |
View all notes |
Set NEW NOTE alert |
Company Profile |
SEC
News |
Chart |
Request a new note
C
A
S
I |
BEAT
-
NASDAQ
BioTelemetry Inc
Medical-Services
|
$35.70
|
-0.05
-0.14% |
$35.80
|
517,047
113.96% of 50 DAV
50 DAV is 453,700
|
$37.50
-4.80%
|
2/14/2017
|
$25.10
|
PP = $24.55
|
|
MB = $25.78
|
Most Recent Note - 8/17/2017 5:53:05 PM
G - Retreating from its all-time high. Fundamental concerns remain. Jun '17 quarterly earnings rose +10% on +10% sales revenues, its 2nd consecutive quarterly comparison below the +25% minimum earnings guideline (C criteria). Its 50 DMA line ($32.88) defines near-term support along with prior lows. See the latest FSU analysis for more details and a new annotated graph.
>>> FEATURED STOCK ARTICLE : Technically Strong Despite Recent Fundamental Concerns - 8/17/2017 |
View all notes |
Set NEW NOTE alert |
Company Profile |
SEC
News |
Chart |
Request a new note
C
A
S
I |
ESNT
-
NYSE
Essent Group Ltd
Finance-MrtgandRel Svc
|
$37.87
|
-0.55
-1.43% |
$38.45
|
664,702
116.82% of 50 DAV
50 DAV is 569,000
|
$41.44
-8.61%
|
7/3/2017
|
$38.05
|
PP = $39.60
|
|
MB = $41.58
|
Most Recent Note - 8/14/2017 12:16:12 PM
Y - Gapped up today after a "positive reversal" on the prior session, finding prompt support near the 50 DMA line. Its 200 DMA line and prior lows define near-term support in the $34-35 area. Completed a new Public Offering on 8/08/17, pulling back after spiking to a new all-time high.
>>> FEATURED STOCK ARTICLE : Perched Within Close Striking Distance of a New High - 8/1/2017 |
View all notes |
Set NEW NOTE alert |
Company Profile |
SEC
News |
Chart |
Request a new note
C
A
S
I |
VEEV
-
NYSE
Veeva Systems Inc Cl A
Computer Sftwr-Medical
|
$63.12
|
-0.27
-0.43% |
$63.78
|
729,049
55.48% of 50 DAV
50 DAV is 1,314,000
|
$68.07
-7.27%
|
7/24/2017
|
$65.91
|
PP = $68.17
|
|
MB = $71.58
|
Most Recent Note - 8/16/2017 5:08:12 PM
Y - Rebounded above its 50 DMA line ($62.52) helping its outlook improve and its color code is changed to yellow. Little resistance remains due to overhead supply up through the $68 level. Volume-driven gains above prior highs are still needed to trigger a new (or add-on) technical buy signal.
>>> FEATURED STOCK ARTICLE : Slump Below 50-Day Moving Average Line Raises Concerns - 8/2/2017 |
View all notes |
Set NEW NOTE alert |
Company Profile |
SEC
News |
Chart |
Request a new note
C
A
S
I |
Symbol/Exchange
Company Name
Industry Group |
PRICE |
CHANGE
(%Change) |
Day High |
Volume
(% DAV)
(% 50 day avg vol) |
52 Wk Hi
% From Hi |
Featured
Date |
Price
Featured |
Pivot Featured |
|
Max Buy |
ANET
-
NYSE
Arista Networks Inc
TELECOMMUNICATIONS - Communication Equipment
|
$172.01
|
+0.95
0.56% |
$174.11
|
651,027
74.92% of 50 DAV
50 DAV is 869,000
|
$176.50
-2.54%
|
8/4/2017
|
$173.31
|
PP = $163.07
|
|
MB = $171.22
|
Most Recent Note - 8/14/2017 9:01:16 PM
Y - Posted a gain today on below average volume, remaining below its "max buy" level. Prior highs in the $162 area define initial support to watch . Fundamentals remain strong.
>>> FEATURED STOCK ARTICLE : Networking Firm Consolidating Above 50-Day Moving Average Line - 7/18/2017 |
View all notes |
Set NEW NOTE alert |
Company Profile |
SEC
News |
Chart |
Request a new note
C
A
S
I |
GRUB
-
NYSE
Grubhub Inc
COMPUTER SOFTWARE and SERVICES - Technical and System Software
|
$53.87
|
+0.31
0.58% |
$54.10
|
1,080,950
51.99% of 50 DAV
50 DAV is 2,079,000
|
$57.26
-5.92%
|
6/21/2017
|
$47.33
|
PP = $46.94
|
|
MB = $49.29
|
Most Recent Note - 8/17/2017 5:57:22 PM
G - Pulling back from its all-time high after getting very extended from any sound base. Prior highs and its 50 DMA line define near-term support in the $47-48 area. Recently reported earnings +13% on +32% sales revenues for the Jun '17 quarter, below the +25% minimum earnings guideline (C criteria) raising fundamental concerns.
>>> FEATURED STOCK ARTICLE : Spiked Into New High Territory Despite Sub Par Earnings News - 8/8/2017 |
View all notes |
Set NEW NOTE alert |
Company Profile |
SEC
News |
Chart |
Request a new note
C
A
S
I |
IBP
-
NYSE
Installed Building Prod
DIVERSIFIED SERVICES - Business/Management Services
|
$56.45
|
-0.90
-1.57% |
$57.30
|
168,507
132.68% of 50 DAV
50 DAV is 127,000
|
$60.00
-5.92%
|
6/13/2017
|
$54.25
|
PP = $55.55
|
|
MB = $58.33
|
Most Recent Note - 8/18/2017 5:36:01 PM
Y - Pulled back below its "max buy" level and its color code is changed to yellow. Prior highs in the $55 area define initial support after a big volume-driven gain on 8/04/17 triggered a technical buy signal. See the latest FSU analysis for more details and a new annotated graph.
>>> FEATURED STOCK ARTICLE : Consolidating Near Prior High Following Breakout - 8/18/2017 |
View all notes |
Set NEW NOTE alert |
Company Profile |
SEC
News |
Chart |
Request a new note
C
A
S
I |
NCOM
-
NASDAQ
National Commerce Corp
BANKING - Regional - Southeast Banks
|
$39.05
|
+0.65
1.69% |
$39.35
|
39,006
125.83% of 50 DAV
50 DAV is 31,000
|
$41.25
-5.33%
|
4/25/2017
|
$38.95
|
PP = $40.09
|
|
MB = $42.09
|
Most Recent Note - 8/17/2017 12:11:58 PM
G - Slumped further below its 50 DMA line ($39.60) and its color code was changed to green. Early weakness undercut the recent low ($38.75 on 7/20/17) raising concerns and triggering a more worrisome technical sell signal. Reported Jun '17 earnings +23% on +45% sales revenues, below the +25% minimum earnings guideline (C criteria), raising fundamental concerns. See the latest FSU analysis for more details and an annotated graph.
>>> FEATURED STOCK ARTICLE : Consolidating Near 50-day Moving Average Line - 8/16/2017 |
View all notes |
Set NEW NOTE alert |
Company Profile |
SEC
News |
Chart |
Request a new note
C
A
S
I |
OLLI
-
NASDAQ
Ollie's Bargain Outlet
Retail-DiscountandVariety
|
$44.35
|
+1.20
2.78% |
$44.50
|
503,875
73.77% of 50 DAV
50 DAV is 683,000
|
$46.08
-3.74%
|
7/17/2017
|
$43.96
|
PP = $44.18
|
|
MB = $46.39
|
Most Recent Note - 8/18/2017 5:37:21 PM
Y - Consolidating above support at its 50 DMA line ($42.91). Confirming gains and a strong close above the pivot point backed by at least +40% above average volume may trigger a new (or add-on) technical buy signal.
>>> FEATURED STOCK ARTICLE : Quietly Consolidating Above 50 Day Moving Average Near High - 8/10/2017 |
View all notes |
Set NEW NOTE alert |
Company Profile |
SEC
News |
Chart |
Request a new note
C
A
S
I |
Symbol/Exchange
Company Name
Industry Group |
PRICE |
CHANGE
(%Change) |
Day High |
Volume
(% DAV)
(% 50 day avg vol) |
52 Wk Hi
% From Hi |
Featured
Date |
Price
Featured |
Pivot Featured |
|
Max Buy |
MOMO
-
NASDAQ
Momo Inc.
INTERNET - Content
|
$43.82
|
-0.19
-0.43% |
$44.79
|
4,236,568
93.32% of 50 DAV
50 DAV is 4,539,900
|
$46.69
-6.15%
|
7/25/2017
|
$44.05
|
PP = $46.05
|
|
MB = $48.35
|
Most Recent Note - 8/14/2017 12:40:31 PM
Y - Gapped up today, finding prompt support at its 50 DMA line. Subsequent volume-driven gains for new highs may trigger a new (or add-on) technical buy signal. Its latest low ($40.50) defines important chart support where a violation would raise more serious concerns.
>>> FEATURED STOCK ARTICLE : Perched Within Striking Distance of Prior High - 7/25/2017 |
View all notes |
Set NEW NOTE alert |
Company Profile |
SEC
News |
Chart |
Request a new note
C
A
S
I |
HLI
-
NYSE
Houlihan Lokey Inc Cl A
Finance-Invest Bnk/Bkrs
|
$35.49
|
+0.63
1.81% |
$35.52
|
203,773
113.21% of 50 DAV
50 DAV is 180,000
|
$39.68
-10.56%
|
5/10/2017
|
$35.85
|
PP = $35.05
|
|
MB = $36.80
|
Most Recent Note - 8/14/2017 12:27:45 PM
Y - Rebounding above its 50 DMA line ($35.66) today helping its outlook improve and its color code is changed to yellow. More damaging losses below the recent low ($34.77 on 8/11/17) would raise serious concerns and trigger a technical sell signal.
>>> FEATURED STOCK ARTICLE : Extended Leader Encounters Distributional Pressure - 7/27/2017 |
View all notes |
Set NEW NOTE alert |
Company Profile |
SEC
News |
Chart |
Request a new note
C
A
S
I |
|
|
|
THESE ARE NOT BUY RECOMMENDATIONS!
Comments contained in the body of this report are technical
opinions only. The material herein has been obtained
from sources believed to be reliable and accurate, however,
its accuracy and completeness cannot be guaranteed.
This site is not an investment advisor, hence it does
not endorse or recommend any securities or other investments.
Any recommendation contained in this report may not
be suitable for all investors and it is not to be deemed
an offer or solicitation on our part with respect to
the purchase or sale of any securities. All trademarks,
service marks and trade names appearing in this report
are the property of their respective owners, and are
likewise used for identification purposes only.
This report is a service available
only to active Paid Premium Members.
You may opt-out of receiving report notifications
at any time. Questions or comments may be submitted
by writing to Premium Membership Services 665 S.E. 10 Street, Suite 201 Deerfield Beach, FL 33441-5634 or by calling 1-800-965-8307
or 954-785-1121.
|
|
|