You are not logged in.
This means you
CAN ONLY VIEW reports that were published prior to Thursday, March 20, 2025.
You
MUST UPGRADE YOUR MEMBERSHIP if you want to see any current reports.
AFTER MARKET UPDATE - MONDAY, AUGUST 14TH, 2017
Previous After Market Report Next After Market Report >>>
|
|
|
|
DOW |
+135.39 |
21,993.71 |
+0.62% |
|
Volume |
744,011,390 |
-6% |
|
Volume |
1,695,360,460 |
-6% |
|
NASDAQ |
+83.67 |
6,340.23 |
+1.34% |
|
Advancers |
2,284 |
77% |
|
Advancers |
2,115 |
75% |
|
S&P 500 |
+24.52 |
2,465.84 |
+1.00% |
|
Decliners |
681 |
23% |
|
Decliners |
710 |
25% |
|
Russell 2000 |
+20.08 |
1,394.31 |
+1.46% |
|
52 Wk Highs |
56 |
|
|
52 Wk Highs |
62 |
|
|
S&P 600 |
+12.02 |
843.05 |
+1.45% |
|
52 Wk Lows |
55 |
|
|
52 Wk Lows |
66 |
|
|
 |
Major Indices Rose But Again With Lighter Volume Totals
Kenneth J. Gruneisen - Passed the CAN SLIM® Master's Exam
Stocks finished higher on Monday. The Dow was up 135 points to 21993. The S&P 500 added 24 points to 2465 and the Nasdaq Composite gained 83 points to 6340.6256, but both are still below their respective 50-day moving average lines after Thursday's damaging losses. Monday's volume totals reported were lighter than the prior session totals on the NYSE and on the Nasdaq exchange, indicative of lackluster buying demand from large financial institutions. Breadth was positive as advancers led decliners by more than a 3-1 margin on the NYSE and 3-1 on the Nasdaq exchange. Leadership improved as 31 high-ranked companies from the Leaders List that made new 52-week highs and were listed on the BreakOuts Page, up from the total of 8 on the prior session, but down from 55 last Tuesday. New 52-week lows and new highs totals were close to even on both the NYSE and the Nasdaq exchange. Charts used courtesy of www.stockcharts.com
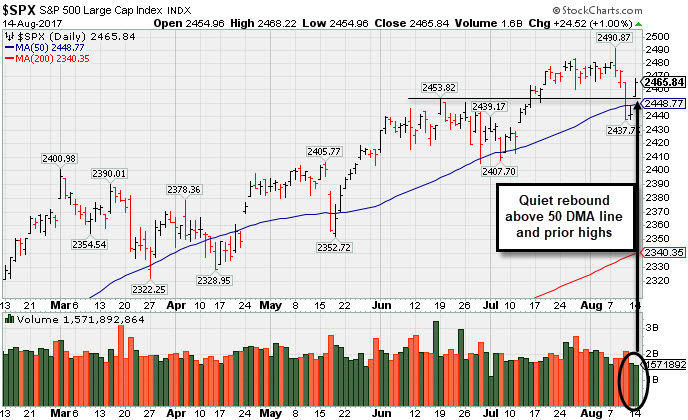
PICTURED: The S&P 500 Index posted a gain on Monday with lighter volume as it rebounded above its 50-day moving average (DMA) line and above prior highs. The major averages' (M criteria) prior uptrend came under pressure while leadership thinned.
Any sustainable rally requires hearty market leadership (a large number of high-ranked stocks hitting new highs). In weak markets investors should raise cash and reduce exposure to stocks by selling individual issues on a case-by-case basis as they trigger technical sell signals. The Featured Stocks Page provides the latest analysis on noteworthy high-ranked leaders.
The major averages advanced Monday as geopolitical concerns eased and investors digested commentary from a key Federal Reserve speaker. On Monday, Secretary of State Rex Tillerson stated that the Trump administration would continue to pursue diplomatic solutions with North Korea. In Fed news, New York President William Dudley suggested that the central bank will likely announce tapering to its bond portfolio next month. Dudley also stated that he would favor a third rate hike this year if the economy remained strong.
Ten of 11 sectors in the S&P 500 ended in positive territory. Technology stocks outperformed with NVIDIA Corp (NVDA +7.98%). VMware (VMW +6.60%) gapped up and rallied to a new high after posting a positive second-quarter preannouncement with raised EPS guidance. In M&A news, Fiat Chrysler (FCAU +8.53%) rallied amid takeover speculation. VF Corp (VFC +3.12%) after agreeing to purchase Williamson-Dickie Co. for $820 million. In earnings, Sysco (SYY -0.95%) despite beating estimates on the top and bottom lines. JD.com (JD -3.59%) after reporting a quarterly loss amid increased marketing spending.
Treasuries declined with the benchmark 10-year note down 9/32 to yield 2.22%. In commodities, NYMEX WTI crude retreated 2.7% to $47.51/barrel. In FOREX, the Dollar Index gained 0.4%. |
 Kenneth J. Gruneisen started out as a licensed stockbroker in August 1987, a couple of months prior to the historic stock market crash that took the Dow Jones Industrial Average down -22.6% in a single day. He has published daily fact-based fundamental and technical analysis on high-ranked stocks online for two decades. Through FACTBASEDINVESTING.COM, Kenneth provides educational articles, news, market commentary, and other information regarding proven investment systems that work in good times and bad.
Comments contained in the body of this report are technical opinions only and are not necessarily those of Gruneisen Growth Corp. The material herein has been obtained from sources believed to be reliable and accurate, however, its accuracy and completeness cannot be guaranteed. Our firm, employees, and customers may effect transactions, including transactions contrary to any recommendation herein, or have positions in the securities mentioned herein or options with respect thereto. Any recommendation contained in this report may not be suitable for all investors and it is not to be deemed an offer or solicitation on our part with respect to the purchase or sale of any securities. |
|
 |
Tech, Financial and Retail Indexes Rose
Kenneth J. Gruneisen - Passed the CAN SLIM® Master's Exam
On Monday the Bank Index ($BKX +1.78%) and the Broker/Dealer Index ($XBD +1.36%) posted solid gains. The Retail Index ($RLX +0.56%) posted a smaller gain, also giving the major indices a lift. The tech sector was led by the Semiconductor Index ($SOX +2.58%) while the Networking Index ($NWX +1.64%) and Biotechnology Index ($BTK +0.72%) also rallied. The Oil Services Index ($OSX +0.04%) and the Integrated Oil Index ($XOI -0.38%) edged lower while the Gold & Silver Index ($XAU _0.95%) was a standout decliner. Charts courtesy www.stockcharts.com
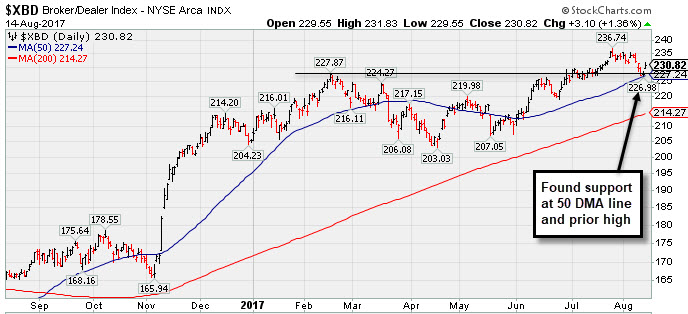 PICTURED: The Broker/Dealer Index ($XBD +1.36%) violated its 50-day moving average (DMA) line and undercut prior lows with recent losses..
| Oil Services |
$OSX |
123.12 |
+0.04 |
+0.03% |
-33.01% |
| Integrated Oil |
$XOI |
1,113.56 |
-4.29 |
-0.38% |
-12.18% |
| Semiconductor |
$SOX |
1,093.74 |
+27.52 |
+2.58% |
+20.66% |
| Networking |
$NWX |
459.60 |
+7.43 |
+1.64% |
+3.03% |
| Broker/Dealer |
$XBD |
230.82 |
+3.10 |
+1.36% |
+12.44% |
| Retail |
$RLX |
1,488.02 |
+8.30 |
+0.56% |
+10.80% |
| Gold & Silver |
$XAU |
83.29 |
-0.80 |
-0.95% |
+5.62% |
| Bank |
$BKX |
95.43 |
+1.67 |
+1.78% |
+3.97% |
| Biotech |
$BTK |
3,861.13 |
+27.75 |
+0.72% |
+25.56% |
|
|
|
 |
Fundamental Concerns Yet Rebound Helped Technical Stance
Kenneth J. Gruneisen - Passed the CAN SLIM® Master's Exam
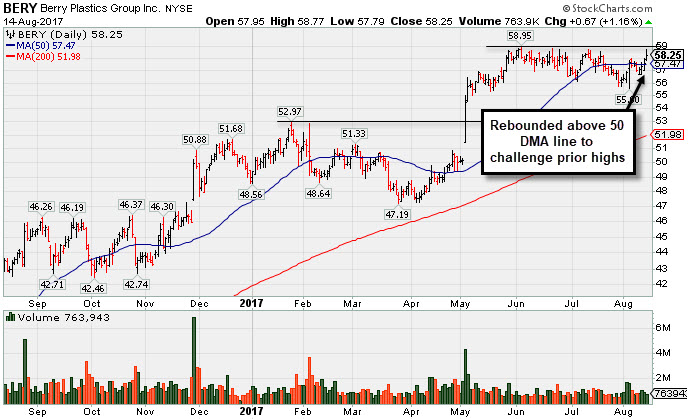
Berry Plastics Group Inc (BERY +$0.67 or +1.16% to $58.25) is consolidating back above its 50-day moving average (DMA) line ($56.63). However, it recently reported Jun '17 quarterly earnings +13% on +16% sales revenues, below the +25% minimum earnings guideline (C criteria), raising fundamental concerns. Disciplined investors have better odds by choosing buy candidates without fundamental flaws. Damaging losses below the 50 DMA line and recent lows would raise greater concerns and trigger a technical sell signal.
BERY had reported earnings +36% on +12% sales revenues for the Mar '17 quarter, after earnings rose +43% on -7% sales revenues for the Dec '16 quarter. The lower sales revenues were noted as a cause for concern, especially after the 4 prior quarterly comparisons showed strong sales revenues increases in the +32-35% range.
BERY was last shown in this FSU section on 7/07/17 with an annotated graph under the headline, "Found Prompt Support at 50-Day Moving Average Line". The high-ranked Containers/Packaging firm's annual earnings (A criteria) history has been strong. The number of top-rated funds owning its shares rose from 580 in Sep '16 to 637 in Jun '17, a reassuring sign concerning the I criteria. Its Up/Down Volume Ratio of 1.0 is an unbiased indication its shares have been neutral in terms of accumulation/distribution over the past 50 days. It currently has a Timeliness Rating of C and a Sponsorship rating of C. |
|
|
Color Codes Explained :
Y - Better candidates highlighted by our
staff of experts.
G - Previously featured
in past reports as yellow but may no longer be buyable under the
guidelines.
***Last / Change / Volume data in this table is the closing quote data***
Symbol/Exchange
Company Name
Industry Group |
PRICE |
CHANGE
(%Change) |
Day High |
Volume
(% DAV)
(% 50 day avg vol) |
52 Wk Hi
% From Hi |
Featured
Date |
Price
Featured |
Pivot Featured |
|
Max Buy |
THO
-
NYSE
Thor Industries Inc
AUTOMOTIVE - Recreational Vehicles
|
$106.67
|
+2.12
2.03% |
$107.27
|
428,530
59.93% of 50 DAV
50 DAV is 715,000
|
$115.74
-7.83%
|
8/14/2017
|
$106.67
|
PP = $110.01
|
|
MB = $115.51
|
 Most Recent Note - 8/14/2017 9:10:01 PM
Y - Color code is changed to yellow with new pivot point cited based on its 6/28/17 high plus 10 cents. Rebounded above its 50 DMA line ($104.81) helping its technical stance improve. Subsequent volume-driven gains above the pivot point may trigger a new (or add-on) technical buy signal. Still faces some resistance due to overhead supply up through the $115 level.
>>> FEATURED STOCK ARTICLE : Still Faces Some Resistance Due to Overhead Supply - 7/20/2017 |
View all notes |
Set NEW NOTE alert |
Company Profile |
SEC
News |
Chart |
Request a new note
C
A
S
I |
BERY
-
NYSE
Berry Global Group Inc
CONSUMER NON-DURABLES - Packaging and Containers
|
$58.25
|
+0.67
1.16% |
$58.77
|
763,943
86.81% of 50 DAV
50 DAV is 880,000
|
$58.95
-1.19%
|
7/14/2017
|
$57.67
|
PP = $59.05
|
|
MB = $62.00
|
Most Recent Note - 8/14/2017 9:04:25 PM
G - Rebounded above its 50 DMA line ($57.47) and challenged its all-time high with today's quiet gain. Recent lows define near-term support. Reported Jun '17 quarterly earnings +13% on +16% sales revenues, below the +25% minimum earnings guideline (C criteria), raising fundamental concerns. See the latest FSU analysis for more details and a new annotated graph.
>>> FEATURED STOCK ARTICLE : Fundamental Concerns Yet Rebound Helped Technical Stance - 8/14/2017 |
View all notes |
Set NEW NOTE alert |
Company Profile |
SEC
News |
Chart |
Request a new note
C
A
S
I |
HSKA
-
NASDAQ
Heska Corporation
DRUGS - Biotechnology
|
$96.68
|
+1.04
1.09% |
$97.27
|
47,661
69.07% of 50 DAV
50 DAV is 69,000
|
$115.00
-15.93%
|
7/31/2017
|
$114.27
|
PP = $110.35
|
|
MB = $115.87
|
Most Recent Note - 8/14/2017 9:11:44 PM
G - Remains below its 50 DMA line ($99.56), and a rebound is needed for its outlook to improve. Encountering distributional pressure since highlighted in yellow in the 7/31/17 mid-day report with pivot point cited based on its high hit on 5/01/17 plus 10 cents. Failed to produce confirming gains since repeatedly noted - "Subsequent gains and a strong finish above its pivot point may clinch a convincing technical buy signal. Small supply of only 6 million shares in the public float (S criteria) can contribute to greater price volatility in the event of institutional buying or selling."
>>> FEATURED STOCK ARTICLE : Small Supply of Shares and Closed In Lower Half of Intra-day Range - 7/31/2017 |
View all notes |
Set NEW NOTE alert |
Company Profile |
SEC
News |
Chart |
Request a new note
C
A
S
I |
EW
-
NYSE
Edwards Lifesciences Cp
HEALTH SERVICES - Medical Appliances and Equipment
|
$115.64
|
+1.14
1.00% |
$115.94
|
1,295,686
109.89% of 50 DAV
50 DAV is 1,179,100
|
$121.75
-5.02%
|
7/11/2017
|
$117.23
|
PP = $121.85
|
|
MB = $127.94
|
Most Recent Note - 8/11/2017 5:59:13 PM
G - Perched within striking distance of its 52-week high but its Relative Strength Rating has slumped to 78, below the 80+ minimum guideline for buy candidates. Still lingering below its 50 DMA line ($116.91) which is now starting to slope downward. Fundamentals remain strong. Subsequent volume-driven gains for new highs may trigger a new (or add-on) technical buy signal which could mark the beginning of a new leg up.
>>> FEATURED STOCK ARTICLE : Near 50-Day Moving Average Line, Yet Not Far Off High - 8/7/2017 |
View all notes |
Set NEW NOTE alert |
Company Profile |
SEC
News |
Chart |
Request a new note
C
A
S
I |
NTES
-
NASDAQ
Netease Inc Adr
INTERNET - Internet Information Providers
|
$278.62
|
-2.34
-0.83% |
$287.96
|
1,468,656
110.67% of 50 DAV
50 DAV is 1,327,000
|
$337.55
-17.46%
|
6/8/2017
|
$310.76
|
PP = $307.62
|
|
MB = $323.00
|
Most Recent Note - 8/10/2017 5:46:03 PM
G - Gapped down and violated its 50 DMA line today with a damaging loss triggering a technical sell signal. Reported Jun '17 earnings +5% on +46% sales revenues, below the +25% minimum earnings guideline (C criteria), raising fundamental concerns.
>>> FEATURED STOCK ARTICLE : Found Recent Support at 50-Day Moving Average Line - 7/21/2017 |
View all notes |
Set NEW NOTE alert |
Company Profile |
SEC
News |
Chart |
Request a new note
C
A
S
I |
Symbol/Exchange
Company Name
Industry Group |
PRICE |
CHANGE
(%Change) |
Day High |
Volume
(% DAV)
(% 50 day avg vol) |
52 Wk Hi
% From Hi |
Featured
Date |
Price
Featured |
Pivot Featured |
|
Max Buy |
STMP
-
NASDAQ
Stamps.com Inc
INTERNET - Internet Software and Services
|
$210.65
|
+2.00
0.96% |
$215.65
|
454,888
93.79% of 50 DAV
50 DAV is 485,000
|
$220.25
-4.36%
|
5/24/2017
|
$133.10
|
PP = $136.10
|
|
MB = $142.91
|
Most Recent Note - 8/11/2017 5:55:51 PM
G - Holding ground near its all-time high after getting very extended from any sound base. Its 50 DMA line and prior highs define important near-term support in the $156 area. Fundamentals remain strong. See the latest FSU analysis for more details and a new annotated graph.
>>> FEATURED STOCK ARTICLE : Blasted Higher After Latest Strong Earnings Report - 8/11/2017 |
View all notes |
Set NEW NOTE alert |
Company Profile |
SEC
News |
Chart |
Request a new note
C
A
S
I |
HTHT
-
NASDAQ
China Lodging Group Ads
LEISURE - Lodging
|
$99.03
|
-0.33
-0.33% |
$101.91
|
428,680
166.80% of 50 DAV
50 DAV is 257,000
|
$107.17
-7.60%
|
9/29/2016
|
$46.12
|
PP = $47.82
|
|
MB = $50.21
|
Most Recent Note - 8/14/2017 12:33:21 PM
G - Encountering distributional pressure in recent weeks yet it remains perched near its all-time high, very extended from any sound base. Its 50 DMA line ($87.71) and prior highs in the $88 area define important near-term support. Due to report earnings news on Thursday, 8/17/17 before the open. Volume and volatility often increase near earnings news.
>>> FEATURED STOCK ARTICLE : Extended From Sound Base With Earnings News Due Next Week - 8/9/2017 |
View all notes |
Set NEW NOTE alert |
Company Profile |
SEC
News |
Chart |
Request a new note
C
A
S
I |
LMAT
-
NASDAQ
Lemaitre Vascular Inc
Medical-Products
|
$34.02
|
+1.03
3.12% |
$34.03
|
155,594
79.79% of 50 DAV
50 DAV is 195,000
|
$36.09
-5.74%
|
7/28/2017
|
$33.50
|
PP = $33.32
|
|
MB = $34.99
|
Most Recent Note - 8/14/2017 8:58:36 PM
Y - Finished at the session high today with a gain on lighter volume, rising back above its pivot point and avoiding a bad slump into the prior base. Prior highs in the $32-33 area were previously noted as initial support to watch. Disciplined investors avoid chasing extended stocks more than +5% above prior highs, and they always limit losses by selling any stock that falls more than -7% from their purchase price.
>>> FEATURED STOCK ARTICLE : Big Volume-Driven Gain Following Strong Earnings News - 7/28/2017 |
View all notes |
Set NEW NOTE alert |
Company Profile |
SEC
News |
Chart |
Request a new note
C
A
S
I |
BEAT
-
NASDAQ
BioTelemetry Inc
Medical-Services
|
$37.15
|
+2.65
7.68% |
$37.38
|
884,773
198.34% of 50 DAV
50 DAV is 446,100
|
$36.50
1.78%
|
2/14/2017
|
$25.10
|
PP = $24.55
|
|
MB = $25.78
|
Most Recent Note - 8/14/2017 12:05:19 PM
G - Hitting a new all-time high today, but fundamental concerns remain. Jun '17 quarterly earnings rose +10% on +10% sales revenues, its 2nd consecutive quarterly comparison below the +25% minimum earnings guideline (C criteria). Its 50 DMA line ($26.63) defines near-term support along with prior lows.
>>> FEATURED STOCK ARTICLE : New Highs on Twice Average Volume; Fundamental Concerns Remain - 7/14/2017 |
View all notes |
Set NEW NOTE alert |
Company Profile |
SEC
News |
Chart |
Request a new note
C
A
S
I |
ESNT
-
NYSE
Essent Group Ltd
Finance-MrtgandRel Svc
|
$38.98
|
+0.78
2.04% |
$39.29
|
824,123
145.09% of 50 DAV
50 DAV is 568,000
|
$41.44
-5.94%
|
7/3/2017
|
$38.05
|
PP = $39.60
|
|
MB = $41.58
|
Most Recent Note - 8/14/2017 12:16:12 PM
Y - Gapped up today after a "positive reversal" on the prior session, finding prompt support near the 50 DMA line. Its 200 DMA line and prior lows define near-term support in the $34-35 area. Completed a new Public Offering on 8/08/17, pulling back after spiking to a new all-time high.
>>> FEATURED STOCK ARTICLE : Perched Within Close Striking Distance of a New High - 8/1/2017 |
View all notes |
Set NEW NOTE alert |
Company Profile |
SEC
News |
Chart |
Request a new note
C
A
S
I |
Symbol/Exchange
Company Name
Industry Group |
PRICE |
CHANGE
(%Change) |
Day High |
Volume
(% DAV)
(% 50 day avg vol) |
52 Wk Hi
% From Hi |
Featured
Date |
Price
Featured |
Pivot Featured |
|
Max Buy |
VEEV
-
NYSE
Veeva Systems Inc Cl A
Computer Sftwr-Medical
|
$63.08
|
+1.23
1.99% |
$63.49
|
637,133
45.41% of 50 DAV
50 DAV is 1,403,000
|
$68.07
-7.33%
|
7/24/2017
|
$65.91
|
PP = $68.17
|
|
MB = $71.58
|
Most Recent Note - 8/10/2017 6:00:32 PM
G - Violated its 50 DMA line ($62.74) with a damaging loss today on higher (near average) volume raising concerns. Only a prompt rebound above the 50 DMA line would help its outlook improve. Faces resistance due to overhead supply up through the $68 level. Disciplined investors will note that it did not produce the necessary volume-driven gains needed to trigger a new (or add-on) technical buy signal.
>>> FEATURED STOCK ARTICLE : Slump Below 50-Day Moving Average Line Raises Concerns - 8/2/2017 |
View all notes |
Set NEW NOTE alert |
Company Profile |
SEC
News |
Chart |
Request a new note
C
A
S
I |
ANET
-
NYSE
Arista Networks Inc
TELECOMMUNICATIONS - Communication Equipment
|
$169.80
|
+4.11
2.48% |
$170.69
|
640,108
72.66% of 50 DAV
50 DAV is 881,000
|
$176.50
-3.80%
|
8/4/2017
|
$173.31
|
PP = $163.07
|
|
MB = $171.22
|
Most Recent Note - 8/14/2017 9:01:16 PM
Y - Posted a gain today on below average volume, remaining below its "max buy" level. Prior highs in the $162 area define initial support to watch . Fundamentals remain strong.
>>> FEATURED STOCK ARTICLE : Networking Firm Consolidating Above 50-Day Moving Average Line - 7/18/2017 |
View all notes |
Set NEW NOTE alert |
Company Profile |
SEC
News |
Chart |
Request a new note
C
A
S
I |
GRUB
-
NYSE
Grubhub Inc
COMPUTER SOFTWARE and SERVICES - Technical and System Software
|
$54.42
|
-0.04
-0.07% |
$55.25
|
1,222,425
57.77% of 50 DAV
50 DAV is 2,116,000
|
$57.26
-4.96%
|
6/21/2017
|
$47.33
|
PP = $46.94
|
|
MB = $49.29
|
Most Recent Note - 8/14/2017 9:05:50 PM
G - Perched near its all-time high, extended from the prior base after rallying well above its "max buy" level. Reported earnings +13% on +32% sales revenues for the Jun '17 quarter, below the +25% minimum earnings guideline (C criteria) raising fundamental concerns.
>>> FEATURED STOCK ARTICLE : Spiked Into New High Territory Despite Sub Par Earnings News - 8/8/2017 |
View all notes |
Set NEW NOTE alert |
Company Profile |
SEC
News |
Chart |
Request a new note
C
A
S
I |
IBP
-
NYSE
Installed Building Prod
DIVERSIFIED SERVICES - Business/Management Services
|
$59.50
|
+1.70
2.94% |
$59.50
|
96,973
74.03% of 50 DAV
50 DAV is 131,000
|
$60.00
-0.83%
|
6/13/2017
|
$54.25
|
PP = $55.55
|
|
MB = $58.33
|
Most Recent Note - 8/14/2017 8:55:59 PM
G - Posted a gain on light volume for a new high close, rising above its "max buy" level. A big volume-driven gain on 8/04/17 triggered a technical buy signal. Fundamentals remain strong.
>>> FEATURED STOCK ARTICLE : Volume Cooling While Staying Above 50-Day Moving Average Line - 7/17/2017 |
View all notes |
Set NEW NOTE alert |
Company Profile |
SEC
News |
Chart |
Request a new note
C
A
S
I |
NCOM
-
NASDAQ
National Commerce Corp
BANKING - Regional - Southeast Banks
|
$40.00
|
+0.40
1.01% |
$40.10
|
27,894
84.53% of 50 DAV
50 DAV is 33,000
|
$41.25
-3.03%
|
4/25/2017
|
$38.95
|
PP = $40.09
|
|
MB = $42.09
|
Most Recent Note - 8/11/2017 5:57:06 PM
Y - Still consolidating near its 50 DMA line ($39.52). Subsequent damaging losses violating it or the recent lows would trigger technical sell signals. Reported Jun '17 earnings +23% on +45% sales revenues, below the +25% minimum earnings guideline (C criteria), raising fundamental concerns.
>>> FEATURED STOCK ARTICLE : Recent Breakout Lacked Great Volume Conviction - 7/10/2017 |
View all notes |
Set NEW NOTE alert |
Company Profile |
SEC
News |
Chart |
Request a new note
C
A
S
I |
Symbol/Exchange
Company Name
Industry Group |
PRICE |
CHANGE
(%Change) |
Day High |
Volume
(% DAV)
(% 50 day avg vol) |
52 Wk Hi
% From Hi |
Featured
Date |
Price
Featured |
Pivot Featured |
|
Max Buy |
HQY
-
NASDAQ
Healthequity Inc
COMPUTER SOFTWARE and SERVICES - Healthcare Information Service
|
$46.79
|
+1.86
4.14% |
$46.86
|
416,372
78.71% of 50 DAV
50 DAV is 529,000
|
$54.95
-14.85%
|
6/7/2017
|
$50.01
|
PP = $49.35
|
|
MB = $51.82
|
Most Recent Note - 8/14/2017 8:54:08 PM
G - Found support above its 200 DMA line ($44.42) with a gain today, but remains well below its 50 DMA line ($49.42). A rebound above the 50 DMA line is needed for its outlook to improve. Faces some resistance due to overhead supply up through the $54 level.
>>> FEATURED STOCK ARTICLE : 50-Day Moving Average Violation Triggers Technical Sell Signal - 7/19/2017 |
View all notes |
Set NEW NOTE alert |
Company Profile |
SEC
News |
Chart |
Request a new note
C
A
S
I |
OLLI
-
NASDAQ
Ollie's Bargain Outlet
Retail-DiscountandVariety
|
$45.00
|
+0.25
0.56% |
$45.55
|
437,635
62.97% of 50 DAV
50 DAV is 695,000
|
$46.08
-2.33%
|
7/17/2017
|
$43.96
|
PP = $44.18
|
|
MB = $46.39
|
Most Recent Note - 8/10/2017 5:43:11 PM
Y - Perched near its 52-week high, quietly consolidating above its 50 DMA line ($42.76). See the latest FSU analysis for more details and a new annotated graph.
>>> FEATURED STOCK ARTICLE : Quietly Consolidating Above 50 Day Moving Average Near High - 8/10/2017 |
View all notes |
Set NEW NOTE alert |
Company Profile |
SEC
News |
Chart |
Request a new note
C
A
S
I |
MOMO
-
NASDAQ
Momo Inc.
INTERNET - Content
|
$44.57
|
+2.47
5.87% |
$44.97
|
3,865,918
790.25% of 50 DAV
50 DAV is 489,200
|
$46.69
-4.54%
|
7/25/2017
|
$44.05
|
PP = $46.05
|
|
MB = $48.35
|
Most Recent Note - 8/14/2017 12:40:31 PM
Y - Gapped up today, finding prompt support at its 50 DMA line. Subsequent volume-driven gains for new highs may trigger a new (or add-on) technical buy signal. Its latest low ($40.50) defines important chart support where a violation would raise more serious concerns.
>>> FEATURED STOCK ARTICLE : Perched Within Striking Distance of Prior High - 7/25/2017 |
View all notes |
Set NEW NOTE alert |
Company Profile |
SEC
News |
Chart |
Request a new note
C
A
S
I |
HLI
-
NYSE
Houlihan Lokey Inc Cl A
Finance-Invest Bnk/Bkrs
|
$36.30
|
+1.20
3.42% |
$36.35
|
292,819
165.43% of 50 DAV
50 DAV is 177,000
|
$39.68
-8.52%
|
5/10/2017
|
$35.85
|
PP = $35.05
|
|
MB = $36.80
|
Most Recent Note - 8/14/2017 12:27:45 PM
Y - Rebounding above its 50 DMA line ($35.66) today helping its outlook improve and its color code is changed to yellow. More damaging losses below the recent low ($34.77 on 8/11/17) would raise serious concerns and trigger a technical sell signal.
>>> FEATURED STOCK ARTICLE : Extended Leader Encounters Distributional Pressure - 7/27/2017 |
View all notes |
Set NEW NOTE alert |
Company Profile |
SEC
News |
Chart |
Request a new note
C
A
S
I |
|
|
|
THESE ARE NOT BUY RECOMMENDATIONS!
Comments contained in the body of this report are technical
opinions only. The material herein has been obtained
from sources believed to be reliable and accurate, however,
its accuracy and completeness cannot be guaranteed.
This site is not an investment advisor, hence it does
not endorse or recommend any securities or other investments.
Any recommendation contained in this report may not
be suitable for all investors and it is not to be deemed
an offer or solicitation on our part with respect to
the purchase or sale of any securities. All trademarks,
service marks and trade names appearing in this report
are the property of their respective owners, and are
likewise used for identification purposes only.
This report is a service available
only to active Paid Premium Members.
You may opt-out of receiving report notifications
at any time. Questions or comments may be submitted
by writing to Premium Membership Services 665 S.E. 10 Street, Suite 201 Deerfield Beach, FL 33441-5634 or by calling 1-800-965-8307
or 954-785-1121.
|
|
|