You are not logged in.
This means you
CAN ONLY VIEW reports that were published prior to Thursday, March 20, 2025.
You
MUST UPGRADE YOUR MEMBERSHIP if you want to see any current reports.
AFTER MARKET UPDATE - WEDNESDAY, MAY 27TH, 2015
Previous After Market Report Next After Market Report >>>
|
|
|
|
DOW |
+121.45 |
18,162.99 |
+0.67% |
|
Volume |
706,634,290 |
-11% |
|
Volume |
1,677,163,760 |
+5% |
|
NASDAQ |
+73.84 |
5,106.59 |
+1.47% |
|
Advancers |
2,254 |
71% |
|
Advancers |
2,003 |
68% |
|
S&P 500 |
+19.28 |
2,123.48 |
+0.92% |
|
Decliners |
815 |
26% |
|
Decliners |
843 |
29% |
|
Russell 2000 |
+15.60 |
1,254.36 |
+1.26% |
|
52 Wk Highs |
56 |
|
|
52 Wk Highs |
82 |
|
|
S&P 600 |
+8.06 |
717.78 |
+1.14% |
|
52 Wk Lows |
45 |
|
|
52 Wk Lows |
47 |
|
|
 |
Leadership Expanded as Nasdaq Composite Hit New Record High
Kenneth J. Gruneisen - Passed the CAN SLIM® Master's Exam
Stocks finished higher on Wednesday. The Dow climbed 121 points to 18162. The S&P 500 advanced 19 points to 2123. The NASDAQ gained 73 points to 5106, a record high. The volume totals were mixed, higher than the prior session total on the Nasdaq exchange and lower on the NYSE. Breadth was positive as advancers led decliners by almost a 3-1 margin on the NYSE and by 5-2 on the Nasdaq exchange. Leadership improved as there were 40 high-ranked companies from the Leaders List that made new 52-week highs and appeared on the BreakOuts Page, up from the prior session total of 14 stocks. New 52-week highs expanded and outnumbered new lows on both the NYSE and the Nasdaq exchange. There were gains for 12 of the 13 high-ranked companies currently on the Featured Stocks Page.
Concerning the M criteria, stocks have endured distributional pressure after making little headway following the bullish action on 5/14/15 which met the definition of a "follow-through day". Investors still have a favorable market environment for buying stocks meeting all of the key fundamental and technical criteria, however, any sustained rally requires healthy leadership (more stocks hitting new 52-week highs).
PICTURED: The S&P 500 Index found support above its 50-day moving average (DMA) line while consolidating after rising to new record highs.
The major averages rebounded from yesterday to post the best daily advance this month amid reports that Greek and EU officials came closer to reaching an agreement.
Nine of 10 S&P 500 sectors were higher. In tech, Apple Inc (AAPL +1.87%) recovered some its prior loss. Computer Sciences (CSC +2.56%) rose on plans to spin-off a government-focused arm. Industrial stocks were lifted by airlines as Southwest (LUV +2.75%) rose. AbbVie (ABBV +1.94%) provided health stocks with a tail wind on the heels of announcing share buybacks.
In M&A, Broadcom (BRCM +21.45%) surged on speculation that it may be acquired by Avago (AVGO +7.76%). Reynolds (RAI +2.25%) climbed after regulators approved their planned acquisition of Lorillard (LO +0.97%). Looking at earnings, Tiffany (TIF +10.53%) rose after topping projections, but lowered guidance sent Michael Kors (KORS -24.20%) tumbling.
Treasuries were mixed. Amid a $35 billion auction, the five-year note fell 1/32 to yield 1.53%. The benchmark 10-year note rose 2/32 to yield 2.13%.
Commodities were mostly lower. WTI crude lost 0.7% to $57.61/barrel. COMEX gold was little changed at $1187.20/ounce. In FOREX, the Dollar Index gave back gains to finish virtually unchanged.
The Featured Stocks Page shows recent notes and Headline Links directing members to detailed analysis with data-packed graphs annotated by our experts. See the Premium Member Homepage for archives to all prior pay reports published.
|
 Kenneth J. Gruneisen started out as a licensed stockbroker in August 1987, a couple of months prior to the historic stock market crash that took the Dow Jones Industrial Average down -22.6% in a single day. He has published daily fact-based fundamental and technical analysis on high-ranked stocks online for two decades. Through FACTBASEDINVESTING.COM, Kenneth provides educational articles, news, market commentary, and other information regarding proven investment systems that work in good times and bad.
Comments contained in the body of this report are technical opinions only and are not necessarily those of Gruneisen Growth Corp. The material herein has been obtained from sources believed to be reliable and accurate, however, its accuracy and completeness cannot be guaranteed. Our firm, employees, and customers may effect transactions, including transactions contrary to any recommendation herein, or have positions in the securities mentioned herein or options with respect thereto. Any recommendation contained in this report may not be suitable for all investors and it is not to be deemed an offer or solicitation on our part with respect to the purchase or sale of any securities. |
|
 |
Retail, Financial, and Tech Indices Rose
Kenneth J. Gruneisen - Passed the CAN SLIM® Master's Exam
The Retail Index ($RLX +1.07%) helped give a boost to the major averages on Wednesday along with financials as the Bank Index ($BKX +0.99%) and the Broker/Dealer Index ($XBD +1.43%) both finished higher. The tech sector saw gains from the Networking Index ($NWX +1.27%), Biotechnology Index ($BTK +1.37%), and the Semiconductor Index ($SOX+3.86%) was a standout gainer. Commodity-linked groups were quiet as the Oil Services Index ($OSX +0.16%), Integrated Oil Index ($XOI -0.02%), and the Gold & Silver Index ($XAU +0.10%) finished flat.
Charts courtesy www.stockcharts.com
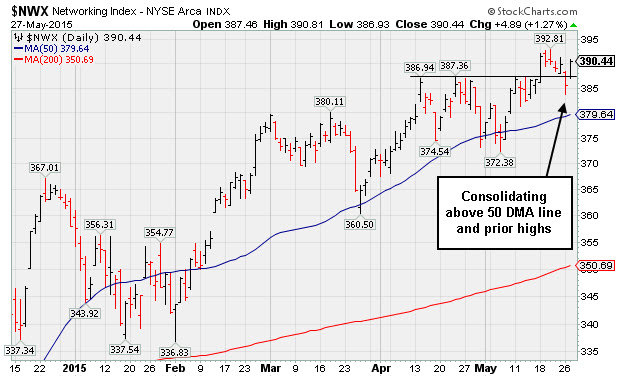
PICTURED: The Networking Index ($NWX +1.27%) is consolidating above its 50-day moving average (DMA) line and prior highs.
| Oil Services |
$OSX |
212.97 |
+0.33 |
+0.16% |
+1.00% |
| Integrated Oil |
$XOI |
1,344.50 |
-0.22 |
-0.02% |
-0.27% |
| Semiconductor |
$SOX |
742.35 |
+27.60 |
+3.86% |
+8.08% |
| Networking |
$NWX |
390.44 |
+4.89 |
+1.27% |
+9.08% |
| Broker/Dealer |
$XBD |
195.15 |
+2.74 |
+1.43% |
+5.69% |
| Retail |
$RLX |
1,144.08 |
+12.14 |
+1.07% |
+10.78% |
| Gold & Silver |
$XAU |
68.76 |
+0.07 |
+0.10% |
-0.03% |
| Bank |
$BKX |
76.35 |
+0.75 |
+0.99% |
+2.81% |
| Biotech |
$BTK |
4,182.43 |
+56.49 |
+1.37% |
+21.61% |
|
|
|
 |
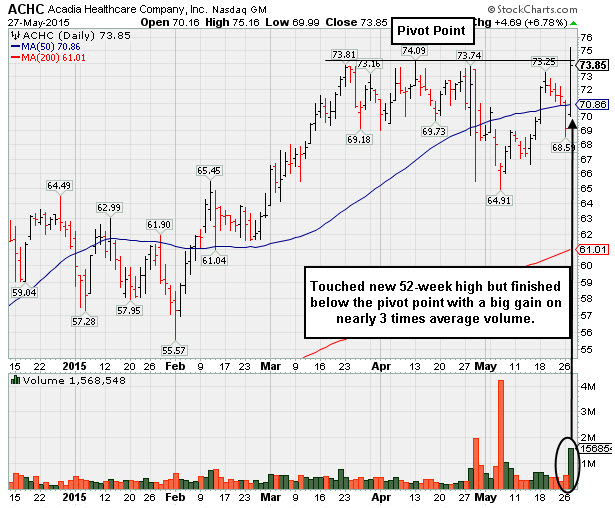
Finished Below Pivot Point Despite Big Volume-Driven Gain and New 52-Week High
Kenneth J. Gruneisen - Passed the CAN SLIM® Master's Exam
Acadia Healthcare Inc (ACHC +$4.69 or +6.78% to $73.85) was highlighted in yellow with new pivot point cited based on its 4/13/15 high plus 10 cents in the earlier mid-day report (read here). It rallied from below its 50-day moving average (DMA) line to hit a new 52-week high, however, it failed to close the session above the pivot point. Confirming gains are still needed. Members were reminded - "A strong gain for a new high (N criteria) above the pivot point with at least +40% above average volume is needed to trigger a proper technical buy signal."
It has a small supply of only 50.8 million shares (S criteria) in the public float. Leadership in the Medical / Outpatient/Home Care industry group is a reassuring sign (L criteria) as the group has earned an 89 Group Relative Strength Rating. The number of top-rated funds owning its shares rose from 364 on Jun '14 to 458 in Mar '15, a reassuring sign concerning the I criteria. It completed a new Public Offering on 5/05/15, and such offerings typically hinder a stock's progress for the short-term, however, the upshot is that the underwriters help companies attract greater interest from the institutional crowd.
It reported earnings increases of +23%, +53%, +59%, and +54% in the Jun, Sep, Dec '14 and Mar '15 quarters, respectively. Having 3 or 4 quarterly comparisons with increases above the +25% minimum guideline satisfied the C criteria. Sales revenues increases during that span were also up +20%, +59%, +55%, and +82%, showing encouraging acceleration. Since tallying a loss in FY '11 its annual earnings (A criteria) have been strong.
|
|
|
Color Codes Explained :
Y - Better candidates highlighted by our
staff of experts.
G - Previously featured
in past reports as yellow but may no longer be buyable under the
guidelines.
***Last / Change / Volume data in this table is the closing quote data***
Symbol/Exchange
Company Name
Industry Group |
PRICE |
CHANGE
(%Change) |
Day High |
Volume
(% DAV)
(% 50 day avg vol) |
52 Wk Hi
% From Hi |
Featured
Date |
Price
Featured |
Pivot Featured |
|
Max Buy |
GSBC
-
NASDAQ
Great Southern Bancorp
BANKING - Savings and Loans
|
$39.76
|
+0.53
1.35% |
$39.90
|
33,151
103.60% of 50 DAV
50 DAV is 32,000
|
$41.41
-3.98%
|
4/27/2015
|
$40.94
|
PP = $40.54
|
|
MB = $42.57
|
 Most Recent Note - 5/27/2015 6:36:50 PM
Y - Found support today while consolidating near its 50 DMA line ($39.20). Recent lows ($38.00 on 5/06/15) define the next important support where a violation would trigger a technical sell signal.
>>> FEATURED STOCK ARTICLE : Found Reassuring Support at 50-Day Moving Average Line - 5/14/2015 |
View all notes |
Set NEW NOTE alert |
Company Profile |
SEC
News |
Chart |
Request a new note
C
A
S
I |
EPAM
-
NYSE
Epam Systems Inc
COMPUTER SOFTWARE and SERVICES - Information Technology Service
|
$69.84
|
+2.36
3.50% |
$70.02
|
411,207
93.67% of 50 DAV
50 DAV is 439,000
|
$70.49
-0.92%
|
5/18/2015
|
$67.42
|
PP = $70.59
|
|
MB = $74.12
|
Most Recent Note - 5/27/2015 6:27:34 PM
Y - Rose near its 52-week high with a gain today on average volume. Subsequent volume-driven gains above the pivot point may trigger a new (or add-on) technical buy signal. Important support is defined by its 50 DMA line ($65.53) where more damaging losses would raise greater concerns and trigger a technical sell signal.
>>> FEATURED STOCK ARTICLE : Consolidating Above Support at Prior Highs and 50-Day Moving Average - 5/15/2015 |
View all notes |
Set NEW NOTE alert |
Company Profile |
SEC
News |
Chart |
Request a new note
C
A
S
I |
FLT
-
NYSE
Fleetcor Technologies
DIVERSIFIED SERVICES - Business/Management Services
|
$153.63
|
+0.77
0.50% |
$154.44
|
476,172
87.71% of 50 DAV
50 DAV is 542,900
|
$165.67
-7.27%
|
5/1/2015
|
$155.23
|
PP = $160.50
|
|
MB = $168.53
|
Most Recent Note - 5/27/2015 6:39:37 PM
Following volume-driven losses it posted a small gain with below average volume today while sputtering below its 50 DMA line. Convincing gains above the 50 DMA line are needed for its outlook to improve. Relative Strength rating has slumped to 65, well below the 80+ minimum guideline for buy candidates. It will be dropped from the Featured Stocks list tonight.
>>> FEATURED STOCK ARTICLE : Relative Strength Rating Fell While Consolidating Near 50-Day Average - 5/18/2015 |
View all notes |
Set NEW NOTE alert |
Company Profile |
SEC
News |
Chart |
Request a new note
C
A
S
I |
VRX
-
NYSE
Valeant Pharmaceuticals
DRUGS - Drug Manufacturers - Other
|
$239.12
|
+3.81
1.62% |
$239.16
|
2,389,725
135.70% of 50 DAV
50 DAV is 1,761,000
|
$239.03
0.04%
|
1/5/2015
|
$144.84
|
PP = $149.90
|
|
MB = $157.40
|
Most Recent Note - 5/27/2015 6:41:10 PM
G - Posted a gain today with higher volume for another new all-time high. Found prompt support its 50 DMA line recently but it did not form a sound base. Completed a new Public Offering on 3/17/15. Reported earnings +34% on +16% sales revenues for the Mar '15 quarter, an improvement after Dec '14 earnings below the +25% minimum guideline (C criteria).
>>> FEATURED STOCK ARTICLE : Very Extended Following 7 Consecutive Gains - 5/22/2015 |
View all notes |
Set NEW NOTE alert |
Company Profile |
SEC
News |
Chart |
Request a new note
C
A
S
I |
NXPI
-
NASDAQ
Nxp Semiconductors N V
ELECTRONICS - Semiconductor - Broad Line
|
$110.71
|
+3.72
3.48% |
$111.14
|
4,102,410
134.46% of 50 DAV
50 DAV is 3,051,000
|
$108.50
2.04%
|
4/15/2015
|
$100.75
|
PP = $108.60
|
|
MB = $114.03
|
Most Recent Note - 5/27/2015 6:31:04 PM
Y - Rallied above its pivot point today, but volume was only +34% above average as it hit new 52-week and all-time highs. Volume must be at least +40% above average to trigger a proper technical buy signal. No overhead supply remains to act as resistance. Its 50 DMA line and recent lows near $93.50 define important chart support where more damaging losses may raise concerns and trigger worrisome technical sell signals.
>>> FEATURED STOCK ARTICLE : Rallied Toward Prior Highs Following Earnings News - 5/8/2015 |
View all notes |
Set NEW NOTE alert |
Company Profile |
SEC
News |
Chart |
Request a new note
C
A
S
I |
Symbol/Exchange
Company Name
Industry Group |
PRICE |
CHANGE
(%Change) |
Day High |
Volume
(% DAV)
(% 50 day avg vol) |
52 Wk Hi
% From Hi |
Featured
Date |
Price
Featured |
Pivot Featured |
|
Max Buy |
SWKS
-
NASDAQ
Skyworks Solutions Inc
ELECTRONICS - Semiconductor - Integrated Cir
|
$108.63
|
+4.91
4.73% |
$108.71
|
4,773,658
120.67% of 50 DAV
50 DAV is 3,956,000
|
$106.83
1.68%
|
5/1/2015
|
$97.51
|
PP = $102.87
|
|
MB = $108.01
|
Most Recent Note - 5/27/2015 6:26:11 PM
G - Finished strong and above its "max buy" level but volume was only +20% above average behind today's gain for a new 52-week high. Color code is changed to green. Recent gains lacked volume after it found support near its 50 DMA line while building on a riskier "late-stage" base pattern. Gains backed by at least +40% above average volume while rallying above the pivot point may trigger a technical buy signal.
>>> FEATURED STOCK ARTICLE : Gains for New Highs Lacked Substantial Volume Conviction - 5/19/2015 |
View all notes |
Set NEW NOTE alert |
Company Profile |
SEC
News |
Chart |
Request a new note
C
A
S
I |
AMBA
-
NASDAQ
Ambarella Inc
ELECTRONICS - Semiconductor - Specialized
|
$89.88
|
+2.68
3.07% |
$90.77
|
2,670,892
209.48% of 50 DAV
50 DAV is 1,275,000
|
$87.25
3.01%
|
5/1/2015
|
$75.99
|
PP = $77.49
|
|
MB = $81.36
|
Most Recent Note - 5/27/2015 12:20:35 PM
G - Hitting yet another new all-time high today while adding to a spurt of volume-driven gains, getting more extended from its prior base. Prior highs in the $77 area define initial support to watch on pullbacks.
>>> FEATURED STOCK ARTICLE : Did Not Trigger New Buy Signal But Found Support Near 50 Day Moving Average - 5/12/2015 |
View all notes |
Set NEW NOTE alert |
Company Profile |
SEC
News |
Chart |
Request a new note
C
A
S
I |
ACHC
-
NASDAQ
Acadia Healthcare Inc
HEALTH SERVICES - Specialized Health Services
|
$73.85
|
+4.69
6.78% |
$75.16
|
1,568,548
292.09% of 50 DAV
50 DAV is 537,000
|
$74.09
-0.32%
|
5/27/2015
|
$73.90
|
PP = $74.19
|
|
MB = $77.90
|
Most Recent Note - 5/27/2015 6:23:15 PM
Y - Finished the session below the new pivot point cited based on its 4/13/15 high plus 10 cents after highlighted in yellow in the earlier mid-day report. Rallied today from below its 50 DMA line to hit a new 52-week high with nearly 3 times average volume. A strong gain above the pivot point with at least +40% above average volume is needed to trigger a proper technical buy signal. See the latest FSU analysis for more details and an annotated graph.
>>> FEATURED STOCK ARTICLE : Finished Below Pivot Point Despite Big Volume-Driven Gain and New 52-Week High - 5/27/2015 |
View all notes |
Set NEW NOTE alert |
Company Profile |
SEC
News |
Chart |
Request a new note
C
A
S
I |
AKAM
-
NASDAQ
Akamai Technologies Inc
INTERNET - Internet Software and Services
|
$77.74
|
+0.82
1.06% |
$78.09
|
1,201,368
86.55% of 50 DAV
50 DAV is 1,388,000
|
$78.44
-0.89%
|
4/20/2015
|
$73.53
|
PP = $73.63
|
|
MB = $77.31
|
Most Recent Note - 5/26/2015 5:41:52 PM
G - Still quietly consolidating near its 52-week high with volume-totals cooling. Reported earnings +5% on +16% sales revenues for the Mar '15 quarter, below the +25% minimum earnings guideline (C criteria), a fundamental flaw making it a less favorable buy candidate. Prior reports cautioned - "It did not produce gains above the pivot point backed by at least the +40% above average volume necessary to trigger a new (or add-on) technical buy signal. Its 50 DMA line defines near-term support to watch."
>>> FEATURED STOCK ARTICLE : Fundamental Flaw Raised Recent Concerns - 5/21/2015 |
View all notes |
Set NEW NOTE alert |
Company Profile |
SEC
News |
Chart |
Request a new note
C
A
S
I |
APOG
-
NASDAQ
Apogee Enterprises
MATERIALS and CONSTRUCTION - General Building Materials
|
$54.01
|
+0.85
1.60% |
$54.34
|
120,298
49.71% of 50 DAV
50 DAV is 242,000
|
$57.18
-5.54%
|
4/9/2015
|
$49.58
|
PP = $48.13
|
|
MB = $50.54
|
Most Recent Note - 5/26/2015 5:43:20 PM
G - Consolidating quietly after wedging higher for new 52-week highs without forming a sound base. Its 50 DMA line ($50.33) and prior highs define important support to watch on pullbacks.
>>> FEATURED STOCK ARTICLE : Wedged to New Highs Without Forming a Proper New Base - 5/20/2015 |
View all notes |
Set NEW NOTE alert |
Company Profile |
SEC
News |
Chart |
Request a new note
C
A
S
I |
Symbol/Exchange
Company Name
Industry Group |
PRICE |
CHANGE
(%Change) |
Day High |
Volume
(% DAV)
(% 50 day avg vol) |
52 Wk Hi
% From Hi |
Featured
Date |
Price
Featured |
Pivot Featured |
|
Max Buy |
JLL
-
NYSE
Jones Lang Lasalle Inc
REAL ESTATE - Property Management/Developmen
|
$173.51
|
+0.77
0.45% |
$173.70
|
480,370
158.54% of 50 DAV
50 DAV is 303,000
|
$174.83
-0.76%
|
2/3/2015
|
$156.95
|
PP = $154.66
|
|
MB = $162.39
|
Most Recent Note - 5/26/2015 5:35:59 PM
G - Volume-drive gain today for its second-best close ever. Consolidating above its 50 DMA line. It has not formed a sound new base, but little resistance remains due to overhead supply. Earnings rose +147% on +16% sales revenues for the Mar '15 quarter.
>>> FEATURED STOCK ARTICLE : Rebounded Near 50 Day Moving Average Line - 5/13/2015 |
View all notes |
Set NEW NOTE alert |
Company Profile |
SEC
News |
Chart |
Request a new note
C
A
S
I |
LXFT
-
NYSE
Luxoft Holding Inc Cl A
Comp Sftwr-Spec Enterprs
|
$52.98
|
+1.07
2.06% |
$53.04
|
126,657
70.37% of 50 DAV
50 DAV is 180,000
|
$57.30
-7.54%
|
5/26/2015
|
$51.90
|
PP = $57.40
|
|
MB = $60.27
|
Most Recent Note - 5/27/2015 6:35:23 PM
Y - Finished near the session high today and just above its 50 DMA line with a gain on lighter volume. Subsequent volume-driven gains above the pivot point are needed to trigger a proper technical buy signal. Reported earnings +28% on +29% sales revenues for the Mar '15 quarter, helping its quarterly and annual earnings history (C and A criteria) better match the guidelines of the fact-based investment system. Made gradual progress following the previously noted "breakaway gap" on 2/12/15. See the latest FSU analysis for more details and an annotated graph.
>>> FEATURED STOCK ARTICLE : Gains For News Highs Still Needed to Trigger Technical Buy Signal - 5/26/2015 |
View all notes |
Set NEW NOTE alert |
Company Profile |
SEC
News |
Chart |
Request a new note
C
A
S
I |
PANW
-
NYSE
Palo Alto Networks
Computer Sftwr-Security
|
$160.65
|
-3.19
-1.95% |
$164.00
|
4,024,820
339.07% of 50 DAV
50 DAV is 1,187,000
|
$165.09
-2.69%
|
3/27/2015
|
$146.44
|
PP = $149.45
|
|
MB = $156.92
|
Most Recent Note - 5/27/2015 12:37:05 PM
G - Pulling back today following a streak of 8 consecutive gains on ever-increasing volume, getting extended from its prior base. The 50 DMA line ($149.43) defines important near-term support where a violation would raise concerns and trigger a technical sell signal.
>>> FEATURED STOCK ARTICLE : Found Support at 50-Day Moving Average During Ongoing Ascent - 5/11/2015 |
View all notes |
Set NEW NOTE alert |
Company Profile |
SEC
News |
Chart |
Request a new note
C
A
S
I |
|
|
|
THESE ARE NOT BUY RECOMMENDATIONS!
Comments contained in the body of this report are technical
opinions only. The material herein has been obtained
from sources believed to be reliable and accurate, however,
its accuracy and completeness cannot be guaranteed.
This site is not an investment advisor, hence it does
not endorse or recommend any securities or other investments.
Any recommendation contained in this report may not
be suitable for all investors and it is not to be deemed
an offer or solicitation on our part with respect to
the purchase or sale of any securities. All trademarks,
service marks and trade names appearing in this report
are the property of their respective owners, and are
likewise used for identification purposes only.
This report is a service available
only to active Paid Premium Members.
You may opt-out of receiving report notifications
at any time. Questions or comments may be submitted
by writing to Premium Membership Services 665 S.E. 10 Street, Suite 201 Deerfield Beach, FL 33441-5634 or by calling 1-800-965-8307
or 954-785-1121.
|
|
|