***Last / Change / Volume data in this table is the closing quote data***
Symbol/Exchange
Company Name
Industry Group |
PRICE |
CHANGE
(%Change) |
Day High |
Volume
(% DAV)
(% 50 day avg vol) |
52 Wk Hi
% From Hi |
Featured
Date |
Price
Featured |
Pivot Featured |
|
Max Buy |
OSBC
-
NASDAQ
Old Second Bancorp Inc
BANKING - Regional - Midwest Banks
|
$14.95
|
+0.05
0.34% |
$15.10
|
57,200
72.13% of 50 DAV
50 DAV is 79,300
|
$15.60
-4.17%
|
5/21/2018
|
$15.50
|
PP = $15.10
|
|
MB = $15.86
|
 Most Recent Note - 7/6/2018 6:18:37 PM
Y - Volume totals have been light this week while consolidating near its 50 DMA line ($14.85). Its prior low ($14) and 200 DMA line define the next important support level. Stalled after highlighted in yellow on 5/21/18 with pivot point cited based on prior highs plus 10 cents. Fundamentals remain strong.
>>> FEATURED STOCK ARTICLE : Hit New High Today After Orderly Consolidation - 5/21/2018 |
View all notes |
Set NEW NOTE alert |
Company Profile |
SEC
News |
Chart |
Request a new note
C
A
S
I |
PFBC
-
NASDAQ
Preferred Bank Los Angls
BANKING - Regional - Pacific Banks
|
$67.58
|
-1.04
-1.52% |
$68.15
|
420,453
276.61% of 50 DAV
50 DAV is 152,000
|
$69.48
-2.73%
|
5/18/2018
|
$62.91
|
PP = $67.75
|
|
MB = $71.14
|
Most Recent Note - 7/6/2018 12:19:12 PM
Y - Pulling back today after hitting new all-time highs with a spurt of 3 consecutive volume-driven gains. Recent low ($61.14) defines near-term support where more damaging losses would raise serious concerns. Relative Strength Rating has improved to 77, but remains below the 80+ minimum guideline for buy candidates. See the latest FSU analysis for more details and an annotated graph.
>>> FEATURED STOCK ARTICLE : Volume-Driven Gains Hit New All-Time High - 7/3/2018 |
View all notes |
Set NEW NOTE alert |
Company Profile |
SEC
News |
Chart |
Request a new note
C
A
S
I |
SIVB
-
NASDAQ
S V B Financial Group
BANKING - Regional - Pacific Banks
|
$295.42
|
+3.97
1.36% |
$296.98
|
407,845
75.11% of 50 DAV
50 DAV is 543,000
|
$329.65
-10.38%
|
3/12/2018
|
$267.79
|
PP = $263.19
|
|
MB = $276.35
|
Most Recent Note - 7/2/2018 6:26:23 PM
G - A rebound above the 50 DMA line ($309) is needed for its outlook to improve following damaging volume-driven losses. Fundamentals are strong.
>>> FEATURED STOCK ARTICLE : Wedging Higher Following Big Breakaway Gap - 5/22/2018 |
View all notes |
Set NEW NOTE alert |
Company Profile |
SEC
News |
Chart |
Request a new note
C
A
S
I |
UCFC
-
NASDAQ
United Community Finl Cp
BANKING - Savings and Loans
|
$11.24
|
-0.04
-0.35% |
$11.34
|
91,367
50.48% of 50 DAV
50 DAV is 181,000
|
$11.59
-3.02%
|
5/30/2018
|
$10.50
|
PP = $10.80
|
|
MB = $11.34
|
Most Recent Note - 6/28/2018 12:36:22 PM
Y - Consolidating and still well above the prior high ($10.70 on 4/19/18) and its 50 DMA line ($10.64) defining near-term support to watch.
>>> FEATURED STOCK ARTICLE : Small Savings & Loan Perched Near High - 5/30/2018 |
View all notes |
Set NEW NOTE alert |
Company Profile |
SEC
News |
Chart |
Request a new note
C
A
S
I |
EPAM
-
NYSE
Epam Systems Inc
COMPUTER SOFTWARE and SERVICES - Information Technology Service
|
$128.26
|
+4.45
3.59% |
$128.80
|
489,261
111.96% of 50 DAV
50 DAV is 437,000
|
$131.75
-2.65%
|
7/5/2018
|
$123.70
|
PP = $131.85
|
|
MB = $138.44
|
Most Recent Note - 7/5/2018 1:05:28 PM
Y - Color code is changed to yellow with new pivot point cited based on its 5/11/18 high plus 10 cents. Consolidating near its 50 DMA line ($122.55). Subsequent volume-driven gains above the pivot point may trigger a new (or add-on) technical buy signal. Damaging losses below the recent low ($118.34 on 6/25/18) would raise serious concerns.
>>> FEATURED STOCK ARTICLE : Sputtering Below 50-Day Average After Negating Prior Breakout - 6/27/2018 |
View all notes |
Set NEW NOTE alert |
Company Profile |
SEC
News |
Chart |
Request a new note
C
A
S
I |
Symbol/Exchange
Company Name
Industry Group |
PRICE |
CHANGE
(%Change) |
Day High |
Volume
(% DAV)
(% 50 day avg vol) |
52 Wk Hi
% From Hi |
Featured
Date |
Price
Featured |
Pivot Featured |
|
Max Buy |
FLT
-
NYSE
Fleetcor Technologies
DIVERSIFIED SERVICES - Business/Management Services
|
$216.79
|
+2.62
1.22% |
$217.95
|
570,930
45.17% of 50 DAV
50 DAV is 1,264,000
|
$222.92
-2.75%
|
6/18/2018
|
$219.31
|
PP = $213.84
|
|
MB = $224.53
|
Most Recent Note - 7/5/2018 1:12:19 PM
Y - Volume totals have been cooling while consolidating in a tight range above its 50 DMA line ($206.63). Perched within striking distance of its 52-week high.
>>> FEATURED STOCK ARTICLE : Breakaway Gap With Heavy Volume - 6/18/2018 |
View all notes |
Set NEW NOTE alert |
Company Profile |
SEC
News |
Chart |
Request a new note
C
A
S
I |
MA
-
NYSE
Mastercard Inc Cl A
Finance-CrdtCard/PmtPr
|
$199.52
|
+0.90
0.45% |
$200.26
|
2,047,437
59.59% of 50 DAV
50 DAV is 3,436,000
|
$204.00
-2.20%
|
5/2/2018
|
$184.96
|
PP = $183.83
|
|
MB = $193.02
|
Most Recent Note - 7/5/2018 1:17:01 PM
G - Encountered distributional pressure after a recent "3-weeks tight" and it is now quietly consolidating above its 50 DMA line (193.15). Below that short-term average the prior low ($186.60 on 5/29/18) defines the next important support to watch.
>>> FEATURED STOCK ARTICLE : Extended From Prior Base and Perched at All-Time High - 6/20/2018 |
View all notes |
Set NEW NOTE alert |
Company Profile |
SEC
News |
Chart |
Request a new note
C
A
S
I |
V
-
NYSE
Visa Inc Cl A
Finance-CrdtCard/PmtPr
|
$134.09
|
+0.80
0.60% |
$134.28
|
4,837,221
67.99% of 50 DAV
50 DAV is 7,115,000
|
$136.69
-1.90%
|
4/26/2018
|
$126.68
|
PP = $126.98
|
|
MB = $133.33
|
Most Recent Note - 7/2/2018 6:29:00 PM
Y - Color code is changed to yellow while consolidating below its "max buy" level. Finding support above its 50 DMA line ($131) and above prior highs in the $126 area.
>>> FEATURED STOCK ARTICLE : Encountered Distributional Pressure at All-Time High - 6/11/2018 |
View all notes |
Set NEW NOTE alert |
Company Profile |
SEC
News |
Chart |
Request a new note
C
A
S
I |
BRKS
-
NASDAQ
Brooks Automation
ELECTRONICS - Semiconductor Equipment and Mate
|
$34.41
|
+0.71
2.11% |
$34.50
|
514,837
74.51% of 50 DAV
50 DAV is 691,000
|
$36.45
-5.60%
|
6/15/2018
|
$35.44
|
PP = $34.87
|
|
MB = $36.61
|
Most Recent Note - 7/2/2018 6:15:00 PM
Y - Posted a gain today with light volume. Stalled after featured in the 6/15/18 mid-day report as it clinched a technical buy signal. Disciplined investors always limit losses by selling any stock that falls more than -7% from their purchase price.
>>> FEATURED STOCK ARTICLE : Volume Was Heavy Behind Big Breakout Gain - 6/15/2018 |
View all notes |
Set NEW NOTE alert |
Company Profile |
SEC
News |
Chart |
Request a new note
C
A
S
I |
ENV
-
NYSE
Envestnet Inc
FINANCIAL SERVICES - Diversified Investments
|
$58.65
|
+1.70
2.99% |
$58.75
|
227,228
61.91% of 50 DAV
50 DAV is 367,000
|
$60.28
-2.70%
|
6/15/2018
|
$57.85
|
PP = $60.37
|
|
MB = $63.39
|
Most Recent Note - 7/6/2018 6:05:54 PM
Y - Color code is changed to yellow while consolidating above its 50 DMA line ($56.08) and perched within close striking distance of its pivot point. Subsequent volume-driven gains for new highs may trigger a technical buy signal. The recent low ($53.75 on 6/28/18) and 200 DMA line define important near-term support.
>>> FEATURED STOCK ARTICLE : Gain With Above Average Volume Challenged Prior High - 6/19/2018 |
View all notes |
Set NEW NOTE alert |
Company Profile |
SEC
News |
Chart |
Request a new note
C
A
S
I |
Symbol/Exchange
Company Name
Industry Group |
PRICE |
CHANGE
(%Change) |
Day High |
Volume
(% DAV)
(% 50 day avg vol) |
52 Wk Hi
% From Hi |
Featured
Date |
Price
Featured |
Pivot Featured |
|
Max Buy |
TPL
-
NYSE
Texas Pacific Land Trust
Real Estate Dvlpmt/Ops
|
$719.95
|
+5.05
0.71% |
$730.53
|
26,459
139.26% of 50 DAV
50 DAV is 19,000
|
$739.89
-2.69%
|
7/5/2018
|
$714.90
|
PP = $739.99
|
|
MB = $776.99
|
Most Recent Note - 7/6/2018 12:23:51 PM
Y - Perched within close striking distance of its all-time high. Color code was changed to yellow with new pivot point cited based on its 6/04/18 high plus 10 cents. Subsequent volume-driven gains for new highs may trigger a new (or add-on) technical buy signal. Volume totals have still been cooling while stubbornly holding its ground perched near its all-time high. Its 50 DMA line ($673) defines important near-term support to watch on pullbacks.
>>> FEATURED STOCK ARTICLE : Negative Reversal on Higher Volume After Hitting New All-Time High - 6/4/2018 |
View all notes |
Set NEW NOTE alert |
Company Profile |
SEC
News |
Chart |
Request a new note
C
A
S
I |
STMP
-
NASDAQ
Stamps.com Inc
Retail-Internet
|
$269.40
|
+5.10
1.93% |
$270.80
|
166,102
54.28% of 50 DAV
50 DAV is 306,000
|
$285.75
-5.72%
|
5/4/2018
|
$234.15
|
PP = $233.23
|
|
MB = $244.89
|
Most Recent Note - 7/5/2018 1:59:01 PM
G - Has not formed a sound base, yet it found support at its 50 DMA line ($251). Below that important short-term average prior highs in the $233 area define support to watch on pullbacks.
>>> FEATURED STOCK ARTICLE : Big Loss on Heavy Volume Tests 50-Day Moving Average - 6/21/2018 |
View all notes |
Set NEW NOTE alert |
Company Profile |
SEC
News |
Chart |
Request a new note
C
A
S
I |
CHDN
-
NASDAQ
Churchill Downs Inc
LEISURE - Gaming Activities
|
$302.85
|
+4.45
1.49% |
$305.90
|
49,916
48.94% of 50 DAV
50 DAV is 102,000
|
$314.60
-3.73%
|
6/20/2018
|
$285.80
|
PP = $314.70
|
|
MB = $330.44
|
Most Recent Note - 6/29/2018 5:41:17 PM
Y - Quietly consolidating near its 50 DMA line ($291.83) Below that important short-term average the prior high ($285.70 on 4/26/18) defines the next important support to watch. A new pivot point was cited based on its 5/16/18 high plus 10 cents. Subsequent volume-driven gains for a new high are needed to trigger a new (or add-on) technical buy signal. See the latest FSU analysis for more details and a new annotated graph.
>>> FEATURED STOCK ARTICLE : Consolidating Near 50-Day Moving Average - 6/29/2018 |
View all notes |
Set NEW NOTE alert |
Company Profile |
SEC
News |
Chart |
Request a new note
C
A
S
I |
HTHT
-
NASDAQ
Huazhu Group Ads
LEISURE - Lodging
|
$42.12
|
+1.89
4.70% |
$42.41
|
2,393,102
104.91% of 50 DAV
50 DAV is 2,281,000
|
$49.60
-15.08%
|
5/15/2018
|
$34.52
|
PP = $41.57
|
|
MB = $43.65
|
Most Recent Note - 7/2/2018 6:20:40 PM
G - Undercut its 50 DMA line ($42.08) today while testing prior highs in the $40-41 area. Recently changed its name from China Lodging Group, Ltd to Huazhu Group Ltd. See the latest FSU analysis for more details and a new annotated graph.
>>> FEATURED STOCK ARTICLE : At Prior High and Slumping Below 50-Day Average After 4:1 Split - 7/2/2018 |
View all notes |
Set NEW NOTE alert |
Company Profile |
SEC
News |
Chart |
Request a new note
C
A
S
I |
NFLX
-
NASDAQ
Netflix Inc
SPECIALTY RETAIL - Music and Video Stores
|
$408.25
|
+9.86
2.47% |
$408.65
|
8,522,828
95.71% of 50 DAV
50 DAV is 8,905,000
|
$423.21
-3.53%
|
5/24/2018
|
$348.85
|
PP = $338.92
|
|
MB = $355.87
|
Most Recent Note - 7/6/2018 12:15:58 PM
G - Hovering near its all-time high, extended from any sound base. Its 50 DMA line ($358) defines near-term support to watch above the prior high ($338.82 on 4/18/18).
>>> FEATURED STOCK ARTICLE : Rally From Advanced Ascending Base With Volume +50% - 5/24/2018 |
View all notes |
Set NEW NOTE alert |
Company Profile |
SEC
News |
Chart |
Request a new note
C
A
S
I |
Symbol/Exchange
Company Name
Industry Group |
PRICE |
CHANGE
(%Change) |
Day High |
Volume
(% DAV)
(% 50 day avg vol) |
52 Wk Hi
% From Hi |
Featured
Date |
Price
Featured |
Pivot Featured |
|
Max Buy |
DPZ
-
NYSE
Dominos Pizza Inc
Retail-Restaurants
|
$279.15
|
+1.41
0.51% |
$280.89
|
481,957
80.46% of 50 DAV
50 DAV is 599,000
|
$293.81
-4.99%
|
5/21/2018
|
$248.13
|
PP = $255.10
|
|
MB = $267.86
|
Most Recent Note - 7/2/2018 6:31:07 PM
G - Volume totals have been cooling. It is still very extended from the latest base. Its 50 DMA line ($259.83) and prior high ($255 on 4/26/18) define near-term support to watch.
>>> FEATURED STOCK ARTICLE : New High With Gain Backed by Above Average Volume - 6/5/2018 |
View all notes |
Set NEW NOTE alert |
Company Profile |
SEC
News |
Chart |
Request a new note
C
A
S
I |
FIVE
-
NASDAQ
Five Below Inc
Retail-DiscountandVariety
|
$98.90
|
+0.78
0.79% |
$99.32
|
624,984
44.77% of 50 DAV
50 DAV is 1,396,000
|
$103.99
-4.89%
|
7/6/2018
|
$98.90
|
PP = $104.09
|
|
MB = $109.29
|
Most Recent Note - 7/6/2018 6:11:56 PM
Y - Color code is changed to yellow after a tight consolidation with new pivot point cited base on its 6/13/18 high plus 10 cents. Volume totals have still been cooling. Subsequent volume-driven gains for new highs may trigger a new (or add-on) technical buy signal. Reported earnings +133% on +27% sales revenues for the Apr '18 quarter.
>>> FEATURED STOCK ARTICLE : Hovering Near Record High After Big Gap Up and Volume-Driven Gain - 6/25/2018 |
View all notes |
Set NEW NOTE alert |
Company Profile |
SEC
News |
Chart |
Request a new note
C
A
S
I |
NOW
-
NYSE
Servicenow Inc
Computer Sftwr-Enterprse
|
$182.16
|
+2.73
1.52% |
$183.28
|
781,318
43.72% of 50 DAV
50 DAV is 1,787,000
|
$188.59
-3.41%
|
5/8/2018
|
$174.63
|
PP = $176.66
|
|
MB = $185.49
|
Most Recent Note - 7/2/2018 6:24:30 PM
Y - Color code is changed to yellow after a rebound above the 50 DMA line ($175) helped its outlook improve. The recent low ($167) defines important near-term support.
>>> FEATURED STOCK ARTICLE : Recent Slump Below 50-Day Average Hurt Outlook - 6/26/2018 |
View all notes |
Set NEW NOTE alert |
Company Profile |
SEC
News |
Chart |
Request a new note
C
A
S
I |
NVEE
-
NASDAQ
N V 5 Global Inc
Comml Svcs-Consulting
|
$73.45
|
+1.15
1.59% |
$74.53
|
36,180
49.56% of 50 DAV
50 DAV is 73,000
|
$72.65
1.10%
|
6/15/2018
|
$7,070.00
|
PP = $72.00
|
|
MB = $75.60
|
Most Recent Note - 7/5/2018 2:02:08 PM
Y - Quietly matched its all-time high with today's gain. Confirming gains above the pivot point backed by at least +40% above average volume may trigger a technical buy signal. Its 50 DMA line ($63.71) defines near-term support above the prior low ($56.65 on 5/15/18).
>>> FEATURED STOCK ARTICLE : Holding its Ground in Tight Range Near All-Time High - 6/28/2018 |
View all notes |
Set NEW NOTE alert |
Company Profile |
SEC
News |
Chart |
Request a new note
C
A
S
I |
PANW
-
NYSE
Palo Alto Networks
Computer Sftwr-Security
|
$211.16
|
+2.69
1.29% |
$212.20
|
708,556
53.52% of 50 DAV
50 DAV is 1,324,000
|
$217.40
-2.87%
|
6/12/2018
|
$206.55
|
PP = $214.69
|
|
MB = $225.42
|
Most Recent Note - 7/5/2018 1:48:36 PM
Y - Volume totals have been cooling while consolidating above its 50 DMA line ($204.09). The prior low ($195.78 on 6/07/18) defines the next important support level.
>>> FEATURED STOCK ARTICLE : New High Close After 2 Consecutive Volume Driven Gains - 6/13/2018 |
View all notes |
Set NEW NOTE alert |
Company Profile |
SEC
News |
Chart |
Request a new note
C
A
S
I |
Symbol/Exchange
Company Name
Industry Group |
PRICE |
CHANGE
(%Change) |
Day High |
Volume
(% DAV)
(% 50 day avg vol) |
52 Wk Hi
% From Hi |
Featured
Date |
Price
Featured |
Pivot Featured |
|
Max Buy |
QLYS
-
NASDAQ
Qualys Inc
Computer Sftwr-Security
|
$89.30
|
+1.25
1.42% |
$89.75
|
258,066
73.11% of 50 DAV
50 DAV is 353,000
|
$97.75
-8.64%
|
4/17/2018
|
$82.85
|
PP = $79.50
|
|
MB = $83.48
|
Most Recent Note - 7/5/2018 1:51:20 PM
G - Quietly consolidating above the prior high ($85.00 on 4/18/18) which defines initial support above its 50 DMA line ($81.63).
>>> FEATURED STOCK ARTICLE : Rebounded Above 50-Day Average Yet Still Faces Overhead Supply - 5/29/2018 |
View all notes |
Set NEW NOTE alert |
Company Profile |
SEC
News |
Chart |
Request a new note
C
A
S
I |
SPLK
-
NASDAQ
Splunk Inc
Computer Sftwr-Database
|
$101.38
|
+2.40
2.42% |
$101.81
|
1,029,653
55.12% of 50 DAV
50 DAV is 1,868,000
|
$121.64
-16.66%
|
5/8/2018
|
$113.14
|
PP = $112.76
|
|
MB = $118.40
|
Most Recent Note - 7/5/2018 1:55:45 PM
G - Quietly consolidating near prior lows in the $96-97 area which define near-term support above its 200 DMA line ($91.55). A rebound above the 50 DMA line (110.32) is needed for its outlook to improve.
>>> FEATURED STOCK ARTICLE : Consolidating Near High Following Latest Financial Report - 5/31/2018 |
View all notes |
Set NEW NOTE alert |
Company Profile |
SEC
News |
Chart |
Request a new note
C
A
S
I |
SUPN
-
NASDAQ
Supernus Pharmaceuticals
Medical-Biomed/Biotech
|
$52.40
|
+1.20
2.34% |
$52.95
|
690,824
81.95% of 50 DAV
50 DAV is 843,000
|
$61.25
-14.45%
|
6/20/2018
|
$58.05
|
PP = $59.15
|
|
MB = $62.11
|
Most Recent Note - 7/3/2018 11:35:58 AM
Y - Abruptly retreated from its all-time high hit with a volume-driven gain on Friday, slumping to the 50 DMA line ($53.79) and prior low ($53.10 on 6/14/18) defining important near-term support. Disciplined investors always limit losses by selling any stock that falls more than -7% from their purchase price.
>>> FEATURED STOCK ARTICLE : Extended From Prior Base After Spiking Higher - 6/6/2018 |
View all notes |
Set NEW NOTE alert |
Company Profile |
SEC
News |
Chart |
Request a new note
C
A
S
I |
GRUB
-
NYSE
Grubhub Inc
INTERNET - Content
|
$108.30
|
+2.02
1.90% |
$109.26
|
1,380,085
79.68% of 50 DAV
50 DAV is 1,732,000
|
$120.07
-9.80%
|
5/30/2018
|
$107.56
|
PP = $105.68
|
|
MB = $110.96
|
Most Recent Note - 7/2/2018 6:18:25 PM
Y - Color code is changed to yellow as it posted a gain today with light volume and finished above its 50 DMA line ($104.81). Recent lows in the $101 area define important near-term support to watch.
>>> FEATURED STOCK ARTICLE : Gain With +25% Above Average Volume for Best Ever Close - 6/12/2018 |
View all notes |
Set NEW NOTE alert |
Company Profile |
SEC
News |
Chart |
Request a new note
C
A
S
I |
HQY
-
NASDAQ
Healthequity Inc
COMPUTER SOFTWARE and SERVICES - Healthcare Information Service
|
$78.55
|
+0.75
0.96% |
$79.34
|
352,813
64.74% of 50 DAV
50 DAV is 545,000
|
$82.04
-4.25%
|
5/2/2018
|
$66.31
|
PP = $68.85
|
|
MB = $72.29
|
Most Recent Note - 7/6/2018 6:13:21 PM
G - Found prompt support near its 50 DMA line ($75.05). More damaging losses would raise greater concerns. It has not formed a sound base.
>>> FEATURED STOCK ARTICLE : Pullback After Volume-Driven Gains For New Highs - 6/7/2018 |
View all notes |
Set NEW NOTE alert |
Company Profile |
SEC
News |
Chart |
Request a new note
C
A
S
I |
Symbol/Exchange
Company Name
Industry Group |
PRICE |
CHANGE
(%Change) |
Day High |
Volume
(% DAV)
(% 50 day avg vol) |
52 Wk Hi
% From Hi |
Featured
Date |
Price
Featured |
Pivot Featured |
|
Max Buy |
LOB
-
NASDAQ
Live Oak Bancshares Inc
Banks-Southeast
|
$32.30
|
+0.40
1.25% |
$32.30
|
77,967
60.91% of 50 DAV
50 DAV is 128,000
|
$31.95
1.10%
|
5/21/2018
|
$29.35
|
PP = $30.15
|
|
MB = $31.66
|
Most Recent Note - 7/6/2018 6:16:35 PM
G - Hit a new high with light volume behind today's 6th consecutive gain and its color code is changed to green after rising above its "max buy" level. Near term support to watch is at its 50 DMA line ($29.79).
>>> FEATURED STOCK ARTICLE : Bank Perched Near High After Orderly Base - 5/23/2018 |
View all notes |
Set NEW NOTE alert |
Company Profile |
SEC
News |
Chart |
Request a new note
C
A
S
I |
PYPL
-
NASDAQ
Paypal Holdings Inc
Finance-CrdtCard/PmtPr
|
$85.94
|
+1.35
1.60% |
$86.00
|
5,083,902
62.23% of 50 DAV
50 DAV is 8,170,000
|
$87.55
-1.84%
|
5/18/2018
|
$81.63
|
PP = $80.89
|
|
MB = $84.93
|
Most Recent Note - 7/6/2018 6:21:44 PM
Y - Finished near its all-time high with today's gain backed by light volume. Found support at its 50 DMA line ($81.11). Disciplined investors will note that since featured on 5/18/18 it has not posted confirming gains above the pivot point backed by at least +40% above average volume to confirm a proper technical buy signal.
>>> FEATURED STOCK ARTICLE : Gains Have Lacked Volume While Approaching All-Time High - 6/8/2018 |
View all notes |
Set NEW NOTE alert |
Company Profile |
SEC
News |
Chart |
Request a new note
C
A
S
I |
OLLI
-
NASDAQ
Ollie's Bargain Outlet
Retail-DiscountandVariety
|
$74.25
|
+1.40
1.92% |
$74.70
|
521,767
60.81% of 50 DAV
50 DAV is 858,000
|
$77.50
-4.19%
|
4/10/2018
|
$62.05
|
PP = $62.15
|
|
MB = $65.26
|
Most Recent Note - 7/5/2018 5:25:33 PM
G - Consolidating above its 50 DMA line ($69.98) which defines important near-term support to watch on pullbacks. See the latest FSU analysis for more details and a new annotated graph.
>>> FEATURED STOCK ARTICLE : Found Recent Support at 50-Day Moving Average Line - 7/5/2018 |
View all notes |
Set NEW NOTE alert |
Company Profile |
SEC
News |
Chart |
Request a new note
C
A
S
I |
MOMO
-
NASDAQ
Momo Inc Ads Cl A
INTERNET - Content
|
$46.44
|
+2.24
5.07% |
$46.69
|
4,056,975
84.36% of 50 DAV
50 DAV is 4,809,000
|
$54.24
-14.38%
|
6/1/2018
|
$48.62
|
PP = $46.79
|
|
MB = $49.13
|
Most Recent Note - 7/5/2018 1:20:44 PM
Y - Found support near its 50 DMA line ($43.52) after a slump below the old high ($46.69 on 8/08/17) and into the prior base raised concerns. Subsequent losses below the recent low ($41.11 on 6/27/18) would raise more serious concerns.
>>> FEATURED STOCK ARTICLE : Volume-Driven Gain for New All-Time High - 6/1/2018 |
View all notes |
Set NEW NOTE alert |
Company Profile |
SEC
News |
Chart |
Request a new note
C
A
S
I |
NOVT
-
NASDAQ
Novanta Inc
Elec-Scientific/Msrng
|
$64.95
|
+0.65
1.01% |
$65.25
|
137,582
65.20% of 50 DAV
50 DAV is 211,000
|
$68.00
-4.49%
|
4/17/2018
|
$60.55
|
PP = $60.40
|
|
MB = $63.42
|
Most Recent Note - 7/2/2018 6:22:58 PM
Y - Color code is changed to yellow after a gain on light volume rebounding above the 50 DMA line ($62.85) helped its outlook improve. The recent low ($59.25) defines important near-term support.
>>> FEATURED STOCK ARTICLE : Quietly Hovering Near All-Time High - 5/25/2018 |
View all notes |
Set NEW NOTE alert |
Company Profile |
SEC
News |
Chart |
Request a new note
C
A
S
I |
Symbol/Exchange
Company Name
Industry Group |
PRICE |
CHANGE
(%Change) |
Day High |
Volume
(% DAV)
(% 50 day avg vol) |
52 Wk Hi
% From Hi |
Featured
Date |
Price
Featured |
Pivot Featured |
|
Max Buy |
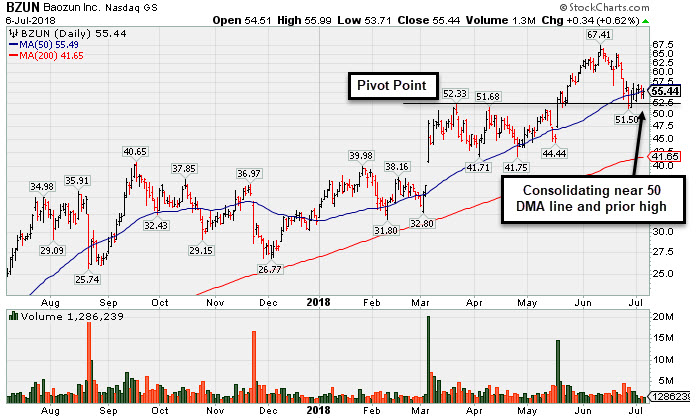
BZUN
-
NASDAQ
Baozun Inc Cl A Ads
Computer Sftwr-Enterprse
|
$55.44
|
+0.34
0.62% |
$55.99
|
1,285,531
50.47% of 50 DAV
50 DAV is 2,547,000
|
$67.41
-17.76%
|
5/15/2018
|
$45.38
|
PP = $52.43
|
|
MB = $55.05
|
Most Recent Note - 7/5/2018 12:56:28 PM
Y - Color code is changed to yellow while quietly pulling back below its "max buy" level. Found support near prior highs in the $52 area while consolidating near its 50 DMA line ($55.24). The recent low ($51.50 on 6/27/18) defines important near-term support.
>>> FEATURED STOCK ARTICLE : Found Support Near Prior Highs and 50 Day Moving Average - 7/6/2018 |
View all notes |
Set NEW NOTE alert |
Company Profile |
SEC
News |
Chart |
Request a new note
C
A
S
I |
SEND
-
NYSE
Sendgrid Inc
INTERNET - Content
|
$26.11
|
+0.05
0.19% |
$26.81
|
443,951
76.02% of 50 DAV
50 DAV is 584,000
|
$32.03
-18.47%
|
6/20/2018
|
$30.72
|
PP = $32.13
|
|
MB = $33.74
|
Most Recent Note - 7/5/2018 1:53:37 PM
G - Still sputtering below its 50 DMA line ($27.15). A rebound above the 50 DMA line is needed for its outlook to improve. Subsequent gains above the pivot point backed by at least +40% above average volume may trigger a new (or add-on) technical buy signal. Recent lows in the $23-24 area define important support to watch. Completed a new Public Offering and Secondary Offering on 4/05/18.
>>> FEATURED STOCK ARTICLE : Volume-Driven Gains Above 50-Day Average Help Outlook Improve - 6/14/2018 |
View all notes |
Set NEW NOTE alert |
Company Profile |
SEC
News |
Chart |
Request a new note
C
A
S
I |