You are not logged in.
This means you
CAN ONLY VIEW reports that were published prior to Thursday, April 17, 2025.
You
MUST UPGRADE YOUR MEMBERSHIP if you want to see any current reports.
AFTER MARKET UPDATE - MONDAY, MAY 24TH, 2021
Previous After Market Report Next After Market Report >>>
|
|
|
|
DOW |
+186.14 |
34,393.98 |
+0.54% |
|
Volume |
789,158,737 |
-18% |
|
Volume |
3,487,073,900 |
-5% |
|
NASDAQ |
+189.48 |
13,660.47 |
+1.41% |
|
Advancers |
2,126 |
65% |
|
Advancers |
2,098 |
51% |
|
S&P 500 |
+41.19 |
4,197.05 |
+0.99% |
|
Decliners |
1,141 |
35% |
|
Decliners |
2,044 |
49% |
|
Russell 2000 |
+12.07 |
2,227.34 |
+0.54% |
|
52 Wk Highs |
202 |
|
|
52 Wk Highs |
127 |
|
|
S&P 600 |
+6.17 |
1,349.63 |
+0.46% |
|
52 Wk Lows |
26 |
|
|
52 Wk Lows |
43 |
|
|
 |
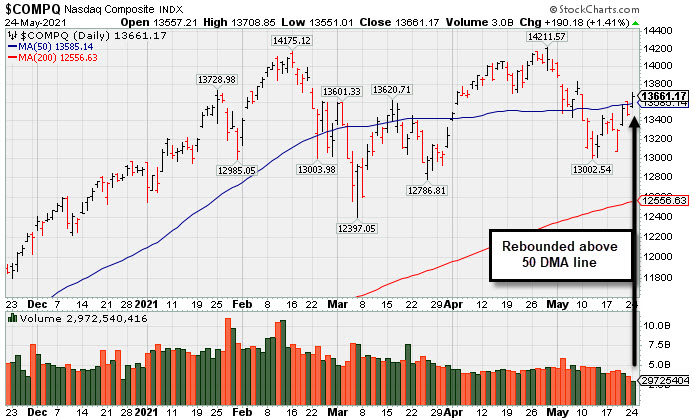
Major Indices Rose With Lighter Volume Totals
Kenneth J. Gruneisen - Passed the CAN SLIM® Master's Exam
The Dow climbed 186 points, while the S&P 500 jumped 1%, pushing the broad benchmark into positive month-to-date territory. The Nasdaq Composite rallied 1.4% amid strength in tech and mega-cap shares. Still, the Nasdaq is set to snap a six-month winning streak, its longest stretch of monthly gains since January 2018. The volume totals reported were lighter than the prior session on the NYSE and on the Nasdaq exchange. Advancers led decliners by almost a 2-1 margin on the NYSE, meanwhile the mix was nearly even on the Nasdaq exchange. There were 43 high-ranked companies from the Leaders List that hit new 52-week highs and were listed on the BreakOuts Page, versus 44 on the prior session. New 52-week highs totals outnumbered new 52-week lows totals on the NYSE and on the Nasdaq exchange. The major indices (M criteria) are still in an uptrend, but that trend has come under pressure in recent weeks. Investors are reminded to always make buying and selling decisions on case-by-case basis under the strict criteria and rules of the fact-based investment system.
PICTURED: The Nasdaq Composite Index rebounded above its 50-day moving average (DMA) line.
U.S. stocks finished firmly higher on Monday as worries surrounding prolonged inflation seemed to subside. Multiple Federal Reserve leaders, including Fed Governor Lael Brainard, reiterated the expected transitory nature of building price pressures.
Ten of 11 S&P 500 sectors closed in positive territory, with Communication Services and Technology shares pacing gains. In corporate news, Virgin Galactic Holdings (SPCE +27.62%) soared after conducting a spaceflight test for the first time in over two years. Elsewhere, Beyond Meat (BYND +10.00%) rose on the heels of a double upgrade from a street analyst. Meanwhile, AMC Entertainment Holdings (AMC +13.25%) rose after its largest shareholder, a Chinese conglomerate, sold the majority of its stake in the movie theater chain. Norwegian Cruise Line Holdings (NCLH +4.70%) rose following an announcement that the cruise operator would resume U.S. sailings this summer. In the M&A space, Cabot Oil & Gas (COG -6.79%) and Cimarex Energy (XEC -7.09%) agreed to an all-stock merger of equals worth $7.35 billion.
Treasuries strengthened slightly, with the yield on the 10-year note down two basis points to 1.60%. In commodities, WTI crude climbed 3.8% to $66.00/barrel, lifted by a bullish outlook from a Wall Street analyst and a potential hurdle in renewing the Iran nuclear deal. Elsewhere, bitcoin rebounded from a weekend sell-off. |
 Kenneth J. Gruneisen started out as a licensed stockbroker in August 1987, a couple of months prior to the historic stock market crash that took the Dow Jones Industrial Average down -22.6% in a single day. He has published daily fact-based fundamental and technical analysis on high-ranked stocks online for two decades. Through FACTBASEDINVESTING.COM, Kenneth provides educational articles, news, market commentary, and other information regarding proven investment systems that work in good times and bad.
Comments contained in the body of this report are technical opinions only and are not necessarily those of Gruneisen Growth Corp. The material herein has been obtained from sources believed to be reliable and accurate, however, its accuracy and completeness cannot be guaranteed. Our firm, employees, and customers may effect transactions, including transactions contrary to any recommendation herein, or have positions in the securities mentioned herein or options with respect thereto. Any recommendation contained in this report may not be suitable for all investors and it is not to be deemed an offer or solicitation on our part with respect to the purchase or sale of any securities. |
|
 |
Retail, Financial, Tech, and Commodity-Linked Groups Rose
Kenneth J. Gruneisen - Passed the CAN SLIM® Master's Exam
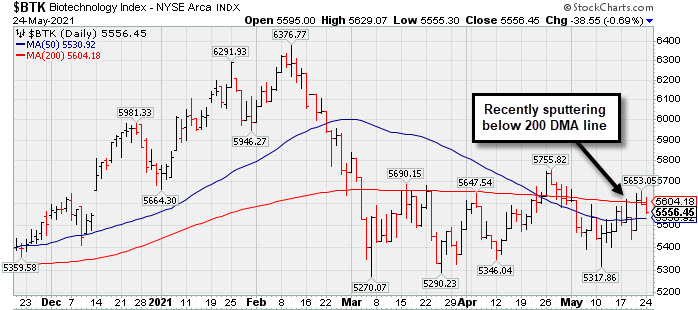
The Retail Index ($RLX +0.45%), Broker/Dealer Index ($XBD +0.28%), and Bank Index ($BKX +0.32%) each edged higher. The Semiconductor Index ($SOX +2.28%) and Networking Index ($NWX +1.01%) both posted solid gains while the Biotech Index ($BTK -0.69%) edged lower. The Gold & Silver Index ($XAU +0.57%), Oil Services Index ($OSX +0.23%), and Integrated Oil Index ($XOI +1.40%) each ended higher. PICTURED: The Biotech Index ($BTK -0.69%) has recently been sputtering below its 200-day moving average (DMA) line.
| Oil Services |
$OSX |
60.80 |
+0.14 |
+0.23% |
+37.15% |
| Integrated Oil |
$XOI |
1,082.56 |
+14.99 |
+1.40% |
+36.60% |
| Semiconductor |
$SOX |
3,121.78 |
+69.68 |
+2.28% |
+11.67% |
| Networking |
$NWX |
822.90 |
+8.22 |
+1.01% |
+14.75% |
| Broker/Dealer |
$XBD |
464.35 |
+1.28 |
+0.28% |
+22.97% |
| Retail |
$RLX |
3,794.16 |
+16.96 |
+0.45% |
+6.48% |
| Gold & Silver |
$XAU |
163.99 |
+0.93 |
+0.57% |
+13.73% |
| Bank |
$BKX |
132.72 |
+0.42 |
+0.32% |
+35.55% |
| Biotech |
$BTK |
5,556.45 |
-38.55 |
-0.69% |
-3.18% |
|
|
|
 |
Stalled and Found Support Above 50-Day Moving Average
Kenneth J. Gruneisen - Passed the CAN SLIM® Master's Exam
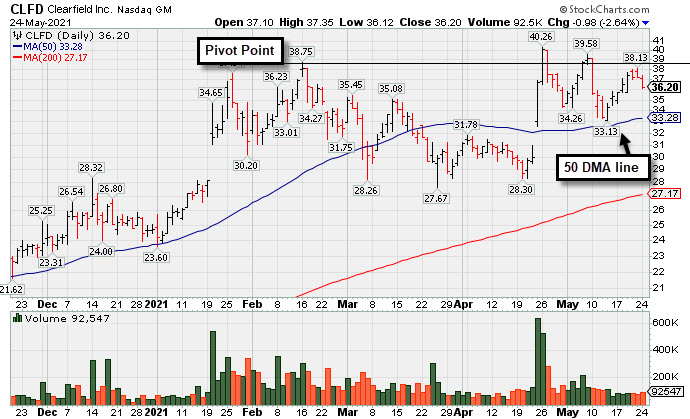
Clearfield Inc (CLFD -$0.98 or -2.64% to $36.20) has been consolidating in a choppy fashion but it made no further headway after highlighted in yellow with new pivot point cited based on its 2/16/21 high plus 10 cents in the 4/26/21 mid-day report (read here). Its 50-day moving average (DMA) line and recent low define important near term support to watch. More damaging losses would raise serious concerns.
Bullish action came after it reported Mar '21 quarterly earnings +440% on +45% sales revenues versus the year ago period, continuing its strong earnings track record. The high-ranked TELECOMMUNICATIONS - Fiber Optics firm has reported 5 consecutive quarterly earnings comparisons above the +25% minimum guideline (C criteria). Annual earnings (A criteria) history has improved after a downturn in FY '17.
CLFD traded up more than 75% since first highlighted in yellow with pivot point cited based on its 11/09/20 high plus 10 cents in the 11/17/20 mid-day report (read here). It found support near prior highs in the $28 area since dropped from the Featured Stocks list, showing resilience since last shown in this FSU section on 4/26/21 with an annotated graph under the headline, "Rallied Straight Up From Bottom of 10-Week Base".
The number of top-rated funds owning its shares rose from 132 in Jun '20 to 164 in Mar '21. Its current Up/Down Volume Ratio of 1.5 is an unbiased indication its shares have been under slight accumulation over the past 50 days. Its Accumulation/Distribution Rating is B- and Timeliness Rating is A, and its Sponsorship Rating is D.
|
|
|
Color Codes Explained :
Y - Better candidates highlighted by our
staff of experts.
G - Previously featured
in past reports as yellow but may no longer be buyable under the
guidelines.
***Last / Change / Volume data in this table is the closing quote data***
Symbol/Exchange
Company Name
Industry Group |
PRICE |
CHANGE
(%Change) |
Day High |
Volume
(% DAV)
(% 50 day avg vol) |
52 Wk Hi
% From Hi |
Featured
Date |
Price
Featured |
Pivot Featured |
|
Max Buy |
 ABCB
-
NASDAQ
ABCB
-
NASDAQ
Ameris Bancorp
BANKING - Regional - Mid-Atlantic Banks
|
$56.11
|
-2.41
-4.12% |
$59.85
|
627,545
132.39% of 50 DAV
50 DAV is 474,000
|
$59.60
-5.86%
|
5/21/2021
|
$58.86
|
PP = $57.91
|
|
MB = $60.81
|
 Most Recent Note - 5/24/2021 6:13:38 PM
Y - Abruptly reversed from its high and fell back into the prior base raising concerns as it closed near the session low with +27% above average volume behind today's big loss. Finished strong after highlighted in yellow in the 5/21/21 mid-day report while hitting new 52-week and all-time highs clearing an orderly base. Pivot point cited was based on the 3/18/21 high plus 10 cents. The gain and strong close above the pivot point clinched a convincing technical buy signal. Reported earnings +196% on +25% sales revenues for the Mar '21 quarter versus the year ago period, its 3rd consecutive quarterly comparison above the +25% minimum earnings guideline (C criteria). Annual earnings growth has been steady. Completed a new Public Offering on 3/01/17. See the latest FSU analysis for more details and an annotated graph.
>>> FEATURED STOCK ARTICLE : Breakout to New All-Time High for Another Regional Bank - 5/21/2021 |
View all notes |
Set NEW NOTE alert |
Company Profile |
SEC
News |
Chart |
Request a new note
C
A
S
I |
SIVB
-
NASDAQ
S V B Financial Group
BANKING - Regional - Pacific Banks
|
$575.26
|
+5.39
0.95% |
$579.80
|
267,790
49.50% of 50 DAV
50 DAV is 541,000
|
$595.90
-3.46%
|
4/23/2021
|
$579.70
|
PP = $577.16
|
|
MB = $606.02
|
Most Recent Note - 5/19/2021 3:03:05 PM
Y - Gapped down today, yet still hovering near its high. Confirming volume-driven gains are still needed to help clinch a convincing technical buy signal. Its 50 DMA line ($534) defines near-term support to watch. Reported earnings +293% on +64% sales revenues for the Mar '21 quarter versus the year ago period, its 3rd strong comparison. Completed a new Public Offering on 3/24/21.
>>> FEATURED STOCK ARTICLE : Sputtering Since Featured Without Confirming Gains - 5/20/2021 |
View all notes |
Set NEW NOTE alert |
Company Profile |
SEC
News |
Chart |
Request a new note
C
A
S
I |
CROX
-
NASDAQ
Crocs Inc
CONSUMER NON-DURABLES - Textile - Apparel Footwear
|
$101.90
|
+3.39
3.44% |
$102.90
|
769,121
55.09% of 50 DAV
50 DAV is 1,396,000
|
$109.91
-7.29%
|
4/27/2021
|
$99.81
|
PP = $86.50
|
|
MB = $90.83
|
Most Recent Note - 5/24/2021 6:10:08 PM
G - Still hovering near its all-time high with volume totals cooling, very extended from the latest base. Its 50 DMA line ($88.44) defines initial support above prior highs in the $86 area.
>>> FEATURED STOCK ARTICLE : Powerful "Breakaway Gap" for CROX - 4/27/2021 |
View all notes |
Set NEW NOTE alert |
Company Profile |
SEC
News |
Chart |
Request a new note
C
A
S
I |
RCKY
-
NASDAQ
Rocky Brands Inc
CONSUMER NON-DURABLES - Textile - Apparel Footwear
|
$53.17
|
+1.45
2.80% |
$53.73
|
59,829
64.33% of 50 DAV
50 DAV is 93,000
|
$69.00
-22.94%
|
5/5/2021
|
$61.65
|
PP = $61.55
|
|
MB = $64.63
|
Most Recent Note - 5/20/2021 5:46:07 PM
G - Slumping below its 50 DMA line ($54.73) this week with 3 consecutive damaging losses raising concerns. Only a prompt rebound above the 50 DMA line would help its outlook improve. Fundamentals remain strong.
>>> FEATURED STOCK ARTICLE : Rocky Brands Powered Higher After Strong Earnings - 5/5/2021 |
View all notes |
Set NEW NOTE alert |
Company Profile |
SEC
News |
Chart |
Request a new note
C
A
S
I |
CRL
-
NYSE
Charles River Labs Intl
DRUGS - Biotechnology
|
$331.17
|
+3.94
1.20% |
$334.35
|
511,865
86.76% of 50 DAV
50 DAV is 590,000
|
$349.13
-5.14%
|
12/17/2020
|
$247.06
|
PP = $257.98
|
|
MB = $270.88
|
Most Recent Note - 5/20/2021 5:40:40 PM
G - Posted a gain today with light volume, halting its slide above its 50 DMA line ($311) which defines initial support above the prior high ($303). Reported Mar '21 quarterly earnings +38% on +17%v sales revenues versus the year ago period. Two of the past 3 quarterly comparisons have been above the +25% minimum earnings guideline (C criteria).
>>> FEATURED STOCK ARTICLE : Pulling Back From Record High Following Strong Quarterly Report - 5/6/2021 |
View all notes |
Set NEW NOTE alert |
Company Profile |
SEC
News |
Chart |
Request a new note
C
A
S
I |
Symbol/Exchange
Company Name
Industry Group |
PRICE |
CHANGE
(%Change) |
Day High |
Volume
(% DAV)
(% 50 day avg vol) |
52 Wk Hi
% From Hi |
Featured
Date |
Price
Featured |
Pivot Featured |
|
Max Buy |
CAMT
-
NASDAQ
Camtek Ltd
ELECTRONICS - Scientific and Technical Instrum
|
$35.35
|
+2.95
9.10% |
$35.65
|
1,046,927
351.32% of 50 DAV
50 DAV is 298,000
|
$36.14
-2.19%
|
4/28/2021
|
$35.03
|
PP = $35.34
|
|
MB = $37.11
|
Most Recent Note - 5/24/2021 12:28:21 PM
Y - Posting a 5th consecutive gain today with ever-increasing volume, abruptly rebounding above its 50 DMA line ($31.09) toward the prior high. Subsequent gains and a strong close above the pivot point backed by at least +40% above average volume still are needed to trigger a technical buy signal.
>>> FEATURED STOCK ARTICLE : Earnings Acceleration and Perched at High After Ascending Base - 4/28/2021 |
View all notes |
Set NEW NOTE alert |
Company Profile |
SEC
News |
Chart |
Request a new note
C
A
S
I |
BRKS
-
NASDAQ
Brooks Automation
ELECTRONICS - Semiconductor Equipment and Mate
|
$97.67
|
+2.66
2.80% |
$98.07
|
519,978
61.98% of 50 DAV
50 DAV is 839,000
|
$108.72
-10.16%
|
4/5/2021
|
$99.31
|
PP = $91.88
|
|
MB = $96.47
|
Most Recent Note - 5/20/2021 5:49:11 PM
G - Rebounded further above its 50 DMA line with light volume behind today's 3rd consecutive gain. It has not formed a sound base. More damaging losses below the recent low ($86.12 on 5/12/21) would raise greater concerns.
>>> FEATURED STOCK ARTICLE : Extended From Base and Consolidating After Recent Rally - 4/30/2021 |
View all notes |
Set NEW NOTE alert |
Company Profile |
SEC
News |
Chart |
Request a new note
C
A
S
I |
OPY
-
NYSE
Oppenheimer Holdings Inc
FINANCIAL SERVICES - Investment Brokerage - Regiona
|
$49.23
|
+1.29
2.69% |
$49.71
|
84,826
75.07% of 50 DAV
50 DAV is 113,000
|
$52.45
-6.14%
|
2/25/2021
|
$38.95
|
PP = $38.11
|
|
MB = $40.02
|
Most Recent Note - 5/24/2021 6:05:58 PM
G - Posted a 3rd consecutive quiet gain, still consolidating above its 50 DMA line($45.20) and near its all-time high, very extended from any sound base. Bullish action came after it reported Mar '21 quarterly earnings +402% on +59% sales revenues versus the year ago period. Prior high in the $44 area defines support to watch below its 50 DMA line.
>>> FEATURED STOCK ARTICLE : Extended From Any Sound Base After Decent Rally - 5/17/2021 |
View all notes |
Set NEW NOTE alert |
Company Profile |
SEC
News |
Chart |
Request a new note
C
A
S
I |
MTH
-
NYSE
Meritage Homes Corp
MATERIALS and CONSTRUCTION - Residential Construction
|
$105.94
|
+0.18
0.17% |
$106.98
|
225,670
54.39% of 50 DAV
50 DAV is 414,900
|
$120.19
-11.86%
|
5/12/2021
|
$108.84
|
PP = $117.16
|
|
MB = $123.02
|
Most Recent Note - 5/24/2021 6:03:50 PM
Y -Volume totals have been cooling while consolidating since hitting a new 52-weekn high on 5/10/21. Subsequent gains above the pivot point with at least +40% above average volume would be a reassuring confirmation of fresh institutional buying demand. Reported earnings +88% on +20% sales revenues for the Mar '21 quarter versus the year ago period, its 7th consecutive strong quarterly comparison above the +25% minimum guideline (C criteria). Annual earnings (A criteria) history has been strong after a downturn in FY '15.
>>> FEATURED STOCK ARTICLE : Homebuilder Pulled Back After Hitting New High - 5/13/2021 |
View all notes |
Set NEW NOTE alert |
Company Profile |
SEC
News |
Chart |
Request a new note
C
A
S
I |
LAD
-
NYSE
Lithia Motors Inc Cl A
SPECIALTY RETAIL - Auto Dealerships
|
$347.59
|
-10.64
-2.97% |
$362.00
|
1,091,170
302.26% of 50 DAV
50 DAV is 361,000
|
$417.98
-16.84%
|
4/21/2021
|
$377.00
|
PP = $418.08
|
|
MB = $438.98
|
Most Recent Note - 5/24/2021 6:15:39 PM
G - Suffered a big loss with above average volume today. Completed a new Public Offering last week. Remains below its 50 DMA line ($381) following a noted streak of losses. A rebound above its 50 DMA line is needed for its outlook to improve.
>>> FEATURED STOCK ARTICLE : Gap Down After Proposing New Public Offering - 5/19/2021 |
View all notes |
Set NEW NOTE alert |
Company Profile |
SEC
News |
Chart |
Request a new note
C
A
S
I |
Symbol/Exchange
Company Name
Industry Group |
PRICE |
CHANGE
(%Change) |
Day High |
Volume
(% DAV)
(% 50 day avg vol) |
52 Wk Hi
% From Hi |
Featured
Date |
Price
Featured |
Pivot Featured |
|
Max Buy |
MED
-
NYSE
Medifast Inc
SPECIALTY RETAIL - Specialty Retail, Other
|
$327.56
|
+13.80
4.40% |
$330.77
|
106,846
86.17% of 50 DAV
50 DAV is 124,000
|
$326.81
0.23%
|
5/11/2021
|
$285.72
|
PP = $279.56
|
|
MB = $293.54
|
Most Recent Note - 5/24/2021 5:59:24 PM
G - Rallied further into record high territory with today's gain backed by lighter volume, getting very extended from the previously noted base. Prior highs in the $279 area define initial support to watch on pullbacks.
>>> FEATURED STOCK ARTICLE : Held Ground Following Breakout Gain on Prior Session - 5/11/2021 |
View all notes |
Set NEW NOTE alert |
Company Profile |
SEC
News |
Chart |
Request a new note
C
A
S
I |
CLFD
-
NASDAQ
Clearfield Inc
TELECOMMUNICATIONS - Cables / Satalite Equipment
|
$36.20
|
-0.98
-2.64% |
$37.35
|
92,547
71.19% of 50 DAV
50 DAV is 130,000
|
$40.26
-10.08%
|
4/26/2021
|
$39.68
|
PP = $38.85
|
|
MB = $40.79
|
Most Recent Note - 5/24/2021 5:58:10 PM
Y - Consolidating in a choppy fashion above its 50 DMA line ($33.28) and recent lows which define important near-term support. Fundamentals remain strong after it reported Mar '21 quarterly earnings +440% on +45% sales revenues versus the year ago period, continuing its strong earnings track record. See the latest FSU analysis for more details and a new annotated graph.
>>> FEATURED STOCK ARTICLE : Stalled and Found Support Above 50-Day Moving Average - 5/24/2021 |
View all notes |
Set NEW NOTE alert |
Company Profile |
SEC
News |
Chart |
Request a new note
C
A
S
I |
FSBW
-
NASDAQ
F S Bancorp
Banks-West/Southwest
|
$70.50
|
-1.14
-1.59% |
$71.32
|
9,531
73.32% of 50 DAV
50 DAV is 13,000
|
$73.62
-4.24%
|
5/18/2021
|
$70.16
|
PP = $73.72
|
|
MB = $77.41
|
Most Recent Note - 5/21/2021 12:54:14 PM
Y - This thinly-traded Bank is perched within striking distance of the pivot point cited based on its 3/08/21 high plus 10 cents, consolidating above its 50 DMA line ($68.36) where it found prompt support during its ongoing ascent. Subsequent gains above the pivot point backed by at least +40% above average volume are needed to trigger a technical buy signal. Reported Mar '21 quarterly earnings +137% on +16% sales revenues versus the year ago period, its 4th consecutive strong quarterly comparison above the +25% minimum earnings guideline (C criteria), matching the fact-based investment system's winning models. Its annual earnings (A criteria) history has been great. This thinly traded Bank completed a new Public Offering on 9/08/17.
>>> FEATURED STOCK ARTICLE : Thinly-Traded Bank Consolidating Above 50-Day Moving Average - 5/18/2021 |
View all notes |
Set NEW NOTE alert |
Company Profile |
SEC
News |
Chart |
Request a new note
C
A
S
I |
SMPL
-
NASDAQ
Simply Good Foods Co
Food-Confectionery
|
$34.67
|
+0.81
2.39% |
$34.85
|
522,301
82.25% of 50 DAV
50 DAV is 635,000
|
$35.34
-1.90%
|
12/28/2020
|
$30.40
|
PP = $31.44
|
|
MB = $33.01
|
Most Recent Note - 5/24/2021 6:08:27 PM
G - Perched within close striking distance of its 52-week and all-time highs. Found prompt support near its 50 DMA line ($32.85). Reported Feb '21 quarterly earnings +9% on +2% sales revenues versus the year ago period, below the +25% minimum earnings guideline (C criteria), raising fundamental concerns. Its current Relative Strength Rating has improved to 85, above the 80+ minimum guideline for buy candidates.
>>> FEATURED STOCK ARTICLE : Hovering Near All-Time High Following Lackluster Quarter - 5/10/2021 |
View all notes |
Set NEW NOTE alert |
Company Profile |
SEC
News |
Chart |
Request a new note
C
A
S
I |
IBP
-
NYSE
"Installed Building Products, Inc"
DIVERSIFIED SERVICES - Business/Management Services
|
$115.23
|
+0.23
0.20% |
$116.32
|
433,504
177.37% of 50 DAV
50 DAV is 244,400
|
$140.58
-18.03%
|
4/19/2021
|
$131.15
|
PP = $130.21
|
|
MB = $136.72
|
Most Recent Note - 5/18/2021 4:56:39 PM
G - Slumped below its 50 DMA line ($121) with today's 2nd consecutive loss with light volume. More damaging losses below the prior low ($115.46 on 5/12/21) would raise serious concerns. Weak action came after it reported Mar '21 quarterly earnings +15% on +10% sales revenues versus the year ago period, below the +25% minimum earnings guideline (C criteria) raising fundamental concerns.
>>> FEATURED STOCK ARTICLE : Rebound Above 50-Day Moving Average Helped Technical Stance - 5/14/2021 |
View all notes |
Set NEW NOTE alert |
Company Profile |
SEC
News |
Chart |
Request a new note
C
A
S
I |
Symbol/Exchange
Company Name
Industry Group |
PRICE |
CHANGE
(%Change) |
Day High |
Volume
(% DAV)
(% 50 day avg vol) |
52 Wk Hi
% From Hi |
Featured
Date |
Price
Featured |
Pivot Featured |
|
Max Buy |
QRVO
-
NASDAQ
"Qorvo, Inc"
ELECTRONICS - Semiconductor - Integrated Cir
|
$178.63
|
+2.07
1.17% |
$180.35
|
824,633
71.54% of 50 DAV
50 DAV is 1,152,700
|
$201.68
-11.43%
|
4/1/2021
|
$190.48
|
PP = $191.92
|
|
MB = $201.52
|
Most Recent Note - 5/20/2021 5:43:02 PM
G - Posted another gain today with light volume after violating its 50 DMA line with a damaging volume-driven loss triggering a technical sell signal. A rebound above the 50 DMA line ($183) is needed for its outlook to improve. Its Relative Strength Rating is 70, below the 80+ minimum for buy candidates. Reported Mar '21 quarterly earnings +75% on +36% sales revenues versus the year ago period, its 3rd very strong quarterly comparison. It stalled after recently wedging up to new highs from a 9-week base.
>>> FEATURED STOCK ARTICLE : Quiet Gain For Best Ever Close - 4/29/2021 |
View all notes |
Set NEW NOTE alert |
Company Profile |
SEC
News |
Chart |
Request a new note
C
A
S
I |
YETI
-
NYSE
Yeti Holdings Inc
Leisure-Products
|
$87.48
|
+0.90
1.04% |
$91.55
|
2,297,961
166.40% of 50 DAV
50 DAV is 1,381,000
|
$90.65
-3.50%
|
5/13/2021
|
$84.20
|
PP = $90.65
|
|
MB = $95.18
|
Most Recent Note - 5/24/2021 12:56:58 PM
Y - Hitting a new all-time high with today's 3rd consecutive gain backed by ever-increasing volume. Quickly rebounded after a pullback last week tested support at its 50 DMA line and prior high. Reported Mar 21 quarterly earnings +245% on +42% sales revenues versus the year ago period, continuing its strong earnings track record. Previously noted that a valid secondary buy point exists from its 10 WMA line up to 5% above the latest high.
>>> FEATURED STOCK ARTICLE : Hovering Near Record High Following Volume-Driven Gains - 5/3/2021 |
View all notes |
Set NEW NOTE alert |
Company Profile |
SEC
News |
Chart |
Request a new note
C
A
S
I |
MRBK
-
NASDAQ
Meridian Corp
Banks-Northeast
|
$27.08
|
-0.67
-2.41% |
$27.61
|
13,485
39.66% of 50 DAV
50 DAV is 34,000
|
$29.18
-7.20%
|
5/18/2021
|
$25.58
|
PP = $28.06
|
|
MB = $29.46
|
Most Recent Note - 5/24/2021 6:02:18 PM
Y - Volume totals have been cooling while hovering near its 52-week high hit when featured on 5/18/21. Reported Mar '21 earnings +323% on +93% sales revenues versus the year ago period, continuing its strong earnings track record. Recent low ($24.01 on 4/21/21) defines important near-term support where any violation may trigger a worrisome technical sell signal. Its Relative Strength Rating is 81, above the 80 minimum guideline.
>>> FEATURED STOCK ARTICLE : Bank Consolidating Near 50 Day Moving Average Line - 5/7/2021 |
View all notes |
Set NEW NOTE alert |
Company Profile |
SEC
News |
Chart |
Request a new note
C
A
S
I |
CLAR
-
NASDAQ
Clarus Corporation
Leisure-Products
|
$22.85
|
+0.18
0.79% |
$23.07
|
142,359
80.89% of 50 DAV
50 DAV is 176,000
|
$23.13
-1.21%
|
5/12/2021
|
$21.40
|
PP = $19.73
|
|
MB = $20.72
|
Most Recent Note - 5/21/2021 12:18:48 PM
G - Hitting another new 52-week high with heavier volume behind today's big gain, getting very extended from the previously noted base. Prior high ($19.63 on 3/09/21) defines initial support to watch above its 50 DMA line ($18.46).
>>> FEATURED STOCK ARTICLE : 4 Volume-Driven Gains Into New High Territory - 5/12/2021 |
View all notes |
Set NEW NOTE alert |
Company Profile |
SEC
News |
Chart |
Request a new note
C
A
S
I |
|
|
|
THESE ARE NOT BUY RECOMMENDATIONS!
Comments contained in the body of this report are technical
opinions only. The material herein has been obtained
from sources believed to be reliable and accurate, however,
its accuracy and completeness cannot be guaranteed.
This site is not an investment advisor, hence it does
not endorse or recommend any securities or other investments.
Any recommendation contained in this report may not
be suitable for all investors and it is not to be deemed
an offer or solicitation on our part with respect to
the purchase or sale of any securities. All trademarks,
service marks and trade names appearing in this report
are the property of their respective owners, and are
likewise used for identification purposes only.
This report is a service available
only to active Paid Premium Members.
You may opt-out of receiving report notifications
at any time. Questions or comments may be submitted
by writing to Premium Membership Services 665 S.E. 10 Street, Suite 201 Deerfield Beach, FL 33441-5634 or by calling 1-800-965-8307
or 954-785-1121.
|
|
|