You are not logged in.
This means you
CAN ONLY VIEW reports that were published prior to Thursday, March 20, 2025.
You
MUST UPGRADE YOUR MEMBERSHIP if you want to see any current reports.
AFTER MARKET UPDATE - WEDNESDAY, MAY 19TH, 2021
Previous After Market Report Next After Market Report >>>
|
|
|
|
DOW |
-164.62 |
33,896.04 |
-0.48% |
|
Volume |
987,618,062 |
+6% |
|
Volume |
4,280,125,300 |
+1% |
|
NASDAQ |
-0.98 |
13,302.66 |
-0.01% |
|
Advancers |
1,129 |
35% |
|
Advancers |
1,574 |
38% |
|
S&P 500 |
-12.15 |
4,115.68 |
-0.29% |
|
Decliners |
2,082 |
65% |
|
Decliners |
2,523 |
62% |
|
Russell 2000 |
-17.24 |
2,193.64 |
-0.78% |
|
52 Wk Highs |
50 |
|
|
52 Wk Highs |
44 |
|
|
S&P 600 |
-8.23 |
1,333.53 |
-0.61% |
|
52 Wk Lows |
34 |
|
|
52 Wk Lows |
61 |
|
|
 |
Leadership Waned as Major Averages Fell
Kenneth J. Gruneisen - Passed the CAN SLIM® Master's Exam
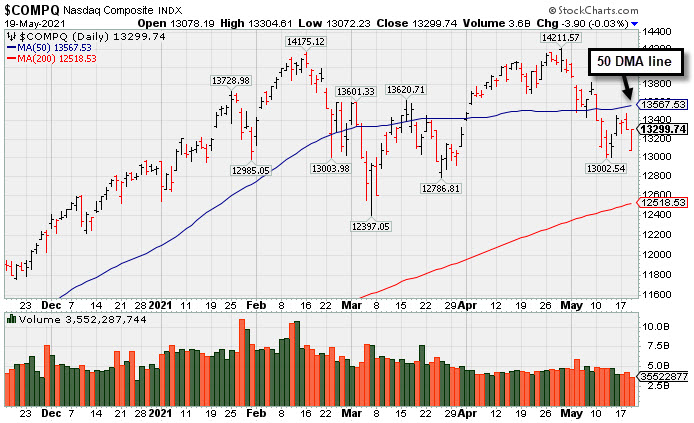
The Dow fell 164 points, paring an earlier drop of 586 points. The S&P 500 was down 0.3%, though still within 2.8% of its May 7 all-time high. The Nasdaq Composite dipped less than 0.1%, recovering from a 1.7% slide in early trading. The volume totals reported were higher than the prior session on the NYSE and on the Nasdaq exchange, indicative of distributional pressure. Decliners led advancers by nearly 2-1 on the NYSE and 5-3 on the Nasdaq exchange. There were 7 high-ranked companies from the Leaders List that hit new 52-week highs and were listed on the BreakOuts Page, down from 51 on the prior session. New 52-week highs outnumbered new 52-week lows on NYSE while new lows outnumbered new higher on the Nasdaq exchange. The major indices (M criteria) are in a confirmed uptrend. Investors are reminded to always make buying and selling decisions on case-by-case basis under the strict criteria and rules of the fact-based investment system.
PICTURED: The Nasdaq Composite Index slumped and has been sputtering below its 50-day moving average (DMA) line.
U.S. stocks finished lower in volatile trading Wednesday. The Federal Reserve’s April meeting minutes were in focus, with the release indicating several policymakers agreed it may become appropriate to talk about tapering asset purchases “at some point” in future meetings. However, a number of participants concluded that the U.S. economy remained far from achieving the central bank’s dual mandate of maximum employment and sustained inflation above 2%.
Treasuries weakened, with the yield on the 10-year note up four basis points to 1.68%. In commodities, WTI crude declined 3.3% to $63.34/barrel as oil prices faced multiple headwinds, including inventory builds and a flare-up in COVID-19 infections in Asia. COMEX gold trimmed an earlier gain that had lifted the yellow metal to its best level since January after a gauge of the U.S. dollar advanced 0.5%, ending a four-session losing streak. Meanwhile, bitcoin fell as much as 30% to its lowest point since January after Chinese regulators tightened restrictions on its use. The cryptocurrency later rebounded sharply, briefly topping $40,000 in afternoon trading.
In earnings, Target (TGT +6.49%) rose after reporting a 23% jump in first-quarter sales and noting that its margins should widen this year amid increased demand for more profitable products. Lowe's (LOW -1.07%) fell as worries about supply chain bottlenecks overshadowed upbeat quarterly figures. |
 Kenneth J. Gruneisen started out as a licensed stockbroker in August 1987, a couple of months prior to the historic stock market crash that took the Dow Jones Industrial Average down -22.6% in a single day. He has published daily fact-based fundamental and technical analysis on high-ranked stocks online for two decades. Through FACTBASEDINVESTING.COM, Kenneth provides educational articles, news, market commentary, and other information regarding proven investment systems that work in good times and bad.
Comments contained in the body of this report are technical opinions only and are not necessarily those of Gruneisen Growth Corp. The material herein has been obtained from sources believed to be reliable and accurate, however, its accuracy and completeness cannot be guaranteed. Our firm, employees, and customers may effect transactions, including transactions contrary to any recommendation herein, or have positions in the securities mentioned herein or options with respect thereto. Any recommendation contained in this report may not be suitable for all investors and it is not to be deemed an offer or solicitation on our part with respect to the purchase or sale of any securities. |
|
 |
Semiconductor Index Posted Standout Gains
Kenneth J. Gruneisen - Passed the CAN SLIM® Master's Exam
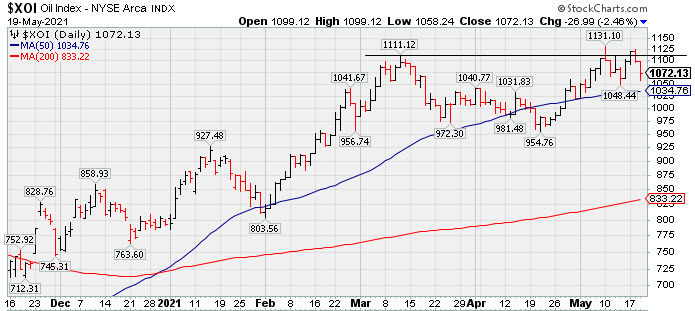
The Semiconductor Index ($SOX +1.99%) led the tech sector while the Networking Index ($NWX +0.24%) also edged higher, but the Biotech Index ($BTK -1.01%) lost ground. The Bank Index ($BKX -0.87%) weighed on the major averages as it lost ground along with smaller losses for the Broker/Dealer Index ($XBD -0.32%) and Retail Index ($RLX -0.37%). The Oil Services Index ($OSX -2.84%), Integrated Oil Index ($XOI -2.46%), and Gold & Silver Index ($XAU -2.01%) suffered unanimous losses. PICTURED: The Integrated Oil Index ($XOI -2.46%) pulled back after recently trading above the March high.
| Oil Services |
$OSX |
60.25 |
-1.76 |
-2.84% |
+35.92% |
| Integrated Oil |
$XOI |
1,072.13 |
-26.99 |
-2.46% |
+35.29% |
| Semiconductor |
$SOX |
2,987.57 |
+58.42 |
+1.99% |
+6.87% |
| Networking |
$NWX |
795.25 |
+1.90 |
+0.24% |
+10.89% |
| Broker/Dealer |
$XBD |
458.96 |
-1.46 |
-0.32% |
+21.55% |
| Retail |
$RLX |
3,786.54 |
-13.95 |
-0.37% |
+6.27% |
| Gold & Silver |
$XAU |
162.00 |
-3.33 |
-2.01% |
+12.35% |
| Bank |
$BKX |
131.04 |
-1.15 |
-0.87% |
+33.84% |
| Biotech |
$BTK |
5,477.49 |
-56.11 |
-1.01% |
-4.56% |
|
|
|
 |
Gap Down After Proposing New Public Offering
Kenneth J. Gruneisen - Passed the CAN SLIM® Master's Exam
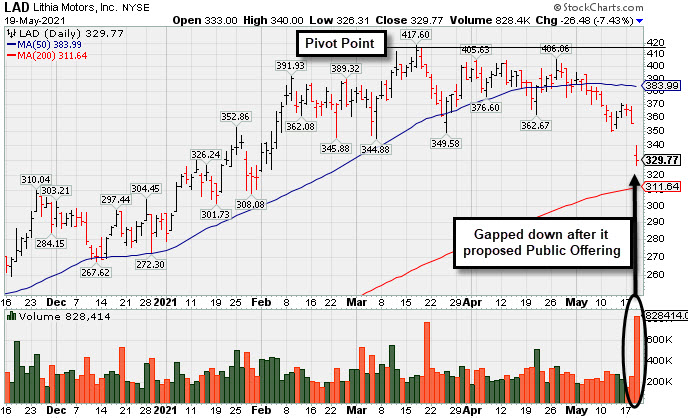
Lithia Motors Inc Cl A (LAD -$26.48 or -7.43% to $329.77) gapped down today for a big loss after proposing a new Public Offering. It remains well below its 50-day moving average (DMA) line ($384) following a noted streak of losses. A rebound above its 50 DMA line is needed for its outlook to improve.
LAD was highlighted in yellow in the 4/21/21 mid-day report (read here) with a pivot point cited based on its 3/17/21 high plus 10 cents. Disciplined investors will noted that it failed to produce the subsequent gains above the pivot point backed by at least +40% above average volume necessary to trigger a technical buy signal. It was last shown in this FSU section on 4/21/21 with an annotated graph under the headline "Building a Base With Rebound Above 50-Day Moving Average"
It has an Earnings Per Share Rating of 97. LAD reported earnings +193% on +55% sales revenues for the Mar '21 quarter versus the year ago period, its 3rd consecutive quarterly earnings increases above the +25% minimum (C criteria) guideline with sequential quarters showing acceleration in its sales revenues growth rate. This Medford, Oregon-based Retail/Wholesale - Automobile firm's annual earnings history (A criteria) has been strong and steady after a dramatic downturn in FY '07 and '08 earnings.
LAD completed a new Public Offering on 9/30/20. There are 26.6 million shares outstanding (S criteria) which can contribute to greater volatility in the event of institutional buying or selling. The number of top-rated funds owning its shares rose from 567 in Jun '20 to 755 in Mar '21, a reassuring sign concerning the I criteria. Its Timeliness Rating is B and Sponsorship Rating is B.
|
|
|
Color Codes Explained :
Y - Better candidates highlighted by our
staff of experts.
G - Previously featured
in past reports as yellow but may no longer be buyable under the
guidelines.
***Last / Change / Volume data in this table is the closing quote data***
Symbol/Exchange
Company Name
Industry Group |
PRICE |
CHANGE
(%Change) |
Day High |
Volume
(% DAV)
(% 50 day avg vol) |
52 Wk Hi
% From Hi |
Featured
Date |
Price
Featured |
Pivot Featured |
|
Max Buy |
 SIVB
-
NASDAQ
SIVB
-
NASDAQ
S V B Financial Group
BANKING - Regional - Pacific Banks
|
$562.94
|
-12.52
-2.18% |
$563.38
|
377,021
67.69% of 50 DAV
50 DAV is 557,000
|
$595.90
-5.53%
|
4/23/2021
|
$579.70
|
PP = $577.16
|
|
MB = $606.02
|
 Most Recent Note - 5/19/2021 3:03:05 PM
Y - Gapped down today, yet still hovering near its high. Confirming volume-driven gains are still needed to help clinch a convincing technical buy signal. Its 50 DMA line ($534) defines near-term support to watch. Reported earnings +293% on +64% sales revenues for the Mar '21 quarter versus the year ago period, its 3rd strong comparison. Completed a new Public Offering on 3/24/21.
>>> FEATURED STOCK ARTICLE : Hit New High But Closed Below Pivot Point - 4/23/2021 |
View all notes |
Set NEW NOTE alert |
Company Profile |
SEC
News |
Chart |
Request a new note
C
A
S
I |
CROX
-
NASDAQ
Crocs Inc
CONSUMER NON-DURABLES - Textile - Apparel Footwear
|
$98.77
|
-3.02
-2.97% |
$100.60
|
1,197,048
85.99% of 50 DAV
50 DAV is 1,392,000
|
$109.91
-10.14%
|
4/27/2021
|
$99.81
|
PP = $86.50
|
|
MB = $90.83
|
Most Recent Note - 5/19/2021 3:04:09 PM
G - Hovering near its all-time high with volume totals cooling. It is very extended from the latest base. Prior highs in the $86 area define initial support to watch on pullbacks.
>>> FEATURED STOCK ARTICLE : Powerful "Breakaway Gap" for CROX - 4/27/2021 |
View all notes |
Set NEW NOTE alert |
Company Profile |
SEC
News |
Chart |
Request a new note
C
A
S
I |
RCKY
-
NASDAQ
Rocky Brands Inc
CONSUMER NON-DURABLES - Textile - Apparel Footwear
|
$53.77
|
-0.73
-1.34% |
$54.52
|
85,179
94.64% of 50 DAV
50 DAV is 90,000
|
$69.00
-22.07%
|
5/5/2021
|
$61.65
|
PP = $61.55
|
|
MB = $64.63
|
Most Recent Note - 5/17/2021 5:51:59 PM
G - Halted its slide above its 50 DMA line ($54.30) after undercutting the prior high ($61) area raised concerns. Fundamentals remain strong. More damaging losses would raise serious concerns and trigger a technical sell signal.
>>> FEATURED STOCK ARTICLE : Rocky Brands Powered Higher After Strong Earnings - 5/5/2021 |
View all notes |
Set NEW NOTE alert |
Company Profile |
SEC
News |
Chart |
Request a new note
C
A
S
I |
CRL
-
NYSE
Charles River Labs Intl
DRUGS - Biotechnology
|
$319.00
|
-0.70
-0.22% |
$319.54
|
404,214
70.79% of 50 DAV
50 DAV is 571,000
|
$349.13
-8.63%
|
12/17/2020
|
$247.06
|
PP = $257.98
|
|
MB = $270.88
|
Most Recent Note - 5/14/2021 12:39:47 PM
G - Extended from any sound base, it abruptly retreated from its all-time high with a spurt of volume-driven losses. Its 50 DMA line ($307.75) defines near-term support above the prior high ($303). Reported Mar '21 quarterly earnings +38% on +17%v sales revenues versus the year ago period. Two of the past 3 quarterly comparisons have been above the +25% minimum earnings guideline (C criteria).
>>> FEATURED STOCK ARTICLE : Pulling Back From Record High Following Strong Quarterly Report - 5/6/2021 |
View all notes |
Set NEW NOTE alert |
Company Profile |
SEC
News |
Chart |
Request a new note
C
A
S
I |
CAMT
-
NASDAQ
Camtek Ltd
ELECTRONICS - Scientific and Technical Instrum
|
$28.65
|
+1.06
3.84% |
$28.77
|
208,220
71.06% of 50 DAV
50 DAV is 293,000
|
$36.14
-20.72%
|
4/28/2021
|
$35.03
|
PP = $35.34
|
|
MB = $37.11
|
Most Recent Note - 5/19/2021 5:05:04 PM
G - Posted a 2nd consecutive gain today with light volume. Remains well below its 50 DMA line ($30.91) after damaging losses. A prompt rebound is needed for its outlook to improve. Subsequent gains and a strong close above the pivot point backed by at least +40% above average volume still are needed to trigger a technical buy signal.
>>> FEATURED STOCK ARTICLE : Earnings Acceleration and Perched at High After Ascending Base - 4/28/2021 |
View all notes |
Set NEW NOTE alert |
Company Profile |
SEC
News |
Chart |
Request a new note
C
A
S
I |
Symbol/Exchange
Company Name
Industry Group |
PRICE |
CHANGE
(%Change) |
Day High |
Volume
(% DAV)
(% 50 day avg vol) |
52 Wk Hi
% From Hi |
Featured
Date |
Price
Featured |
Pivot Featured |
|
Max Buy |
BRKS
-
NASDAQ
Brooks Automation
ELECTRONICS - Semiconductor Equipment and Mate
|
$93.71
|
+2.27
2.48% |
$93.93
|
527,363
63.38% of 50 DAV
50 DAV is 832,000
|
$108.72
-13.81%
|
4/5/2021
|
$99.31
|
PP = $91.88
|
|
MB = $96.47
|
Most Recent Note - 5/19/2021 2:56:41 PM
G - It has not formed a sound base but found prompt support after undercutting prior highs in the $91 area and its 50 DMA line ($92.26). More damaging losses would raise greater concerns.
>>> FEATURED STOCK ARTICLE : Extended From Base and Consolidating After Recent Rally - 4/30/2021 |
View all notes |
Set NEW NOTE alert |
Company Profile |
SEC
News |
Chart |
Request a new note
C
A
S
I |
OPY
-
NYSE
Oppenheimer Holdings Inc
FINANCIAL SERVICES - Investment Brokerage - Regiona
|
$47.57
|
-0.68
-1.41% |
$47.90
|
145,640
127.75% of 50 DAV
50 DAV is 114,000
|
$52.45
-9.30%
|
2/25/2021
|
$38.95
|
PP = $38.11
|
|
MB = $40.02
|
Most Recent Note - 5/17/2021 5:47:07 PM
G - Posted a 3rd consecutive quiet gain, hovering near its all-time high, very extended from any sound base. Bullish action came after it reported Mar '21 quarterly earnings +402% on +59% sales revenues versus the year ago period. Prior high in the $44 area defines initial support to watch coinciding with its 50 DMA line. See the latest FSU analysis for more details and a new annotated graph.
>>> FEATURED STOCK ARTICLE : Extended From Any Sound Base After Decent Rally - 5/17/2021 |
View all notes |
Set NEW NOTE alert |
Company Profile |
SEC
News |
Chart |
Request a new note
C
A
S
I |
MTH
-
NYSE
Meritage Homes Corp
MATERIALS and CONSTRUCTION - Residential Construction
|
$106.78
|
-1.37
-1.27% |
$108.31
|
357,430
85.00% of 50 DAV
50 DAV is 420,500
|
$120.19
-11.16%
|
5/12/2021
|
$108.84
|
PP = $117.16
|
|
MB = $123.02
|
Most Recent Note - 5/18/2021 4:54:50 PM
Y - Pulled back today for a 2nd consecutive loss with light volume. Subsequent gains above the pivot point with at least +40% above average volume would be a reassuring confirmation of fresh institutional buying demand. Reported earnings +88% on +20% sales revenues for the Mar '21 quarter versus the year ago period, its 7th consecutive strong quarterly comparison above the +25% minimum guideline (C criteria). Annual earnings (A criteria) history has been strong after a downturn in FY '15.
>>> FEATURED STOCK ARTICLE : Homebuilder Pulled Back After Hitting New High - 5/13/2021 |
View all notes |
Set NEW NOTE alert |
Company Profile |
SEC
News |
Chart |
Request a new note
C
A
S
I |
LAD
-
NYSE
Lithia Motors Inc Cl A
SPECIALTY RETAIL - Auto Dealerships
|
$329.77
|
-26.48
-7.43% |
$340.00
|
828,414
290.67% of 50 DAV
50 DAV is 285,000
|
$417.98
-21.10%
|
4/21/2021
|
$377.00
|
PP = $418.08
|
|
MB = $438.98
|
Most Recent Note - 5/19/2021 3:00:46 PM
G - Gapped down today for a big loss after proposing a new Public Offering. Remains below its 50 DMA line ($384) following a noted streak of losses. A rebound above its 50 DMA line is needed for its outlook to improve.
>>> FEATURED STOCK ARTICLE : Gap Down After Proposing New Public Offering - 5/19/2021 |
View all notes |
Set NEW NOTE alert |
Company Profile |
SEC
News |
Chart |
Request a new note
C
A
S
I |
MED
-
NYSE
Medifast Inc
SPECIALTY RETAIL - Specialty Retail, Other
|
$317.07
|
-0.07
-0.02% |
$317.19
|
126,917
101.53% of 50 DAV
50 DAV is 125,000
|
$326.81
-2.98%
|
5/11/2021
|
$285.72
|
PP = $279.56
|
|
MB = $293.54
|
Most Recent Note - 5/18/2021 12:41:40 PM
G - Rising into record high territory with today's 4th consecutive volume-driven gain, getting extended from the previously noted base. Prior highs in the $279 area define initial support to watch on pullbacks.
>>> FEATURED STOCK ARTICLE : Held Ground Following Breakout Gain on Prior Session - 5/11/2021 |
View all notes |
Set NEW NOTE alert |
Company Profile |
SEC
News |
Chart |
Request a new note
C
A
S
I |
Symbol/Exchange
Company Name
Industry Group |
PRICE |
CHANGE
(%Change) |
Day High |
Volume
(% DAV)
(% 50 day avg vol) |
52 Wk Hi
% From Hi |
Featured
Date |
Price
Featured |
Pivot Featured |
|
Max Buy |
CLFD
-
NASDAQ
Clearfield Inc
TELECOMMUNICATIONS - Cables / Satalite Equipment
|
$37.37
|
+0.83
2.27% |
$37.67
|
87,304
66.64% of 50 DAV
50 DAV is 131,000
|
$40.26
-7.18%
|
4/26/2021
|
$39.68
|
PP = $38.85
|
|
MB = $40.79
|
Most Recent Note - 5/19/2021 2:58:02 PM
Y - On track for a 5th consecutive small gain today with light volume. Fundamentals remain strong after it reported Mar '21 quarterly earnings +440% on +45% sales revenues versus the year ago period, continuing its strong earnings track record.
>>> FEATURED STOCK ARTICLE : Rallied Straight Up From Bottom of 10-Week Base - 4/26/2021 |
View all notes |
Set NEW NOTE alert |
Company Profile |
SEC
News |
Chart |
Request a new note
C
A
S
I |
FSBW
-
NASDAQ
F S Bancorp
Banks-West/Southwest
|
$69.01
|
-0.08
-0.12% |
$69.65
|
10,858
83.52% of 50 DAV
50 DAV is 13,000
|
$73.62
-6.26%
|
5/18/2021
|
$70.16
|
PP = $73.72
|
|
MB = $77.41
|
Most Recent Note - 5/18/2021 4:53:22 PM
Y - Color code was changed to yellow with pivot point cited based on its 3/08/21 high plus 10 cents. Consolidating above its 50 DMA line ($68.54) where it found prompt support during its ongoing ascent. Subsequent gains above the pivot point backed by at least +40% above average volume are needed to trigger a technical buy signal. Reported Mar '21 quarterly earnings +137% on +16% sales revenues versus the year ago period, its 4th consecutive strong quarterly comparison above the +25% minimum earnings guideline (C criteria), matching the fact-based investment system's winning models. Its annual earnings (A criteria) history has been great. This thinly traded Bank completed a new Public Offering on 9/08/17. See the latest FSU analysis for more details and a new annotated graph.
>>> FEATURED STOCK ARTICLE : Thinly-Traded Bank Consolidating Above 50-Day Moving Average - 5/18/2021 |
View all notes |
Set NEW NOTE alert |
Company Profile |
SEC
News |
Chart |
Request a new note
C
A
S
I |
SMPL
-
NASDAQ
Simply Good Foods Co
Food-Confectionery
|
$34.38
|
+0.62
1.84% |
$34.42
|
600,198
85.13% of 50 DAV
50 DAV is 705,000
|
$35.34
-2.72%
|
12/28/2020
|
$30.40
|
PP = $31.44
|
|
MB = $33.01
|
Most Recent Note - 5/18/2021 3:59:02 PM
G - Rebounding above its 50 DMA line ($32.74) with today's big gain backed by above average volume, raising concerns. Reported Feb '21 quarterly earnings +9% on +2% sales revenues versus the year ago period, below the +25% minimum earnings guideline (C criteria), raising fundamental concerns. Its current Relative Strength Rating is 71, below the 80+ minimum guideline for buy candidates.
>>> FEATURED STOCK ARTICLE : Hovering Near All-Time High Following Lackluster Quarter - 5/10/2021 |
View all notes |
Set NEW NOTE alert |
Company Profile |
SEC
News |
Chart |
Request a new note
C
A
S
I |
IBP
-
NYSE
"Installed Building Products, Inc"
DIVERSIFIED SERVICES - Business/Management Services
|
$114.84
|
-1.70
-1.46% |
$115.40
|
206,520
82.91% of 50 DAV
50 DAV is 249,100
|
$140.58
-18.31%
|
4/19/2021
|
$131.15
|
PP = $130.21
|
|
MB = $136.72
|
Most Recent Note - 5/18/2021 4:56:39 PM
G - Slumped below its 50 DMA line ($121) with today's 2nd consecutive loss with light volume. More damaging losses below the prior low ($115.46 on 5/12/21) would raise serious concerns. Weak action came after it reported Mar '21 quarterly earnings +15% on +10% sales revenues versus the year ago period, below the +25% minimum earnings guideline (C criteria) raising fundamental concerns.
>>> FEATURED STOCK ARTICLE : Rebound Above 50-Day Moving Average Helped Technical Stance - 5/14/2021 |
View all notes |
Set NEW NOTE alert |
Company Profile |
SEC
News |
Chart |
Request a new note
C
A
S
I |
QRVO
-
NASDAQ
"Qorvo, Inc"
ELECTRONICS - Semiconductor - Integrated Cir
|
$174.15
|
+4.08
2.40% |
$174.43
|
993,062
83.90% of 50 DAV
50 DAV is 1,183,600
|
$201.68
-13.65%
|
4/1/2021
|
$190.48
|
PP = $191.92
|
|
MB = $201.52
|
Most Recent Note - 5/14/2021 12:56:51 PM
G - Halted its slide this week after violating its 50 DMA line and the prior low with a damaging volume-driven loss on 5/10/21 triggering a technical sell signal. A rebound above the 50 DMA line ($183) is needed for its outlook to improve. Its Relative Strength Rating is 59, below the 80+ minimum for buy candidates. Reported Mar '21 quarterly earnings +75% on +36% sales revenues versus the year ago period, its 3rd very strong quarterly comparison. It stalled after recently wedging up to new highs from a 9-week base.
>>> FEATURED STOCK ARTICLE : Quiet Gain For Best Ever Close - 4/29/2021 |
View all notes |
Set NEW NOTE alert |
Company Profile |
SEC
News |
Chart |
Request a new note
C
A
S
I |
Symbol/Exchange
Company Name
Industry Group |
PRICE |
CHANGE
(%Change) |
Day High |
Volume
(% DAV)
(% 50 day avg vol) |
52 Wk Hi
% From Hi |
Featured
Date |
Price
Featured |
Pivot Featured |
|
Max Buy |
YETI
-
NYSE
Yeti Holdings Inc
Leisure-Products
|
$84.45
|
-1.75
-2.03% |
$84.58
|
1,479,636
106.37% of 50 DAV
50 DAV is 1,391,000
|
$90.65
-6.84%
|
5/13/2021
|
$84.20
|
PP = $90.65
|
|
MB = $95.18
|
Most Recent Note - 5/17/2021 12:56:01 PM
Y - Quickly rebounded after a pullback last week tested support at its 50 DMA line and prior high. Reported Mar 21 quarterly earnings +245% on +42% sales revenues versus the year ago period, continuing its strong earnings track record. Color code was changed to yellow as it was noted that a valid secondary buy point exists from its 10 WMA line up to 5% above the latest high.
>>> FEATURED STOCK ARTICLE : Hovering Near Record High Following Volume-Driven Gains - 5/3/2021 |
View all notes |
Set NEW NOTE alert |
Company Profile |
SEC
News |
Chart |
Request a new note
C
A
S
I |
MRBK
-
NASDAQ
Meridian Corp
Banks-Northeast
|
$27.82
|
+0.05
0.18% |
$28.14
|
23,418
65.05% of 50 DAV
50 DAV is 36,000
|
$29.18
-4.66%
|
5/18/2021
|
$25.58
|
PP = $28.06
|
|
MB = $29.46
|
Most Recent Note - 5/18/2021 3:57:55 PM
Y - New pivot point is cited based on its 3/11/21 high plus 10 cents. Hitting a new 52-week high with today's big volume-driven gain clearing an orderly consolidation. Reported Mar '21 earnings +323% on +93% sales revenues versus the year ago period, continuing its strong earnings track record. Recent low ($24.01 on 4/21/21) defines important near-term support where any violation may trigger a worrisome technical sell signal. Its Relative Strength Rating is 80, at the 80 minimum guideline.
>>> FEATURED STOCK ARTICLE : Bank Consolidating Near 50 Day Moving Average Line - 5/7/2021 |
View all notes |
Set NEW NOTE alert |
Company Profile |
SEC
News |
Chart |
Request a new note
C
A
S
I |
CLAR
-
NASDAQ
Clarus Corporation
Leisure-Products
|
$21.33
|
+0.09
0.42% |
$21.37
|
135,163
80.94% of 50 DAV
50 DAV is 167,000
|
$22.27
-4.22%
|
5/12/2021
|
$21.40
|
PP = $19.73
|
|
MB = $20.72
|
Most Recent Note - 5/17/2021 5:50:02 PM
G - Color code is changed to green after rising even further above its "max buy" level with today's gain with light volume for a best-ever close. Prior high ($19.63 on 3/09/21) defines initial support to watch on pullbacks.
>>> FEATURED STOCK ARTICLE : 4 Volume-Driven Gains Into New High Territory - 5/12/2021 |
View all notes |
Set NEW NOTE alert |
Company Profile |
SEC
News |
Chart |
Request a new note
C
A
S
I |
|
|
|
THESE ARE NOT BUY RECOMMENDATIONS!
Comments contained in the body of this report are technical
opinions only. The material herein has been obtained
from sources believed to be reliable and accurate, however,
its accuracy and completeness cannot be guaranteed.
This site is not an investment advisor, hence it does
not endorse or recommend any securities or other investments.
Any recommendation contained in this report may not
be suitable for all investors and it is not to be deemed
an offer or solicitation on our part with respect to
the purchase or sale of any securities. All trademarks,
service marks and trade names appearing in this report
are the property of their respective owners, and are
likewise used for identification purposes only.
This report is a service available
only to active Paid Premium Members.
You may opt-out of receiving report notifications
at any time. Questions or comments may be submitted
by writing to Premium Membership Services 665 S.E. 10 Street, Suite 201 Deerfield Beach, FL 33441-5634 or by calling 1-800-965-8307
or 954-785-1121.
|
|
|