You are not logged in.
This means you
CAN ONLY VIEW reports that were published prior to Thursday, March 20, 2025.
You
MUST UPGRADE YOUR MEMBERSHIP if you want to see any current reports.
AFTER MARKET UPDATE - MONDAY, APRIL 26TH, 2021
Previous After Market Report Next After Market Report >>>
|
|
|
|
DOW |
-61.92 |
33,981.57 |
-0.18% |
|
Volume |
813,909,448 |
+5% |
|
Volume |
4,431,036,800 |
+3% |
|
NASDAQ |
+120.32 |
14,137.13 |
+0.86% |
|
Advancers |
2,045 |
62% |
|
Advancers |
2,821 |
67% |
|
S&P 500 |
+7.45 |
4,187.62 |
+0.18% |
|
Decliners |
1,229 |
38% |
|
Decliners |
1,370 |
33% |
|
Russell 2000 |
+26.15 |
2,298.01 |
+1.15% |
|
52 Wk Highs |
395 |
|
|
52 Wk Highs |
249 |
|
|
S&P 600 |
+7.14 |
1,357.20 |
+0.53% |
|
52 Wk Lows |
16 |
|
|
52 Wk Lows |
25 |
|
|
 |
S&P and Nasdaq Hit New Records; Breadth Positive and Leadership Improved
Kenneth J. Gruneisen - Passed the CAN SLIM® Master's Exam
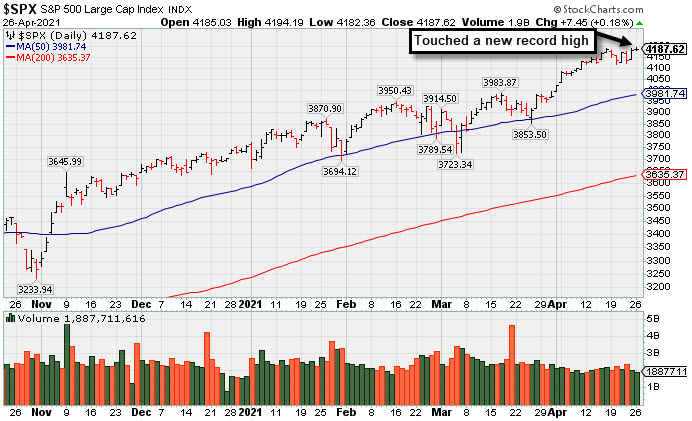
The S&P 500 added 0.2% to a fresh all-time high, while the Nasdaq Composite jumped 0.9%, notching a new record level for the first time since February 12. The small-cap Russell 2000 surged 1.2%, while the Dow bucked the uptrend, losing 61 points. The volume totals reported were higher than the prior session on the NYSE and on the Nasdaq exchange. Breadth was positive as advancers led decliners by a 5-3 margin on the NYSE and 2-1 on the Nasdaq exchange. Leadership improved as there were 87 high-ranked companies from the Leaders List that hit new 52-week highs and were listed on the BreakOuts Page, versus the total of 62 on the prior session. New 52-week highs totals expanded and solidly outnumbered new 52-week lows on both the NYSE and the Nasdaq exchange. The major indices (M criteria) are in a confirmed uptrend. Investors are reminded to always make buying and selling decisions on case-by-case basis under the strict criteria and rules of the fact-based investment system.
PICTURED: The S&P 500 Index hit a new record high.
U.S. stocks finished mixed on Monday as investors awaited a raft of key earnings and economic releases this week. More than a third of S&P 500 companies will post profit tallies, with nearly 40% of the benchmark’s market cap on deck for Tuesday through Thursday.
On the data front, both durable and capital goods orders rebounded in March. Meanwhile, a gauge of manufacturing activity in the Dallas region climbed to its highest point since June 2018 this month. Treasuries weakened slightly, with the yield on the 10-year note up one basis point to 1.56% ahead of this week’s Federal Reserve policy meeting. In commodities, WTI crude dipped 0.3% to $61.93/barrel, paring its loss after an OPEC+ panel lifted its global demand growth forecast. Copper rallied to its highest level in a decade.
Seven of 11 S&P 500 sectors closed in positive territory. Consumer Staples lagged as a spike in agricultural commodities fed inflation concerns. In earnings, Otis Worldwide (OTIS +7.00%) gapped up after the elevator manufacturer delivered upbeat figures and lifted its full-year outlook. Albertsons Companies (ACI -5.01%) fell following disappointing current-quarter guidance from the grocery store chain. In other corporate news, Etsy (ETSY -4.39%) fell on the heels of an analyst downgrade, while Discovery Financial Services (DFS +3.26%) rose after being the subject of an upgrade. |
 Kenneth J. Gruneisen started out as a licensed stockbroker in August 1987, a couple of months prior to the historic stock market crash that took the Dow Jones Industrial Average down -22.6% in a single day. He has published daily fact-based fundamental and technical analysis on high-ranked stocks online for two decades. Through FACTBASEDINVESTING.COM, Kenneth provides educational articles, news, market commentary, and other information regarding proven investment systems that work in good times and bad.
Comments contained in the body of this report are technical opinions only and are not necessarily those of Gruneisen Growth Corp. The material herein has been obtained from sources believed to be reliable and accurate, however, its accuracy and completeness cannot be guaranteed. Our firm, employees, and customers may effect transactions, including transactions contrary to any recommendation herein, or have positions in the securities mentioned herein or options with respect thereto. Any recommendation contained in this report may not be suitable for all investors and it is not to be deemed an offer or solicitation on our part with respect to the purchase or sale of any securities. |
|
 |
Financial, Retail, Tech, and Commodity-Linked Groups Rose
Kenneth J. Gruneisen - Passed the CAN SLIM® Master's Exam
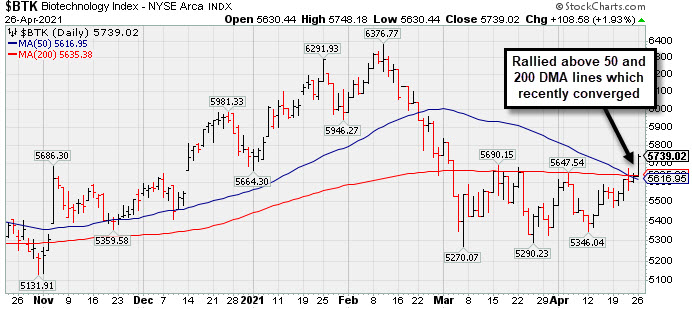
The Bank Index ($BKX +1.08%) outpaced the Broker/Dealer Index ($XBD +0.39%) and the Retail Index ($RLX +0.68%) on Monday's widely positive session. The Biotech Index ($BTK +1.93%) led the tech sector higher while the Semiconductor Index ($SOX +1.66%) and Networking Index ($NWX +0.87%) also rose. The Oil Services Index ($OSX +2.28%) outpaced the Integrated Oil Index ($XOI +0.68%) and the Gold & Silver Index ($XAU +0.27%).
PICTURED: The Biotech Index ($BTK +1.93%) rallied above its 50-day and 200-day moving average (DMA) lines which recently converged.
| Oil Services |
$OSX |
51.27 |
+1.14 |
+2.28% |
+15.65% |
| Integrated Oil |
$XOI |
985.33 |
+6.65 |
+0.68% |
+24.33% |
| Semiconductor |
$SOX |
3,250.04 |
+53.06 |
+1.66% |
+16.26% |
| Networking |
$NWX |
811.43 |
+6.99 |
+0.87% |
+13.15% |
| Broker/Dealer |
$XBD |
461.14 |
+1.80 |
+0.39% |
+22.12% |
| Retail |
$RLX |
3,928.89 |
+26.53 |
+0.68% |
+10.26% |
| Gold & Silver |
$XAU |
148.93 |
+0.40 |
+0.27% |
+3.29% |
| Bank |
$BKX |
124.34 |
+1.33 |
+1.08% |
+27.00% |
| Biotech |
$BTK |
5,739.02 |
+108.58 |
+1.93% |
+0.00% |
|
|
|
 |
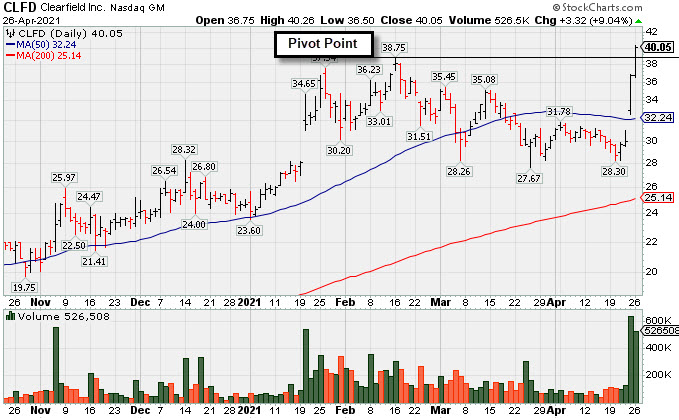
Rallied Straight Up From Bottom of 10-Week Base
Kenneth J. Gruneisen - Passed the CAN SLIM® Master's Exam
Clearfield Inc (CLFD +$3.32 or +9.04% to $40.05) finished strong after highlighted in yellow with new pivot point cited based on its 2/16/21 high plus 10 cents in the earlier mid-day report (read here). The gain backed by +271% above average volume and strong close above the pivot point clinched a convincing new technical buy signal. It hit a new 52-week high (N criteria) with today's 4th consecutive gain, rallying straight up from the bottom of a 10-week base. CLFD rebounded above its 50-day moving average (DMA) line ($32.23) with a big gap up on the prior session.
Bullish action came after it reported Mar '21 quarterly earnings +440% on +45% sales revenues versus the year ago period, continuing its strong earnings track record. The high-ranked TELECOMMUNICATIONS - Fiber Optics firm has reported 5 consecutive quarterly earnings comparisons above the +25% minimum guideline (C criteria). Annual earnings (A criteria) history has improved after a downturn in FY '17.
CLFD traded up more than 75% since first highlighted in yellow with pivot point cited based on its 11/09/20 high plus 10 cents in the 11/17/20 mid-day report (read here). It found support near prior highs in the $28 area since dropped from the Featured Stocks list, showing resilience since last shown in this FSU section on 3/29/21 with an annotated graph under the headline, "Fell Further Below 50-Day Average Testing Near Old High".
The number of top-rated funds owning its shares rose from 132 in Jun '20 to 160 in Mar '21. Its current Up/Down Volume Ratio of 1.1 is an unbiased indication its shares have been under slight accumulation over the past 50 days.Its Accumulation/Distribution Rating is B- and Timeliness Rating is C, and its Sponsorship Rating is D.
|
|
|
Color Codes Explained :
Y - Better candidates highlighted by our
staff of experts.
G - Previously featured
in past reports as yellow but may no longer be buyable under the
guidelines.
***Last / Change / Volume data in this table is the closing quote data***
Symbol/Exchange
Company Name
Industry Group |
PRICE |
CHANGE
(%Change) |
Day High |
Volume
(% DAV)
(% 50 day avg vol) |
52 Wk Hi
% From Hi |
Featured
Date |
Price
Featured |
Pivot Featured |
|
Max Buy |
 SIVB
-
NASDAQ
SIVB
-
NASDAQ
S V B Financial Group
BANKING - Regional - Pacific Banks
|
$572.93
|
+8.71
1.54% |
$579.39
|
491,365
89.99% of 50 DAV
50 DAV is 546,000
|
$585.25
-2.11%
|
4/23/2021
|
$579.70
|
PP = $577.16
|
|
MB = $606.02
|
Most Recent Note - 4/23/2021 5:01:55 PM
Y - Posted a solid gain but did not close above the pivot point cited based on its 3/18/21 high plus 10 cents. Spiked to a new all-time high with today's volume-driven gain. Bullish action came after it reported earnings +293% on +64% sales revenues for the Mar '21 quarter versus the year ago period, its 3rd strong comparison. Completed a new Public Offering on 3/24/21. Went through a deep consolidation and made impressive progress since dropped from the Featured Stocks list on 10/23/18. See the latest FSU analysis for more details.
>>> FEATURED STOCK ARTICLE : Hit New High But Closed Below Pivot Point - 4/23/2021 |
View all notes |
Set NEW NOTE alert |
Company Profile |
SEC
News |
Chart |
Request a new note
C
A
S
I |
CRL
-
NYSE
Charles River Labs Intl
DRUGS - Biotechnology
|
$336.44
|
+2.10
0.63% |
$337.48
|
288,932
88.63% of 50 DAV
50 DAV is 326,000
|
$336.56
-0.04%
|
12/17/2020
|
$247.06
|
PP = $257.98
|
|
MB = $270.88
|
 Most Recent Note - 4/26/2021 5:11:39 PM
G - Wedged to another new all-time high with today's 4th consecutive gain backed by lighter volume. Its 50 DMA line ($295) acted as support throughout its ongoing ascent. Its Relative Strength Rating is 84, above the 80+ minimum guideline for buy candidates. Dec '20 quarterly earnings rose +19% on +14% sales revenues versus the year ago period, below the +25% minimum earnings guideline (C criteria), raising fundamental concerns.
>>> FEATURED STOCK ARTICLE : Perched at Record High After Rally From 50-Day Moving Average - 4/9/2021 |
View all notes |
Set NEW NOTE alert |
Company Profile |
SEC
News |
Chart |
Request a new note
C
A
S
I |
BRKS
-
NASDAQ
Brooks Automation
ELECTRONICS - Semiconductor Equipment and Mate
|
$106.72
|
+3.98
3.87% |
$107.35
|
677,988
93.26% of 50 DAV
50 DAV is 727,000
|
$104.40
2.22%
|
4/5/2021
|
$99.31
|
PP = $91.88
|
|
MB = $96.47
|
Most Recent Note - 4/23/2021 5:04:03 PM
G - Posted a 3rd consecutive gain today with average volume for a best-ever close, getting extended from the prior base. Prior highs in the $91 area define initial support to watch above its 50 DMA line ($87.72).
>>> FEATURED STOCK ARTICLE : High Ranked Semiconductor Equipment Firm Powered Higher - 4/7/2021 |
View all notes |
Set NEW NOTE alert |
Company Profile |
SEC
News |
Chart |
Request a new note
C
A
S
I |
ENTG
-
NASDAQ
Entegris Inc
ELECTRONICS - Semiconductor Equipment and Mate
|
$115.26
|
+2.11
1.86% |
$116.14
|
1,001,457
104.86% of 50 DAV
50 DAV is 955,000
|
$126.41
-8.82%
|
4/1/2021
|
$118.42
|
PP = $110.37
|
|
MB = $115.89
|
Most Recent Note - 4/22/2021 5:13:40 PM
Y - Sputtering near the prior high in the $110 area which defines support to watch above its 50 DMA line ($107.83). More damaging losses would raise concerns and trigger technical sell signals. See the latest FSU analysis for more details and a new annotated graph.
>>> FEATURED STOCK ARTICLE : Negated Recent Breakout and Sputtering Near Prior High - 4/22/2021 |
View all notes |
Set NEW NOTE alert |
Company Profile |
SEC
News |
Chart |
Request a new note
C
A
S
I |
OPY
-
NYSE
Oppenheimer Holdings Inc
FINANCIAL SERVICES - Investment Brokerage - Regiona
|
$46.96
|
-0.45
-0.95% |
$48.33
|
94,219
78.52% of 50 DAV
50 DAV is 120,000
|
$47.68
-1.51%
|
2/25/2021
|
$38.95
|
PP = $38.11
|
|
MB = $40.02
|
Most Recent Note - 4/23/2021 5:05:23 PM
G - Posted a big gain today with average volume for a new 52-week high. It is extended from any sound base. Its 50 DMA line ($41) and prior low define near-term support to watch on pullbacks.
>>> FEATURED STOCK ARTICLE : Negative Reversal After 7 Consecutive Gains - 4/20/2021 |
View all notes |
Set NEW NOTE alert |
Company Profile |
SEC
News |
Chart |
Request a new note
C
A
S
I |
Symbol/Exchange
Company Name
Industry Group |
PRICE |
CHANGE
(%Change) |
Day High |
Volume
(% DAV)
(% 50 day avg vol) |
52 Wk Hi
% From Hi |
Featured
Date |
Price
Featured |
Pivot Featured |
|
Max Buy |
LAD
-
NYSE
Lithia Motors Inc Cl A
SPECIALTY RETAIL - Auto Dealerships
|
$387.19
|
-3.51
-0.90% |
$393.78
|
330,791
111.75% of 50 DAV
50 DAV is 296,000
|
$417.98
-7.37%
|
4/21/2021
|
$377.00
|
PP = $418.08
|
|
MB = $438.98
|
Most Recent Note - 4/21/2021 5:55:20 PM
Y - Finished strong today after highlighted in yellow in the earlier mid-day report with a pivot point cited based on its 3/17/21 high plus 10 cents. Today's volume-driven gain helped it close back above its 50 DMA line ($384) which has acted as support during its ongoing ascent. Subsequent gains above the pivot point backed by at least +40% above average volume may trigger a technical buy signal. Completed a new Public Offering on 9/30/20. Reported earnings +193% on +55% sales revenues for the Mar '21 quarter versus the year ago period, its 3rd consecutive quarterly earnings increases above the +25% minimum (C criteria) guideline with sequential quarters showing acceleration in its sales revenues growth rate. This Medford, Oregon-based Retail/Wholesale - Automobile firm's annual earnings history (A criteria) has been strong and steady after a dramatic downturn in FY '07 and '08 earnings. See the latest FSU analysis for more details and a new annotated graph.
>>> FEATURED STOCK ARTICLE : Building a Base With Rebound Above 50-Day Moving Average - 4/21/2021 |
View all notes |
Set NEW NOTE alert |
Company Profile |
SEC
News |
Chart |
Request a new note
C
A
S
I |
CLFD
-
NASDAQ
Clearfield Inc
TELECOMMUNICATIONS - Cables / Satalite Equipment
|
$40.05
|
+3.32
9.04% |
$40.26
|
526,508
373.41% of 50 DAV
50 DAV is 141,000
|
$38.75
3.35%
|
4/26/2021
|
$39.68
|
PP = $38.85
|
|
MB = $40.79
|
Most Recent Note - 4/26/2021 5:09:41 PM
Y - Finished strong after highlighted in yellow with new pivot point cited based on its 2/16/21 high plus 10 cents in the earlier mid-day report. The big gain for a new 52-week high and strong close above the pivot point backed by +273% above average volume clinched a convincing new technical buy signal. Rebounded above its 50 DMA line ($32.23) with a big gap up on the prior session. Bullish action came after it reported Mar '21 quarterly earnings +440% on +45% sales revenues versus the year ago period, continuing its strong earnings track record. Found support near prior highs in the $28 area since dropped from the Featured Stocks list on 3/29/21. See the latest FSU analysis fore more details and a new annotated graph.
>>> FEATURED STOCK ARTICLE : Rallied Straight Up From Bottom of 10-Week Base - 4/26/2021 |
View all notes |
Set NEW NOTE alert |
Company Profile |
SEC
News |
Chart |
Request a new note
C
A
S
I |
EDUC
-
NASDAQ
Educational Development
WHOLESALE - Basic Materials Wholesale
|
$17.18
|
-0.08
-0.46% |
$17.55
|
4,977
18.43% of 50 DAV
50 DAV is 27,000
|
$20.00
-14.10%
|
3/10/2021
|
$17.89
|
PP = $20.10
|
|
MB = $21.11
|
Most Recent Note - 4/21/2021 5:56:20 PM
Y - Volume totals are cooling while still consolidating above its 50 DMA line ($17.02) which defines important near-term support. Met stubborn resistance in the $19-20 area. Subsequent gains above the pivot point backed by at least +40% above average volume are needed to trigger a proper technical buy signal.
>>> FEATURED STOCK ARTICLE : Finding Support During Consolidation Above 50-Day Moving Average - 4/16/2021 |
View all notes |
Set NEW NOTE alert |
Company Profile |
SEC
News |
Chart |
Request a new note
C
A
S
I |
SMPL
-
NASDAQ
Simply Good Foods Co
Food-Confectionery
|
$34.32
|
+0.68
2.02% |
$34.35
|
340,413
47.54% of 50 DAV
50 DAV is 716,000
|
$35.25
-2.64%
|
12/28/2020
|
$30.40
|
PP = $31.44
|
|
MB = $33.01
|
Most Recent Note - 4/26/2021 5:21:36 PM
G - Posted a quiet gain today for its 2nd best ever close, still perched within close striking distance of its 52-week and all-time highs with volume totals cooling. Reported Feb '21 quarterly earnings +9% on +2% sales revenues versus the year ago period, below the +25% minimum earnings guideline (C criteria), raising fundamental concerns. Found prompt support near its 50 DMA line ($31.23) but its current Relative Strength Rating is 79, one notch below the 80+ minimum guideline for buy candidates.
>>> FEATURED STOCK ARTICLE : Perched Near High But Fundamental Concerns Were Raised - 4/14/2021 |
View all notes |
Set NEW NOTE alert |
Company Profile |
SEC
News |
Chart |
Request a new note
C
A
S
I |
IBP
-
NYSE
Installed Building Prod
DIVERSIFIED SERVICES - Business/Management Services
|
$132.42
|
+1.29
0.98% |
$134.16
|
107,398
47.73% of 50 DAV
50 DAV is 225,000
|
$133.30
-0.66%
|
4/19/2021
|
$131.15
|
PP = $130.21
|
|
MB = $136.72
|
Most Recent Note - 4/23/2021 12:41:11 PM
Y - Hovering near its all-time high with today's volume-driven gain. A gain and strong close above its pivot point may help clinch a convincing technical buy signal. Reported earnings +34% on +10% sales revenues for the Dec '20 quarter versus the year-ago period. Three of the past 4 consecutive quarterly comparisons were above the +25% minimum earnings guideline (C criteria). Annual earnings (A criteria) history has been strong.
>>> FEATURED STOCK ARTICLE : Steady Streak of Gains Into New High Territory - 4/19/2021 |
View all notes |
Set NEW NOTE alert |
Company Profile |
SEC
News |
Chart |
Request a new note
C
A
S
I |
Symbol/Exchange
Company Name
Industry Group |
PRICE |
CHANGE
(%Change) |
Day High |
Volume
(% DAV)
(% 50 day avg vol) |
52 Wk Hi
% From Hi |
Featured
Date |
Price
Featured |
Pivot Featured |
|
Max Buy |
QRVO
-
NASDAQ
Qorvo Inc
ELECTRONICS - Semiconductor - Integrated Cir
|
$198.97
|
+5.05
2.60% |
$199.88
|
725,206
61.15% of 50 DAV
50 DAV is 1,186,000
|
$199.94
-0.49%
|
4/1/2021
|
$190.48
|
PP = $191.92
|
|
MB = $201.52
|
Most Recent Note - 4/23/2021 5:08:25 PM
Y - Posted a big gain today with light volume, rising from its 50 DMA line ($180.55). That important short-term average acted as support when it stalled after recently wedging up to new highs from a 9-week base. Its Relative Strength Rating has slumped to 77, below the 80+ minimum for buy candidates.
>>> FEATURED STOCK ARTICLE : Hit Another New High With Even Less Volume Conviction - 4/5/2021 |
View all notes |
Set NEW NOTE alert |
Company Profile |
SEC
News |
Chart |
Request a new note
C
A
S
I |
YETI
-
NYSE
Yeti Holdings Inc
Leisure-Products
|
$87.99
|
+0.16
0.18% |
$89.70
|
891,985
62.42% of 50 DAV
50 DAV is 1,429,000
|
$89.08
-1.22%
|
4/6/2021
|
$76.95
|
PP = $79.42
|
|
MB = $83.39
|
Most Recent Note - 4/21/2021 5:58:37 PM
G - Posted a solid gain on lighter volume today. Perched near its all-time high and slightly extended from the latest base. Prior highs in the $80 area define initial support to watch on pullbacks.
>>> FEATURED STOCK ARTICLE : YETI Perched Within Striking Distance of High - 4/7/2021 |
View all notes |
Set NEW NOTE alert |
Company Profile |
SEC
News |
Chart |
Request a new note
C
A
S
I |
DT
-
NYSE
Dynatrace Inc
Computer Sftwr-Enterprse
|
$54.43
|
+1.58
2.99% |
$54.65
|
1,246,453
60.18% of 50 DAV
50 DAV is 2,071,100
|
$56.94
-4.41%
|
4/26/2021
|
$54.43
|
PP = $57.04
|
|
MB = $59.89
|
Most Recent Note - 4/26/2021 5:17:34 PM
Y - Today it posted a 4th consecutive gain on below average volume, rebounding above its 50 DMA line toward its 52-week high. Color code is changed to yellow with new pivot point cited based on its 3/16/21 high plus 10 cents. Subsequent gains above the pivot point backed by at least +40% above average volume may trigger a new (or add-on) technical buy signal. Recent lows in the $45 area define important near-term support to watch on pullbacks. Its Relative Strength Rating is 72, below the 80+ minimum guideline for buy candidates, however it is perched only -4.4% off its all-time high. Fundamentals remain strong after it reported Dec '20 earnings +70% on +28% sales revenues versus the year ago period.
>>> FEATURED STOCK ARTICLE : Gap Up Rebounding Further Above 50-Day Moving Average - 4/8/2021 |
View all notes |
Set NEW NOTE alert |
Company Profile |
SEC
News |
Chart |
Request a new note
C
A
S
I |
MRBK
-
NASDAQ
Meridian Corp
Banks-Northeast
|
$24.74
|
-0.36
-1.43% |
$25.76
|
39,333
109.26% of 50 DAV
50 DAV is 36,000
|
$27.96
-11.52%
|
2/22/2021
|
$25.58
|
PP = $26.10
|
|
MB = $27.41
|
Most Recent Note - 4/26/2021 5:19:38 PM
G - Color code was changed to green after slumping below its 50 DMA line ($25.56) encountering distributional pressure. Also quietly undercut the prior low ($24.13 on 3/25/21). More damaging losses may trigger technical sell signals. Its Relative Strength Rating is 79, just below the 80+ minimum guideline.
>>> FEATURED STOCK ARTICLE : Encountering Distributional Pressure - 4/12/2021 |
View all notes |
Set NEW NOTE alert |
Company Profile |
SEC
News |
Chart |
Request a new note
C
A
S
I |
|
|
|
THESE ARE NOT BUY RECOMMENDATIONS!
Comments contained in the body of this report are technical
opinions only. The material herein has been obtained
from sources believed to be reliable and accurate, however,
its accuracy and completeness cannot be guaranteed.
This site is not an investment advisor, hence it does
not endorse or recommend any securities or other investments.
Any recommendation contained in this report may not
be suitable for all investors and it is not to be deemed
an offer or solicitation on our part with respect to
the purchase or sale of any securities. All trademarks,
service marks and trade names appearing in this report
are the property of their respective owners, and are
likewise used for identification purposes only.
This report is a service available
only to active Paid Premium Members.
You may opt-out of receiving report notifications
at any time. Questions or comments may be submitted
by writing to Premium Membership Services 665 S.E. 10 Street, Suite 201 Deerfield Beach, FL 33441-5634 or by calling 1-800-965-8307
or 954-785-1121.
|
|
|