You are not logged in.
This means you
CAN ONLY VIEW reports that were published prior to Thursday, March 20, 2025.
You
MUST UPGRADE YOUR MEMBERSHIP if you want to see any current reports.
AFTER MARKET UPDATE - WEDNESDAY, APRIL 28TH, 2021
Previous After Market Report Next After Market Report >>>
|
|
|
|
DOW |
-164.55 |
33,820.38 |
-0.48% |
|
Volume |
820,055,603 |
+5% |
|
Volume |
4,468,520,700 |
-3% |
|
NASDAQ |
-39.95 |
14,050.27 |
-0.28% |
|
Advancers |
1,905 |
59% |
|
Advancers |
2,303 |
56% |
|
S&P 500 |
-3.53 |
4,183.19 |
-0.08% |
|
Decliners |
1,326 |
41% |
|
Decliners |
1,828 |
44% |
|
Russell 2000 |
+2.90 |
2,304.16 |
+0.13% |
|
52 Wk Highs |
311 |
|
|
52 Wk Highs |
191 |
|
|
S&P 600 |
+2.16 |
1,363.05 |
+0.16% |
|
52 Wk Lows |
20 |
|
|
52 Wk Lows |
30 |
|
|
 |
Major Indices Sputter Ahead of Biden's $1.8 Trillion Spending Plan
Kenneth J. Gruneisen - Passed the CAN SLIM® Master's Exam
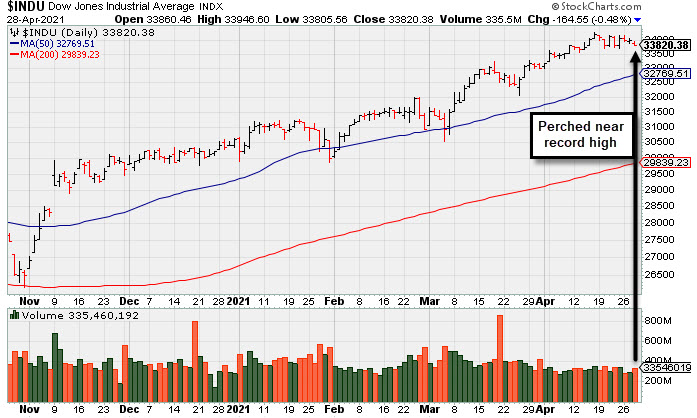
The Dow lost 164 points, while the S&P 500 dipped less than 0.1% after hitting a new record level during intraday trading. The Nasdaq Composite fell 0.3%. The volume totals reported were mixed, higher than the prior session on the NYSE and lighter on the Nasdaq exchange. Advancers led decliners by a 3-2 margin on the NYSE and by 11-9 on the Nasdaq exchange. There were 51 high-ranked companies from the Leaders List that hit new 52-week highs and were listed on the BreakOuts Page, versus the total of 61 on the prior session. New 52-week highs totals expanded and solidly outnumbered new 52-week lows on both the NYSE and the Nasdaq exchange. The major indices (M criteria) are in a confirmed uptrend. Investors are reminded to always make buying and selling decisions on case-by-case basis under the strict criteria and rules of the fact-based investment system.
PICTURED: The Dow Jones Industrial Average is perched within close striking distance of a new record high.
U.S. stocks finished lower on Wednesday as investors digested a flood of corporate earnings results and the Federal Reserve's policy decision. Officials kept the benchmark fed-funds rate unchanged in the near zero-bound range and did not alter the pace of its bond buying program. Furthermore, Fed Chair Jerome Powell said “it is not time yet” to begin discussing tapering asset purchases, repeating that “substantial further progress” on both employment and inflation would first need to be met. Policymakers also improved their assessment of the economy and reiterated that price pressures appeared transitory. Investors will now turn their attention to President Biden’s address tonight during a joint session of Congress, during which he is expected to unveil his $1.8 trillion "American Families Plan.”
Treasuries erased earlier losses, with the yield on the 10-year note ending the day down one basis point to 1.61%. In commodities, WTI crude rose 1.4% to $63.79/barrel as a gauge of the U.S. dollar slumped 0.4%, on course for a 2.4% monthly slide.
In earnings, Microsoft (MSFT -2.83%) fell as its ninth straight quarter of topping Wall Street's estimates failed to satisfy lofty expectations. Meanwhile, Google parent Alphabet (GOOGL +2.97%) rose after shattering sales records on robust travel- and retail-related ad revenue and announcing a $50 billion share buyback plan. Boeing (BA -2.89%) after posting its wider-than-anticipated (and sixth consecutive) quarterly loss. |
 Kenneth J. Gruneisen started out as a licensed stockbroker in August 1987, a couple of months prior to the historic stock market crash that took the Dow Jones Industrial Average down -22.6% in a single day. He has published daily fact-based fundamental and technical analysis on high-ranked stocks online for two decades. Through FACTBASEDINVESTING.COM, Kenneth provides educational articles, news, market commentary, and other information regarding proven investment systems that work in good times and bad.
Comments contained in the body of this report are technical opinions only and are not necessarily those of Gruneisen Growth Corp. The material herein has been obtained from sources believed to be reliable and accurate, however, its accuracy and completeness cannot be guaranteed. Our firm, employees, and customers may effect transactions, including transactions contrary to any recommendation herein, or have positions in the securities mentioned herein or options with respect thereto. Any recommendation contained in this report may not be suitable for all investors and it is not to be deemed an offer or solicitation on our part with respect to the purchase or sale of any securities. |
|
 |
Energy Groups Post Big Gains as Retail, Financials Edge Higher
Kenneth J. Gruneisen - Passed the CAN SLIM® Master's Exam
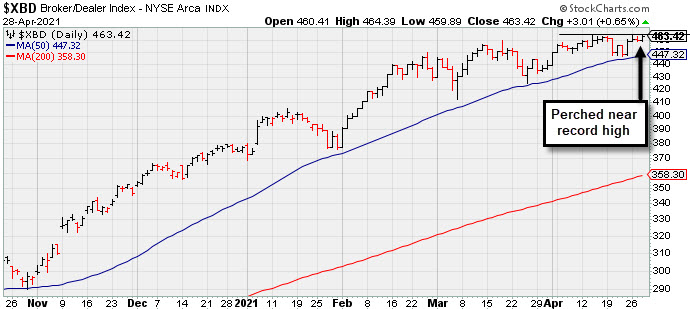
The Retail Index ($RLX +0.56%), Broker/Dealer Index ($XBD +0.65%), and Bank Index ($BKX +0.68%) each posted a modest gain that helped underpin the major averages. The Oil Services Index ($OSX +5.80%) and Integrated Oil Index ($XOI +3.59%) posted standout gains while the Gold & Silver Index ($XAU +1.08%) posted a smaller gain. Meanwhile, the tech sector had a negative bias as the Semiconductor Index ($SOX -1.46%) led the Networking Index ($NWX -0.67%) and Biotech Index ($BTK -0.40%) lower.
PICTURED: The Broker/Dealer Index ($XBD +0.65%) is perched near its record high.
| Oil Services |
$OSX |
53.85 |
+2.95 |
+5.80% |
+21.47% |
| Integrated Oil |
$XOI |
1,036.61 |
+35.97 |
+3.59% |
+30.81% |
| Semiconductor |
$SOX |
3,178.56 |
-47.05 |
-1.46% |
+13.70% |
| Networking |
$NWX |
803.19 |
-5.46 |
-0.67% |
+12.00% |
| Broker/Dealer |
$XBD |
463.42 |
+3.01 |
+0.65% |
+22.73% |
| Retail |
$RLX |
3,964.62 |
+21.93 |
+0.56% |
+11.26% |
| Gold & Silver |
$XAU |
147.61 |
+1.57 |
+1.08% |
+2.37% |
| Bank |
$BKX |
126.44 |
+0.85 |
+0.68% |
+29.14% |
| Biotech |
$BTK |
5,665.92 |
-22.88 |
-0.40% |
-1.27% |
|
|
|
 |
Earnings Acceleration and Perched at High After Ascending Base
Kenneth J. Gruneisen - Passed the CAN SLIM® Master's Exam
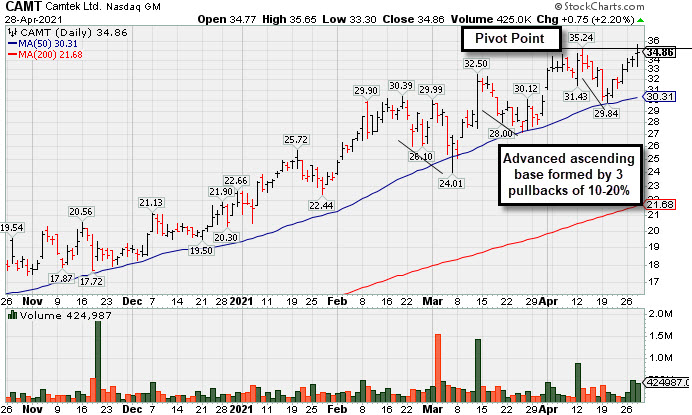
Camtek Ltd (CAMT +$0.75 or +2.20% to $34.86) was highlighted in yellow with pivot point cited based on its 4/13/21 high plus 10 cents in the earlier mid-day report (read here). After forming an advanced "ascending base" pattern it touched a new all-time high with today's 4th consecutive gain backed by ever-increasing volume. Subsequent gains and a strong close above the pivot point backed by at least +40% above average volume may trigger a technical buy signal. It found prompt support near its 50-day moving average (DMA) line ($30.31) during recent consolidations.
CAMT reported earnings +267% on +90% sales revenues for the Mar '21 quarter versus the year ago period, its 3rd strong quarterly comparison well above the +25% minimum guideline (C criteria) and showing impressive sequential acceleration. This Israeli Electronics firm has a strong annual earnings (A criteria) history. It has a 96 Earnings Per Share Rating.
The number of top-rated funds owning its shares rose from 48 in Jun '20 to 87 on Mar '21 a reassuring sign concerning the I criteria. Its current Up/Down Volume Ratio of 1.3 is an unbiased indication its shares have been under accumulation over the past 50 days. It completed a new Public Offering on 11/19/20. Still, its small supply of only 43.3 million shares outstanding (S criteria) can contribute to greater price volatility in the event of institutional buying or selling. It has a Timeliness Rating of A and a Sponsorship Rating of B. |
|
|
Color Codes Explained :
Y - Better candidates highlighted by our
staff of experts.
G - Previously featured
in past reports as yellow but may no longer be buyable under the
guidelines.
***Last / Change / Volume data in this table is the closing quote data***
Symbol/Exchange
Company Name
Industry Group |
PRICE |
CHANGE
(%Change) |
Day High |
Volume
(% DAV)
(% 50 day avg vol) |
52 Wk Hi
% From Hi |
Featured
Date |
Price
Featured |
Pivot Featured |
|
Max Buy |
 SIVB
-
NASDAQ
SIVB
-
NASDAQ
S V B Financial Group
BANKING - Regional - Pacific Banks
|
$571.81
|
-4.09
-0.71% |
$579.00
|
354,809
63.93% of 50 DAV
50 DAV is 555,000
|
$585.25
-2.30%
|
4/23/2021
|
$579.70
|
PP = $577.16
|
|
MB = $606.02
|
Most Recent Note - 4/23/2021 5:01:55 PM
Y - Posted a solid gain but did not close above the pivot point cited based on its 3/18/21 high plus 10 cents. Spiked to a new all-time high with today's volume-driven gain. Bullish action came after it reported earnings +293% on +64% sales revenues for the Mar '21 quarter versus the year ago period, its 3rd strong comparison. Completed a new Public Offering on 3/24/21. Went through a deep consolidation and made impressive progress since dropped from the Featured Stocks list on 10/23/18. See the latest FSU analysis for more details.
>>> FEATURED STOCK ARTICLE : Hit New High But Closed Below Pivot Point - 4/23/2021 |
View all notes |
Set NEW NOTE alert |
Company Profile |
SEC
News |
Chart |
Request a new note
C
A
S
I |
CROX
-
NASDAQ
Crocs Inc
CONSUMER NON-DURABLES - Textile - Apparel Footwear
|
$98.41
|
+0.59
0.60% |
$102.85
|
3,262,292
262.66% of 50 DAV
50 DAV is 1,242,000
|
$101.00
-2.56%
|
4/27/2021
|
$99.81
|
PP = $86.50
|
|
MB = $90.83
|
 Most Recent Note - 4/28/2021 12:38:26 PM
Y - Holding its ground today. Finished strong on the prior session after highlighted in yellow with pivot point cited based on its 3/15/21 high plus 10 cents. Hit new 52-week and all-time highs with a big "breakaway gap" and 5th consecutive gain with increasing volume triggering a technical buy signal. Bullish action came after it reported Mar '21 quarterly earnings +577% on +64% sales revenues versus the year ago period, its 3rd strong quarterly comparison after some negative comparisons. Annual earnings (A criteria) growth has been strong and steady following losses in FY '15 and '16.
>>> FEATURED STOCK ARTICLE : Powerful "Breakaway Gap" for CROX - 4/27/2021 |
View all notes |
Set NEW NOTE alert |
Company Profile |
SEC
News |
Chart |
Request a new note
C
A
S
I |
CRL
-
NYSE
Charles River Labs Intl
DRUGS - Biotechnology
|
$334.80
|
+0.43
0.13% |
$335.63
|
283,688
88.38% of 50 DAV
50 DAV is 321,000
|
$337.48
-0.79%
|
12/17/2020
|
$247.06
|
PP = $257.98
|
|
MB = $270.88
|
Most Recent Note - 4/26/2021 5:11:39 PM
G - Wedged to another new all-time high with today's 4th consecutive gain backed by lighter volume. Its 50 DMA line ($295) acted as support throughout its ongoing ascent. Its Relative Strength Rating is 84, above the 80+ minimum guideline for buy candidates. Dec '20 quarterly earnings rose +19% on +14% sales revenues versus the year ago period, below the +25% minimum earnings guideline (C criteria), raising fundamental concerns.
>>> FEATURED STOCK ARTICLE : Perched at Record High After Rally From 50-Day Moving Average - 4/9/2021 |
View all notes |
Set NEW NOTE alert |
Company Profile |
SEC
News |
Chart |
Request a new note
C
A
S
I |
CAMT
-
NASDAQ
Camtek Ltd
ELECTRONICS - Scientific and Technical Instrum
|
$34.86
|
+0.75
2.20% |
$35.65
|
424,987
140.72% of 50 DAV
50 DAV is 302,000
|
$35.24
-1.08%
|
4/28/2021
|
$35.03
|
PP = $35.34
|
|
MB = $37.11
|
Most Recent Note - 4/28/2021 5:00:17 PM
Y - Color code was changed to yellow with pivot point cited based on its 4/13/21 high plus 10 cents. After forming an advanced "ascending base" pattern it touched a new all-time high with today's 4th consecutive gain backed by above average volume. Subsequent gains and a strong close above the pivot point backed by at least +40% above average volume may trigger a technical buy signal. Completed a new Public Offering on 11/19/20. Found prompt support near its 50 DMA line ($30.31) during recent consolidations. Reported earnings +267% on +90% sales revenues for the Mar '21 quarter versus the year ago period, its 3rd strong quarterly comparison well above the +25% minimum guideline and showing impressive sequential acceleration. This Israeli Electronics firm has a strong annual earnings (A criteria) history. See the latest FSU analysis for more details and a new annotated graph.
>>> FEATURED STOCK ARTICLE : Earnings Acceleration and Perched at High After Ascending Base - 4/28/2021 |
View all notes |
Set NEW NOTE alert |
Company Profile |
SEC
News |
Chart |
Request a new note
C
A
S
I |
BRKS
-
NASDAQ
Brooks Automation
ELECTRONICS - Semiconductor Equipment and Mate
|
$107.47
|
+1.97
1.87% |
$108.14
|
777,423
106.06% of 50 DAV
50 DAV is 733,000
|
$108.72
-1.15%
|
4/5/2021
|
$99.31
|
PP = $91.88
|
|
MB = $96.47
|
Most Recent Note - 4/23/2021 5:04:03 PM
G - Posted a 3rd consecutive gain today with average volume for a best-ever close, getting extended from the prior base. Prior highs in the $91 area define initial support to watch above its 50 DMA line ($87.72).
>>> FEATURED STOCK ARTICLE : High Ranked Semiconductor Equipment Firm Powered Higher - 4/7/2021 |
View all notes |
Set NEW NOTE alert |
Company Profile |
SEC
News |
Chart |
Request a new note
C
A
S
I |
Symbol/Exchange
Company Name
Industry Group |
PRICE |
CHANGE
(%Change) |
Day High |
Volume
(% DAV)
(% 50 day avg vol) |
52 Wk Hi
% From Hi |
Featured
Date |
Price
Featured |
Pivot Featured |
|
Max Buy |
ENTG
-
NASDAQ
Entegris Inc
ELECTRONICS - Semiconductor Equipment and Mate
|
$114.79
|
+0.01
0.01% |
$115.42
|
921,915
97.56% of 50 DAV
50 DAV is 945,000
|
$126.41
-9.19%
|
4/1/2021
|
$118.42
|
PP = $110.37
|
|
MB = $115.89
|
Most Recent Note - 4/27/2021 5:35:58 PM
Y - Recently found support while consolidating near the prior high in the $110 area which defines support to watch above its 50 DMA line ($108.73). More damaging losses would raise concerns and trigger technical sell signals.
>>> FEATURED STOCK ARTICLE : Negated Recent Breakout and Sputtering Near Prior High - 4/22/2021 |
View all notes |
Set NEW NOTE alert |
Company Profile |
SEC
News |
Chart |
Request a new note
C
A
S
I |
OPY
-
NYSE
Oppenheimer Holdings Inc
FINANCIAL SERVICES - Investment Brokerage - Regiona
|
$47.36
|
+0.11
0.23% |
$47.52
|
81,235
66.04% of 50 DAV
50 DAV is 123,000
|
$48.33
-2.01%
|
2/25/2021
|
$38.95
|
PP = $38.11
|
|
MB = $40.02
|
Most Recent Note - 4/23/2021 5:05:23 PM
G - Posted a big gain today with average volume for a new 52-week high. It is extended from any sound base. Its 50 DMA line ($41) and prior low define near-term support to watch on pullbacks.
>>> FEATURED STOCK ARTICLE : Negative Reversal After 7 Consecutive Gains - 4/20/2021 |
View all notes |
Set NEW NOTE alert |
Company Profile |
SEC
News |
Chart |
Request a new note
C
A
S
I |
LAD
-
NYSE
Lithia Motors Inc Cl A
SPECIALTY RETAIL - Auto Dealerships
|
$395.58
|
-1.84
-0.46% |
$403.11
|
270,521
90.78% of 50 DAV
50 DAV is 298,000
|
$417.98
-5.36%
|
4/21/2021
|
$377.00
|
PP = $418.08
|
|
MB = $438.98
|
Most Recent Note - 4/27/2021 5:32:23 PM
Y - Posted a gain today with +19% above average volume. Stubbornly held its ground and wedged higher since highlighted in yellow in the 4/21/21 mid-day report with a pivot point cited based on its 3/17/21 high plus 10 cents. Subsequent gains above the pivot point backed by at least +40% above average volume may trigger a technical buy signal.
>>> FEATURED STOCK ARTICLE : Building a Base With Rebound Above 50-Day Moving Average - 4/21/2021 |
View all notes |
Set NEW NOTE alert |
Company Profile |
SEC
News |
Chart |
Request a new note
C
A
S
I |
CLFD
-
NASDAQ
Clearfield Inc
TELECOMMUNICATIONS - Cables / Satalite Equipment
|
$37.01
|
-0.43
-1.15% |
$37.51
|
120,232
80.69% of 50 DAV
50 DAV is 149,000
|
$40.26
-8.07%
|
4/26/2021
|
$39.68
|
PP = $38.85
|
|
MB = $40.79
|
Most Recent Note - 4/27/2021 5:28:42 PM
Y - Pulled back for a big loss today, retreating abruptly. Finished strong on the prior session after highlighted in yellow with new pivot point cited based on its 2/16/21 high plus 10 cents. The big gain for a new 52-week high and strong close above the pivot point backed by +273% above average volume clinched a convincing new technical buy signal. Rebounded above its 50 DMA line ($32.23) with a big gap up on the prior session. Bullish action came after it reported Mar '21 quarterly earnings +440% on +45% sales revenues versus the year ago period, continuing its strong earnings track record. Found support near prior highs in the $28 area since dropped from the Featured Stocks list on 3/29/21.
>>> FEATURED STOCK ARTICLE : Rallied Straight Up From Bottom of 10-Week Base - 4/26/2021 |
View all notes |
Set NEW NOTE alert |
Company Profile |
SEC
News |
Chart |
Request a new note
C
A
S
I |
EDUC
-
NASDAQ
Educational Development
WHOLESALE - Basic Materials Wholesale
|
$17.98
|
-0.32
-1.75% |
$18.60
|
23,655
87.61% of 50 DAV
50 DAV is 27,000
|
$20.00
-10.10%
|
3/10/2021
|
$17.89
|
PP = $20.10
|
|
MB = $21.11
|
Most Recent Note - 4/27/2021 12:26:38 PM
Y - Tallying a big volume-driven gain today after 3 gains backed by light volume. Volume totals cooled while consolidating above its 50 DMA line ($17.14) which defines important near-term support. Met stubborn resistance in the $19-20 area. Subsequent gains above the pivot point backed by at least +40% above average volume are needed to trigger a proper technical buy signal.
>>> FEATURED STOCK ARTICLE : Finding Support During Consolidation Above 50-Day Moving Average - 4/16/2021 |
View all notes |
Set NEW NOTE alert |
Company Profile |
SEC
News |
Chart |
Request a new note
C
A
S
I |
Symbol/Exchange
Company Name
Industry Group |
PRICE |
CHANGE
(%Change) |
Day High |
Volume
(% DAV)
(% 50 day avg vol) |
52 Wk Hi
% From Hi |
Featured
Date |
Price
Featured |
Pivot Featured |
|
Max Buy |
SMPL
-
NASDAQ
Simply Good Foods Co
Food-Confectionery
|
$34.65
|
+0.51
1.49% |
$34.97
|
264,778
37.08% of 50 DAV
50 DAV is 714,000
|
$35.25
-1.70%
|
12/28/2020
|
$30.40
|
PP = $31.44
|
|
MB = $33.01
|
Most Recent Note - 4/26/2021 5:21:36 PM
G - Posted a quiet gain today for its 2nd best ever close, still perched within close striking distance of its 52-week and all-time highs with volume totals cooling. Reported Feb '21 quarterly earnings +9% on +2% sales revenues versus the year ago period, below the +25% minimum earnings guideline (C criteria), raising fundamental concerns. Found prompt support near its 50 DMA line ($31.23) but its current Relative Strength Rating is 79, one notch below the 80+ minimum guideline for buy candidates.
>>> FEATURED STOCK ARTICLE : Perched Near High But Fundamental Concerns Were Raised - 4/14/2021 |
View all notes |
Set NEW NOTE alert |
Company Profile |
SEC
News |
Chart |
Request a new note
C
A
S
I |
IBP
-
NYSE
Installed Building Prod
DIVERSIFIED SERVICES - Business/Management Services
|
$132.12
|
-0.88
-0.66% |
$133.50
|
114,009
51.13% of 50 DAV
50 DAV is 223,000
|
$135.63
-2.59%
|
4/19/2021
|
$131.15
|
PP = $130.21
|
|
MB = $136.72
|
Most Recent Note - 4/23/2021 12:41:11 PM
Y - Hovering near its all-time high with today's volume-driven gain. A gain and strong close above its pivot point may help clinch a convincing technical buy signal. Reported earnings +34% on +10% sales revenues for the Dec '20 quarter versus the year-ago period. Three of the past 4 consecutive quarterly comparisons were above the +25% minimum earnings guideline (C criteria). Annual earnings (A criteria) history has been strong.
>>> FEATURED STOCK ARTICLE : Steady Streak of Gains Into New High Territory - 4/19/2021 |
View all notes |
Set NEW NOTE alert |
Company Profile |
SEC
News |
Chart |
Request a new note
C
A
S
I |
QRVO
-
NASDAQ
Qorvo Inc
ELECTRONICS - Semiconductor - Integrated Cir
|
$197.05
|
-1.33
-0.67% |
$198.77
|
665,658
57.83% of 50 DAV
50 DAV is 1,151,000
|
$201.50
-2.21%
|
4/1/2021
|
$190.48
|
PP = $191.92
|
|
MB = $201.52
|
Most Recent Note - 4/23/2021 5:08:25 PM
Y - Posted a big gain today with light volume, rising from its 50 DMA line ($180.55). That important short-term average acted as support when it stalled after recently wedging up to new highs from a 9-week base. Its Relative Strength Rating has slumped to 77, below the 80+ minimum for buy candidates.
>>> FEATURED STOCK ARTICLE : Hit Another New High With Even Less Volume Conviction - 4/5/2021 |
View all notes |
Set NEW NOTE alert |
Company Profile |
SEC
News |
Chart |
Request a new note
C
A
S
I |
YETI
-
NYSE
Yeti Holdings Inc
Leisure-Products
|
$87.62
|
-0.72
-0.82% |
$87.76
|
817,768
60.17% of 50 DAV
50 DAV is 1,359,000
|
$89.70
-2.32%
|
4/6/2021
|
$76.95
|
PP = $79.42
|
|
MB = $83.39
|
Most Recent Note - 4/27/2021 5:34:08 PM
G - Perched at its all-time high, extended from the latest base, it posted a 3rd consecutive gain today with lighter volume. Prior highs in the $80 area define initial support to watch on pullbacks.
>>> FEATURED STOCK ARTICLE : YETI Perched Within Striking Distance of High - 4/7/2021 |
View all notes |
Set NEW NOTE alert |
Company Profile |
SEC
News |
Chart |
Request a new note
C
A
S
I |
DT
-
NYSE
Dynatrace Inc
Computer Sftwr-Enterprse
|
$54.56
|
-0.25
-0.46% |
$55.25
|
937,737
45.72% of 50 DAV
50 DAV is 2,051,000
|
$56.94
-4.18%
|
4/26/2021
|
$54.43
|
PP = $57.04
|
|
MB = $59.89
|
Most Recent Note - 4/26/2021 5:17:34 PM
Y - Today it posted a 4th consecutive gain on below average volume, rebounding above its 50 DMA line toward its 52-week high. Color code is changed to yellow with new pivot point cited based on its 3/16/21 high plus 10 cents. Subsequent gains above the pivot point backed by at least +40% above average volume may trigger a new (or add-on) technical buy signal. Recent lows in the $45 area define important near-term support to watch on pullbacks. Its Relative Strength Rating is 72, below the 80+ minimum guideline for buy candidates, however it is perched only -4.4% off its all-time high. Fundamentals remain strong after it reported Dec '20 earnings +70% on +28% sales revenues versus the year ago period.
>>> FEATURED STOCK ARTICLE : Gap Up Rebounding Further Above 50-Day Moving Average - 4/8/2021 |
View all notes |
Set NEW NOTE alert |
Company Profile |
SEC
News |
Chart |
Request a new note
C
A
S
I |
Symbol/Exchange
Company Name
Industry Group |
PRICE |
CHANGE
(%Change) |
Day High |
Volume
(% DAV)
(% 50 day avg vol) |
52 Wk Hi
% From Hi |
Featured
Date |
Price
Featured |
Pivot Featured |
|
Max Buy |
MRBK
-
NASDAQ
Meridian Corp
Banks-Northeast
|
$25.81
|
-0.51
-1.94% |
$27.00
|
44,629
120.62% of 50 DAV
50 DAV is 37,000
|
$27.96
-7.69%
|
2/22/2021
|
$25.58
|
PP = $26.10
|
|
MB = $27.41
|
Most Recent Note - 4/27/2021 12:54:01 PM
Y - Color code is changed to yellow while rebounding above its 50 DMA line ($25.63). Reported Mar '21 earnings +323% on +93% sales revenues versus the year ago period, continuing its strong earnings track record. Recent low ($24.01 on 4/21/21) defines important near-term support where any violation may trigger a worrisome technical sell signal. Its Relative Strength Rating is 79, just below the 80+ minimum guideline.
>>> FEATURED STOCK ARTICLE : Encountering Distributional Pressure - 4/12/2021 |
View all notes |
Set NEW NOTE alert |
Company Profile |
SEC
News |
Chart |
Request a new note
C
A
S
I |
|
|
|
THESE ARE NOT BUY RECOMMENDATIONS!
Comments contained in the body of this report are technical
opinions only. The material herein has been obtained
from sources believed to be reliable and accurate, however,
its accuracy and completeness cannot be guaranteed.
This site is not an investment advisor, hence it does
not endorse or recommend any securities or other investments.
Any recommendation contained in this report may not
be suitable for all investors and it is not to be deemed
an offer or solicitation on our part with respect to
the purchase or sale of any securities. All trademarks,
service marks and trade names appearing in this report
are the property of their respective owners, and are
likewise used for identification purposes only.
This report is a service available
only to active Paid Premium Members.
You may opt-out of receiving report notifications
at any time. Questions or comments may be submitted
by writing to Premium Membership Services 665 S.E. 10 Street, Suite 201 Deerfield Beach, FL 33441-5634 or by calling 1-800-965-8307
or 954-785-1121.
|
|
|